. 2024 Nov 5;21(1):287.
doi: 10.1186/s12974-024-03270-w.

Coenzyme A fueling with pantethine limits autoreactive T cell pathogenicity in experimental neuroinflammation

Affiliations

Coenzyme A fueling with pantethine limits autoreactive T cell pathogenicity in experimental neuroinflammation

Stefano Angiari et al. J Neuroinflammation. .

Abstract

Background: Immune cell metabolism governs the outcome of immune responses and contributes to the development of autoimmunity by controlling lymphocyte pathogenic potential. In this study, we evaluated the metabolic profile of myelin-specific murine encephalitogenic T cells, to identify novel therapeutic targets for autoimmune neuroinflammation.

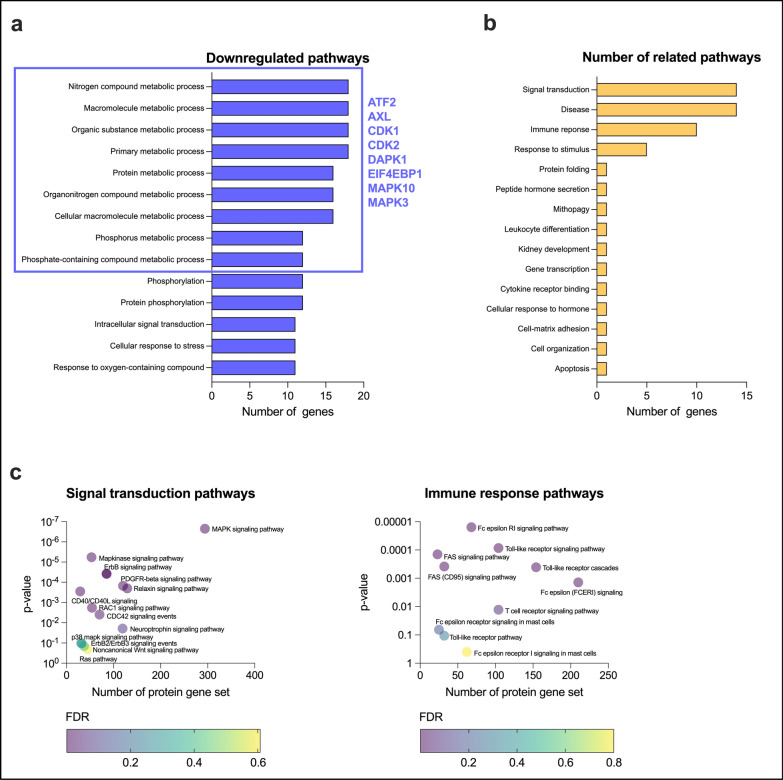
Methods: We performed metabolomics analysis on actively-proliferating encephalitogenic T cells to study their overall metabolic profile in comparison to resting T cells. Metabolomics, phosphoproteomics, in vitro functional assays, and in vivo studies in experimental autoimmune encephalomyelitis (EAE), a mouse model of multiple sclerosis (MS), were then implemented to evaluate the effect of metabolic targeting on autoreactive T cell pathogenicity. Finally, we confirmed the translational potential of our targeting approach in human pro-inflammatory T helper cell subsets and in T cells from MS patients.

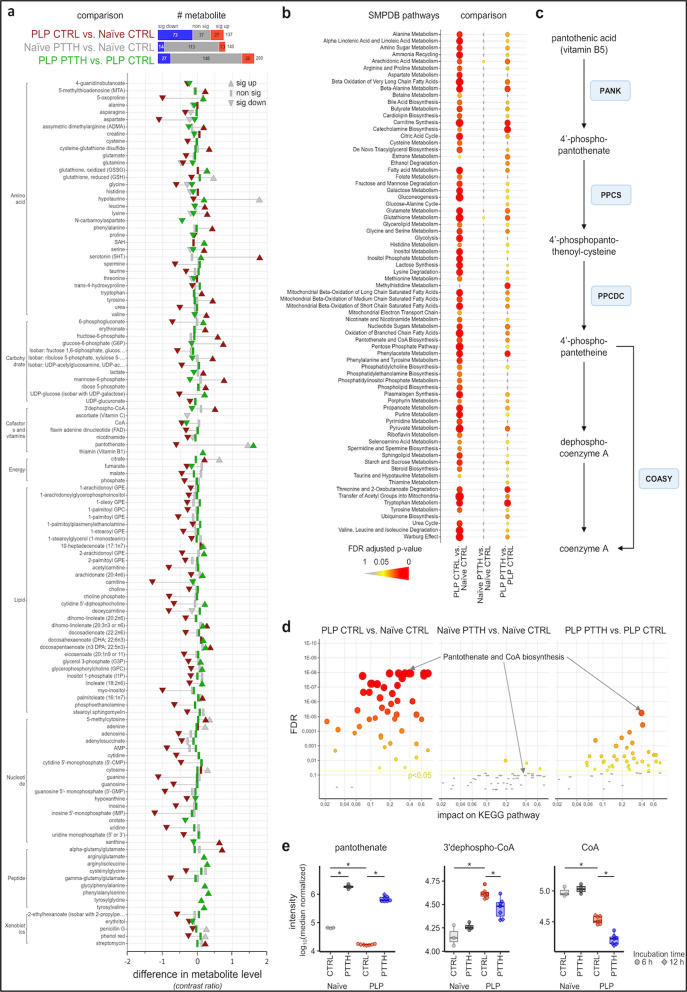
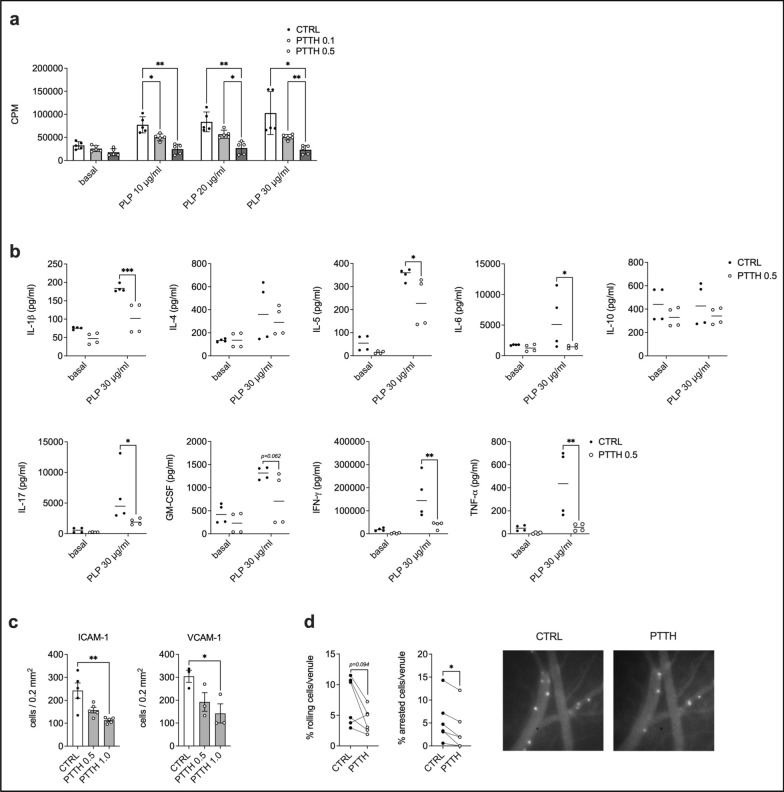
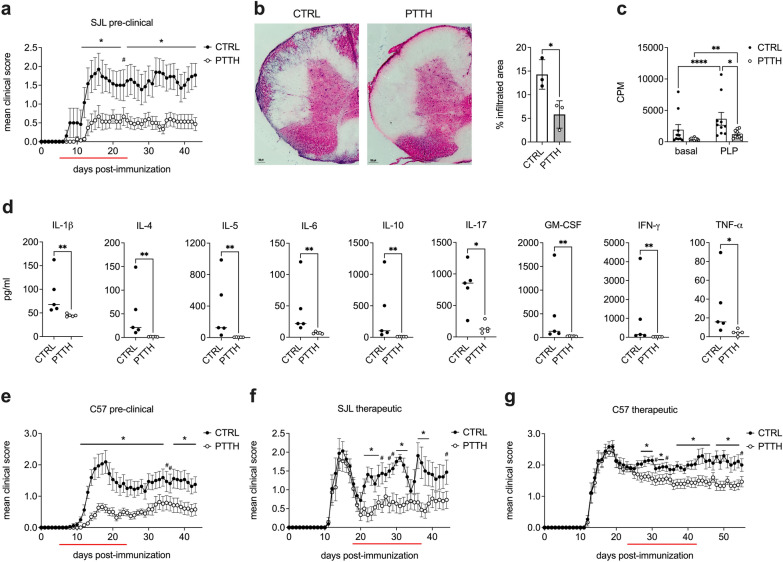
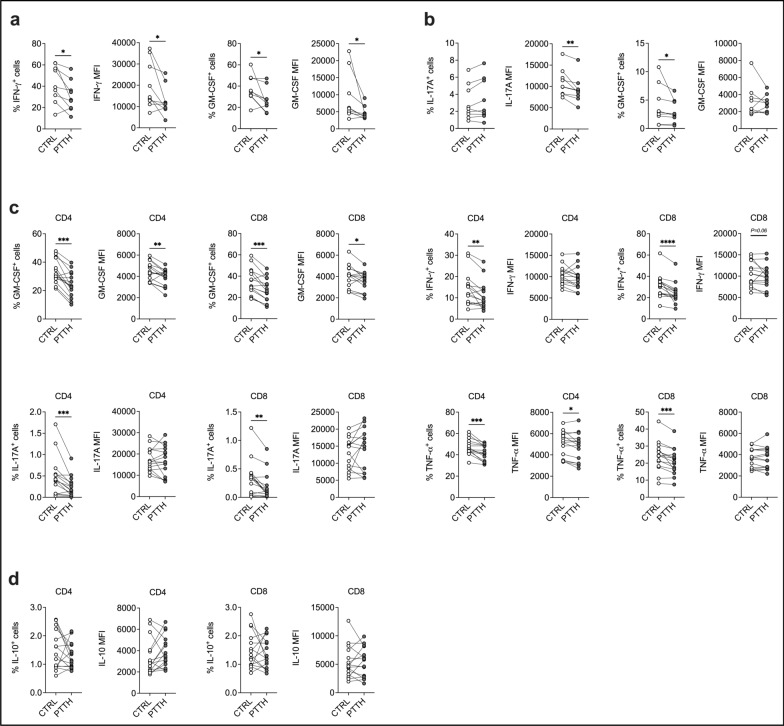
Results: We found that autoreactive encephalitogenic T cells display an altered coenzyme A (CoA) synthesis pathway, compared to resting T cells. CoA fueling with the CoA precursor pantethine (PTTH) affected essential immune-related processes of myelin-specific T cells, such as cell proliferation, cytokine production, and cell adhesion, both in vitro and in vivo. Accordingly, pre-clinical treatment with PTTH before disease onset inhibited the development of EAE by limiting T cell pro-inflammatory potential in vivo. Importantly, PTTH also significantly ameliorated the disease course when administered after disease onset in a therapeutic setting. Finally, PTTH reduced pro-inflammatory cytokine production by human T helper 1 (Th1) and Th17 cells and by T cells from MS patients, confirming its translational potential.

Conclusion: Our data demonstrate that CoA fueling with PTTH in pro-inflammatory and autoreactive T cells may represent a novel therapeutic approach for the treatment of autoimmune neuroinflammation.

Keywords: Autoreactive T cells; CoA metabolism; EAE; Immunometabolism; Multiple sclerosis; Pantethine.


Conflict of interest statement

The authors declare no competing interests.

Figures

Fig. 1
Fig. 1
Altered CoA synthesis in actively-proliferating PLP139-151 specific encephalitogenic T cells is restored by PTTH treatment. Actively-proliferating encephalitogenic T cells (PLP) were treated with either vehicle (CTRL) or PTTH 1.0 mM (PTTH) for 6 or 12 h prior to metabolomics analysis, and were compared to resting T cells (Naïve) with/without PTTH. a Dumbbell plot of metabolites with any significant change in one of the three comparisons of interest. The plot shows the strength of metabolic changes along the x-axis and the metabolite name and class on the y-axis with thin lines connecting the same metabolite. The FDR adjusted significance (p < 0.05) is encoded in shapes indicating also direction (up- or down-regulated). The bar chart beside the comparison (top) counts the number of significantly changed metabolites. b Results from the quantitative pathway enrichment analysis against SMPDB for each of the three comparisons of interest are plotted on the x-axis and the pathway names in alphabetic order on the y-axis. Non-significant pathways are represented as bars (FDR adjusted p > 0.05) and significant ones as circles. The FDR adjusted significance is also encoded into gradually increasing dot size and intensifying color with redder/larger for more significantly impacted pathways. c The CoA synthesis pathway. PANK: pantothenate kinase. PPCS: phosphopantothenate-cysteine ligase. PPCDC: phosphopantothenoylcysteine decarboxylase. COASY: coenzyme A synthase. d Quantitative pathway topological analysis results for each of the three comparisons of interest plotting the pathway impact on the x-axis against the FDR adjusted significance on the y-axis with the same shape, size and color settings as in b. e Box plots of different metabolites with middle lines marking the 50th percentile, box edges marking the 25th and 75th percentile and whiskers marking the 1.5 interquartile range. *p < 0.05 by linear mixed models (see ‘Methods‘ section for details). Data in a–d are from N = 3 (Naïve CTRL), N = 4 (Naïve PTTH), and N = 7 (PLP CTRL and PTTH) independent samples
Fig. 2
Fig. 2
Phosphoproteomics analysis revealed an immunomodulatory effect of PTTH in autoreactive encephalitogenic T cells. Actively-proliferating encephalitogenic T cells were treated with PTTH 1.0 mM for 6 h and analyzed in outsourcing for total protein expression and phosphorylation by Kinexus (see Supplementary data 2 for protein dataset). A bioinformatics analysis was then performed as described in the “Materials and methods” section. a Results from Gene GO analysis on down-regulated proteins following PTTH treatment are shown. b The bar plot represents the number of related pathways for each group calculated as described in the “Results” section. c Pathways included in the “Signal transduction” and “Immune response” group are shown. Data are from one representative encephalitogenic T cell line
Fig. 3
Fig. 3
Pantethine inhibits key pathogenic features of encephalitogenic T cells in vitro. a Non-proliferating encephalitogenic T cells were treated with vehicle (CTRL) or increasing mM concentrations of pantethine (PTTH) for 16 h, washed, and re-stimulated for 3 days with APCs and PLP139–151. Data are the mean ± SD of N = 5 independent cell lines. *p < 0.05 and **p < 0.01 by 2-way Anova with Tukey’s test for multiple comparisons. b Cytokine quantification in supernatants collected from the experiments performed in a. N = 4 independent cell lines. *p < 0.05, **p < 0.01, and ***p < 0.001 by 2-way Anova with Šídák’s test for multiple comparisons. For better clarity, only comparisons between CTRL and the corresponding PTTH conditions are show. c Activated PLP139-151-specific T cells were treated with vehicle (CTRL) or increasing mM concentrations of PTTH for 6 h. Cells were then left to spontaneously adhere on glass slides pre-coated with ICAM-1 of VCAM-1. Data are the mean ± SEM of 5 (ICAM-1) or 3 (VCAM-1) independent experiments. *p < 0.05 by Friedman test with Dunn’s test for multiple comparisons. d Left—Activated encephalitogenic T cells were treated with vehicle (CTRL) or PTTH 1.0 mM and injected in LPS-treated mice to analyze their adhesive potential in vivo. *p < 0.05 by Wilcoxon test. Data obtained analyzing 6 venules from 3 independent experiments are shown. Right—representative images of brain pial venules upon injection with CTRL or PTTH-treated cells. Cells are the white dots in the blood vessels
Fig. 4
Fig. 4
Pantethine affects RR-EAE and chronic EAE development and has immunomodulatory properties in vivo. a SJL EAE-immunized mice were treated i.p. with saline (CTRL) or 30 mg/day of pantethine (PTTH) from day + 5 post-immunization for 20 consecutive days (red line). *p < 0.05 and #p < 0.1 by two-tailed Student’s t-test. Data are the mean ± SEM of two independent experiments. See Table 2 for quantification of the results. b Left: representative image of H/E staining of SC sections from vehicle- (CTRL) or PTTH-treated mice collected at disease peak from SJL mice undergoing a pre-clinical treatment regime. Right: infiltrates were identified in 3 CTRL and 3 PTTH-treated mice. The % of area showing immune cell infiltration on the total SC area is shown. *p < 0.05 by unpaired t-test. c Total LN cells were collected at disease peak from CTRL and PTTH-treated mice, and re-stimulated ex-vivo with PLP139-151 peptide. Data are the mean ± SD of 10 mice/condition from two independent experiments. *p < 0.05 and **p < 0.01 and ****p < 0.0001 by 2-way Anova with Šídák’s test for multiple comparisons. (d The amount of the displayed cytokines was quantified in the supernatants of proliferation experiments in c, analyzing their levels in PLP139-155-restimulated samples. Data represent N = 5 mice/condition from one representative experiment. *p < 0.05 and **p < 0.01 by Mann–Whitney test. e C57Bl EAE-immunized mice were treated i.p. with saline (CTRL mice) or 30 mg/day of PTTH from day + 5 post-immunization for 20 consecutive days (red line). *p < 0.05 and #p < 0.1 by two-tailed Student’s t-test. Data are the mean ± SEM of two independent experiments. See Table 2 for quantification of the results. f, g SJL (f) or C57Bl (g) EAE-immunized mice were treated i.p. with saline (CTRL) or 30 mg/day of PTTH from day + 18 post-immunization (SJL mice) or from day + 23 post-immunization (C57Bl/6 mice) for 20 consecutive days (red line). *p < 0.05 and #p < 0.1 by two-tailed Student’s t-test. Data are the mean ± SEM of two independent experiments. See Table 3 for quantification of the results
Fig. 5
Fig. 5
PTTH limits the pro-inflammatory potential of human Th1 and Th17 cells and of T cells from MS patients. a, b Naïve CD4+ T cells were activated in vitro under Th1- (a) or Th17-polarizing conditions (b) in the presence of vehicle (CTRL) or PTTH 1.0 mM. Cytokine production was evaluated by intracellular cytokine staining at the end of the culture (day + 5). *p < 0.05 and **p < 0.01 by Wilcoxon test. N = 9 independent donors. (c, d) PBMCs from MS patients were activated in vitro with CD3/CD28 antibodies. Cytokine production was evaluated by intracellular cytokine staining at the end of the culture (day + 5). *p < 0.05, **p < 0.01, ***p < 0.001, and ****p < 0.0001 by Wilcoxon test. N = 15 independent patients

Similar articles

Cited by

References

    1. Abou-Hamdan M, Gharib B, Bajenoff M, Julia V, de Reggi M. Pantethine down-regulates leukocyte recruitment and inflammatory parameters in a mouse model of allergic airway inflammation. Med Sci Monit Basic Res. 2017;27(23):368–72. 10.12659/msmbr.904077. - PMC - PubMed
    1. Angiari S, Rossi B, Piccio L, Zinselmeyer BH, Budui S, Zenaro E, Della Bianca V, Bach SD, Scarpini E, Bolomini-Vittori M, Piacentino G, Dusi S, Laudanna C, Cross AH, Miller MJ, Constantin G. Regulatory T cells suppress the late phase of the immune response in lymph nodes through P-selectin glycoprotein ligand-1. J Immunol. 2013;191(11):5489–500. 10.4049/jimmunol.1301235. - PMC - PubMed
    1. Angiari S, Runtsch MC, Sutton CE, Palsson-McDermott EM, Kelly B, Rana N, Kane H, Papadopoulou G, Pearce EL, Mills KHG, O’Neill LAJ. Pharmacological activation of pyruvate kinase M2 inhibits CD4+ T cell pathogenicity and suppresses autoimmunity. Cell Metab. 2020;31(2):391-405.e8. 10.1016/j.cmet.2019.10.015. - PMC - PubMed
    1. Attfield KE, Jensen LT, Kaufmann M, Friese MA, Fugger L. The immunology of multiple sclerosis. Nat Rev Immunol. 2022;22(12):734–50. 10.1038/s41577-022-00718-z. - PubMed
    1. Bantug GR, Galluzzi L, Kroemer G, Hess C. The spectrum of T cell metabolism in health and disease. Nat Rev Immunol. 2018;18(1):19–34. 10.1038/nri.2017.99. - PubMed

MeSH terms

LinkOut - more resources