. 2024 Nov 5;22(1):997.
doi: 10.1186/s12967-024-05758-8.

From inflammation to depression: key biomarkers for IBD-related major depressive disorder

Affiliations

From inflammation to depression: key biomarkers for IBD-related major depressive disorder

Chaoqun Hu et al. J Transl Med. .

Abstract

Background: Inflammatory bowel disease (IBD) is a chronic, inflammatory, and autoimmune disorder, and its incidence of comorbid with major depressive disorder (MDD) is significantly higher than the general population. However, many patients lack proper recognition and necessary psychological health treatments. We aimed to identify potential biomarkers and mechanisms involved in the development of IBD comorbid with MDD (IBD-MDD).

Methods: We utilized IBD and MDD-related datasets from the GEO database for differential gene expression analysis, protein-protein interaction (PPI) and pathway enrichment analysis, random forest algorithm, LASSO regression analysis, and construction of a disease prediction model. We assessed the accuracy of the model using ROC curve, explored potential mechanisms through immune infiltration analysis, and validated candidate biomarkers using peripheral blood samples from patients in our center's cohort.

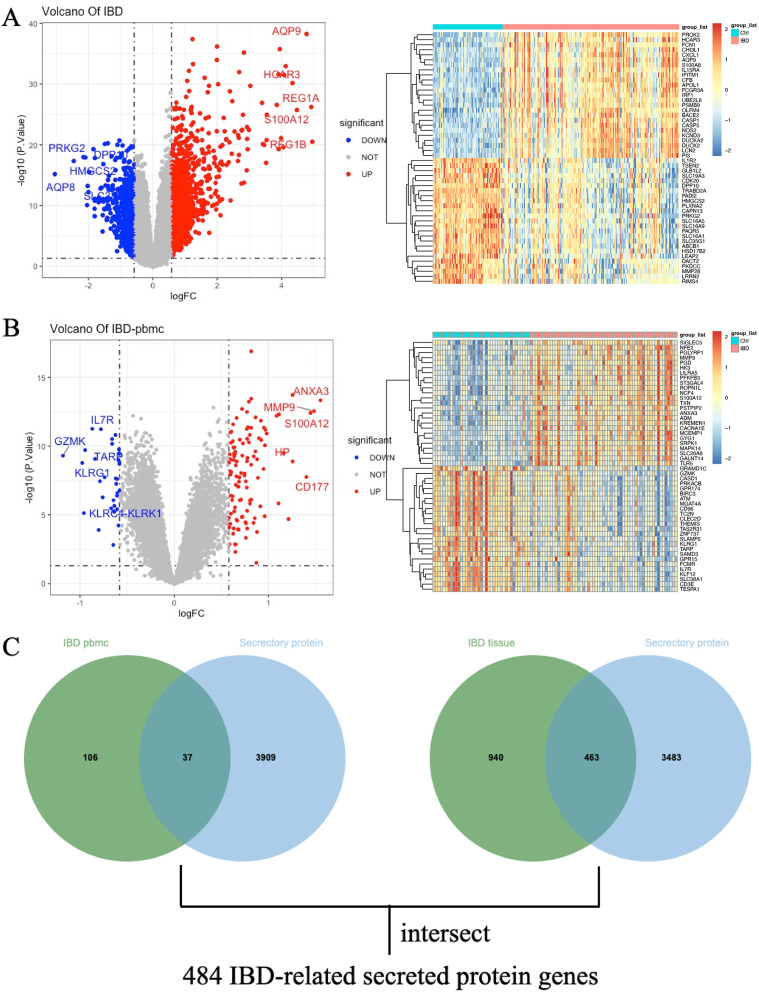
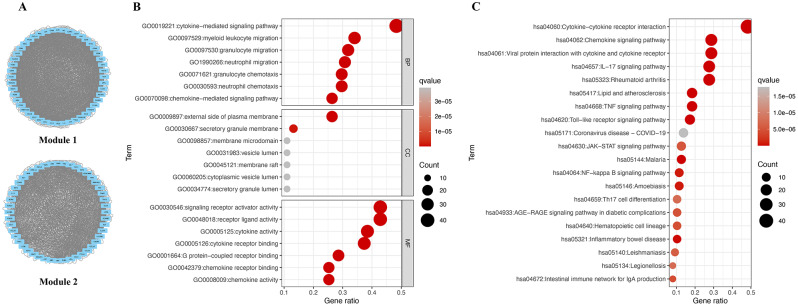
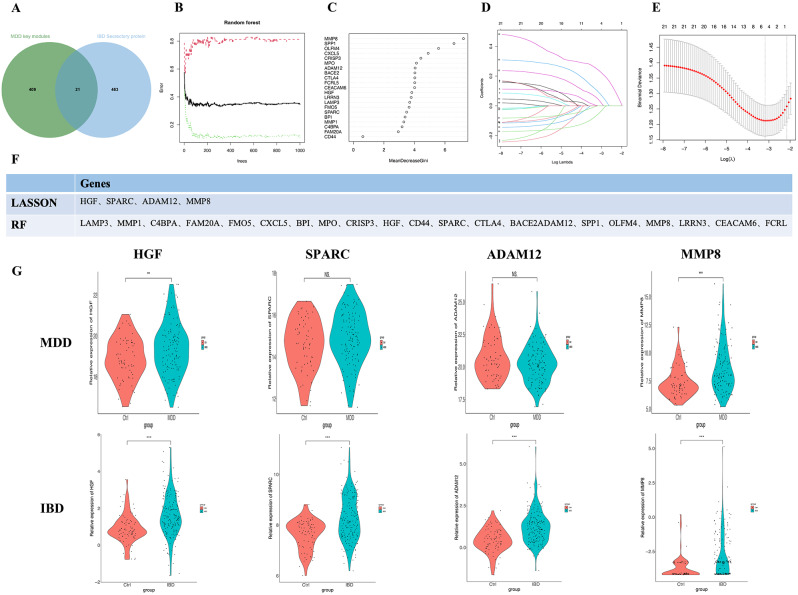
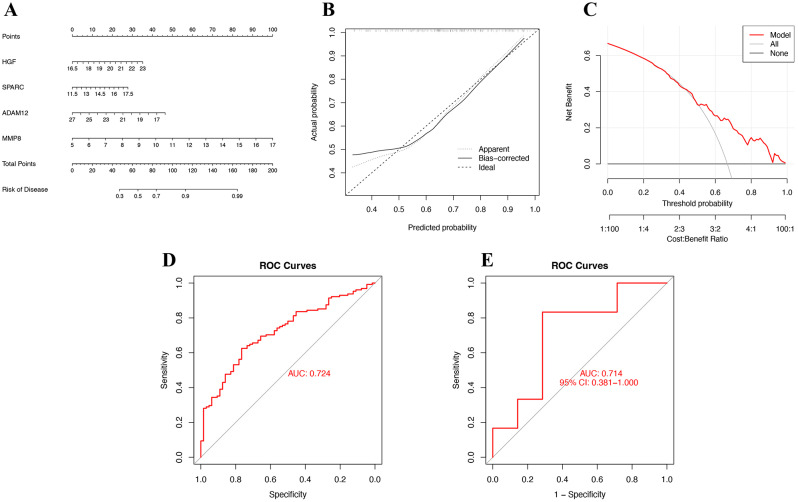
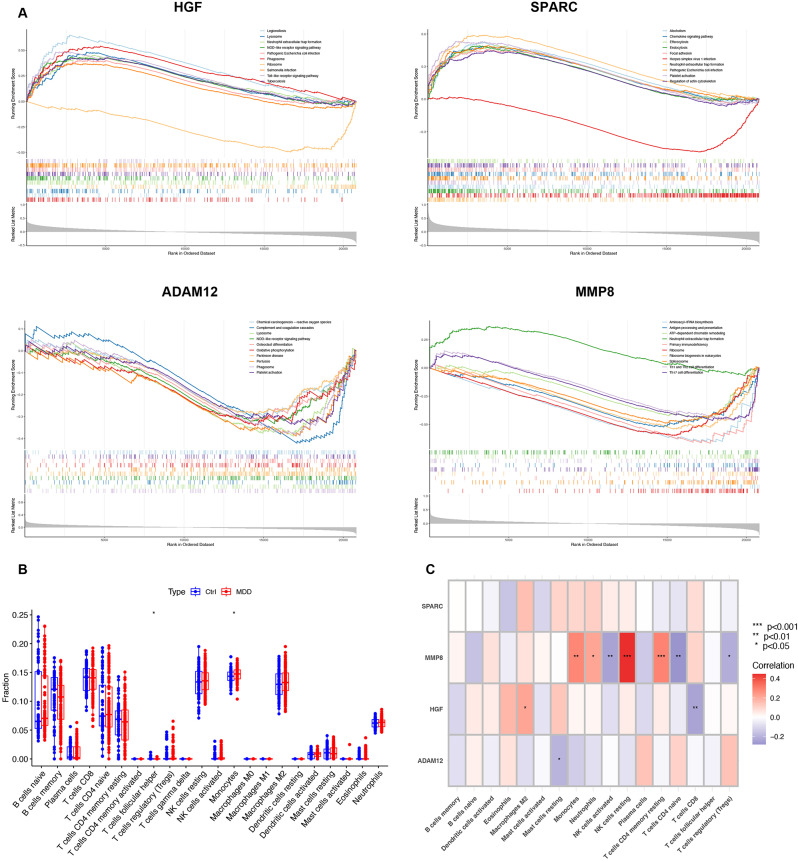
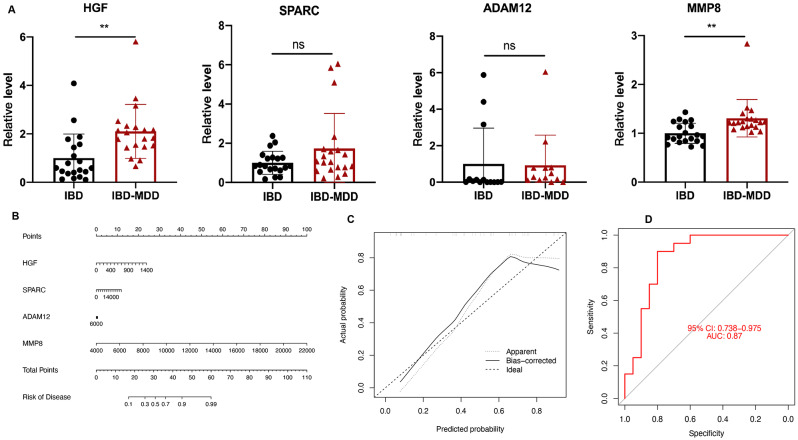
Results: We identified 484 IBD-related secreted proteins and 142 key module genes associated with MDD. PPI analysis revealed two crucial modules primarily involved in inflammation and immune regulation. We identified four diagnostic genes (HGF, SPARC, ADAM12, and MMP8) from the 21 shared genes between IBD-related secreted proteins and MDD key module genes, constructed a nomogram model and confirmed its accuracy using ROC curve from an external independent dataset. Immune infiltration analysis revealed significant associations between the four diagnostic genes, and cellular immune dysregulation in MDD. Finally, we validated the expression patterns of the four diagnostic genes in our cohort.

Conclusions: Our study discovered four candidate biomarkers for IBD-MDD, providing new insights for the diagnosis and therapeutic intervention of serum-based IBD comorbid with MDD.

Keywords: Diagnostic value; Immune cell infiltration; Inflammatory bowel disease; Major depressive disorder; Serum secretory proteins.


Conflict of interest statement

The authors declared no competing interests.

Figures

Fig. 1
Fig. 1
Flow chart of this study
Fig. 2
Fig. 2
Integration and differential expression analysis of the IBD dataset. A. Volcano plot of DEGs in IBD intestinal tissue samples and heatmap of the top 50 upregulated and downregulated DEGs. B. Volcano plot of DEGs in IBD peripheral blood samples and heatmap of the top 50 upregulated and downregulated DEGs. Upregulated genes are represented by red dots, while downregulated genes are represented by blue dots. C. Venn diagrams showing the intersection of intestinal tissue and peripheral blood samples with secreted protein genes, resulting in 463 IBD-related secreted protein genes and 37 IBD-PBMC-related secreted protein genes. Further intersection yielded 484 IBD-related secreted protein genes
Fig. 3
Fig. 3
Identification of key module genes in the MDD dataset using WGCNA. A, B. Determination of the optimal β value using a scale-free topology model, with β = 10 selected as the soft threshold based on average connectivity and scale independence. C. Gene dendrogram and module-feature gene network heatmap. D. Heatmap revealing the relationship between module-feature genes and MDD status. The gray module, which exhibited the highest correlation coefficient with MDD, was identified as the key module for MDD. E. Correlation plot of gray module members and gene significance in the gray module
Fig. 4
Fig. 4
PPI analysis of IBD-related secreted proteins and key genes in MDD. A. PPI network of the top-scoring modules’ genes based on MCODE analysis in Cytoscape. B, C. Bubble plots showing the results of GO and KEGG enrichment analysis
Fig. 5
Fig. 5
Identification of potential diagnostic biomarkers for IBD-related MDD using machine learning approaches. A. Venn diagram showing the overlap of 21 common genes between IBD-related secreted proteins and key genes in MDD. B, C. MeanDecreaseGini plots of the 21 genes in MDD using the Random Forest (RF) algorithm. D, E. Identification of the minimum value and lambda value for diagnostic biomarker selection using the LASSO logistic regression algorithm. F. Intersection of candidate genes selected by LASSO and RF algorithms, resulting in four potential pathogenic feature genes: HGF, SPARC, ADAM12, and MMP8. G, H. Expression levels of the four feature genes in the MDD dataset (GSE98793) and the IBD dataset
Fig. 6
Fig. 6
Development and evaluation of the diagnostic nomogram model. A. nomogram constructed based on diagnostic biomarkers. B. Calibration curve of the nomogram model predicting MDD in IBD-related MDD. The dashed line labeled “Ideal” represents the standard curve, indicating perfect prediction by an ideal model. The dashed line labeled “Apparent” represents the uncalibrated prediction curve, while the solid line labeled “Bias-Corrected” represents the calibrated prediction curve. C. Decision curve analysis (DCA) of the nomogram model. The black line labeled “None” represents the net benefit assuming no patients have MDD. The gray line labeled “All” represents the net benefit assuming all patients have MDD, while the red line labeled “Model” represents the net benefit assuming the identification of IBD-related MDD based on the nomogram model. D. Receiver Operating Characteristic (ROC) curve of the diagnostic performance of the nomogram model for predicting MDD in the internal dataset from the GEO database. E. ROC curve of the diagnostic performance of the nomogram model for predicting MDD in the external dataset from the GEO database
Fig. 7
Fig. 7
Single-gene enrichment analysis and immune infiltration analysis of candidate biomarkers. A. GSEA analysis and KEGG enrichment of the four feature genes. B. Violin plots comparing the 22 immune cell types between the MDD group and the control group. C. Heatmap revealing the correlation of immune cell infiltration above the p < 0.05 threshold
Fig. 8
Fig. 8
Validation of the expression patterns of the four candidate diagnostic biomarkers in IBD and IBD-MDD serum samples, and evaluation of the diagnostic performance of the nomogram model for differentiating MDD. A. ELISA results showing significant elevation of HGF and MMP8 levels in the serum of IBD-MDD patients, with an increasing trend in SPARC and ADAM12. B. Nomogram model developed based on the four diagnostic biomarkers for predicting the risk of MDD. C. Calibration curve of the nomogram model predicting MDD in the IBD patients. D. ROC curve of the predictive performance of the four candidate biomarkers and the nomogram model. ** P value<0.01, ns: no significance

References

    1. Khor B, Gardet A, Xavier RJ. Genetics and pathogenesis of inflammatory bowel disease. Nature. 2011;474:307–17. - PMC - PubMed
    1. Ng SC, Shi HY, Hamidi N, Underwood FE, Tang W, Benchimol EI, et al. Worldwide incidence and prevalence of inflammatory bowel disease in the 21st century: a systematic review of population-based studies. Lancet. 2017;390:2769–78. - PubMed
    1. Ungaro R, Mehandru S, Allen PB, Peyrin-Biroulet L, Colombel JF. Ulcerative colitis. Lancet. 2017;389:1756–70. - PMC - PubMed
    1. Torres J, Mehandru S, Colombel JF, Peyrin-Biroulet L. Crohn’s disease. Lancet. 2017;389:1741–55. - PubMed
    1. Neuendorf R, Harding A, Stello N, Hanes D, Wahbeh H. Depression and anxiety in patients with inflammatory bowel disease: a systematic review. J Psychosom Res. 2016;87:70–80. - PubMed

LinkOut - more resources