

The role of gut microbiota in a generalist, golden snub-nosed monkey, adaptation to geographical diet change
- PMID: 39501342
- PMCID: PMC11536711
- DOI: 10.1186/s42523-024-00349-w
The role of gut microbiota in a generalist, golden snub-nosed monkey, adaptation to geographical diet change
Abstract
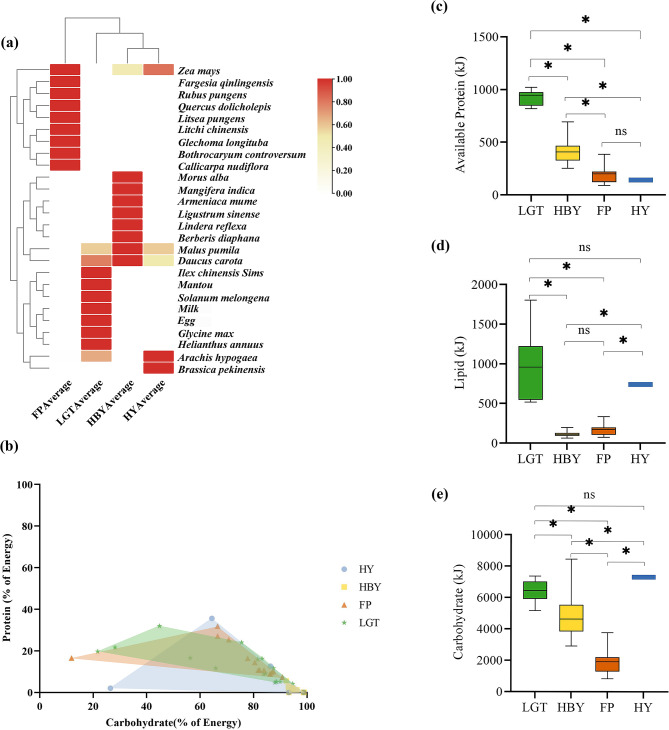
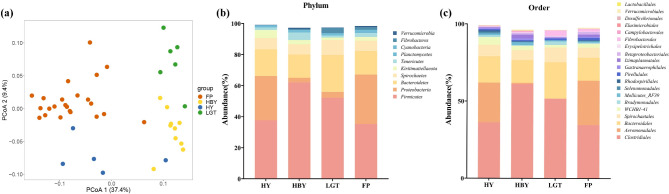
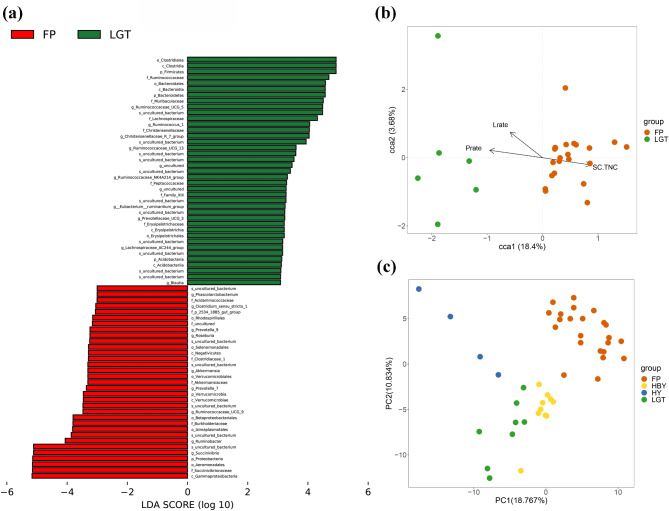
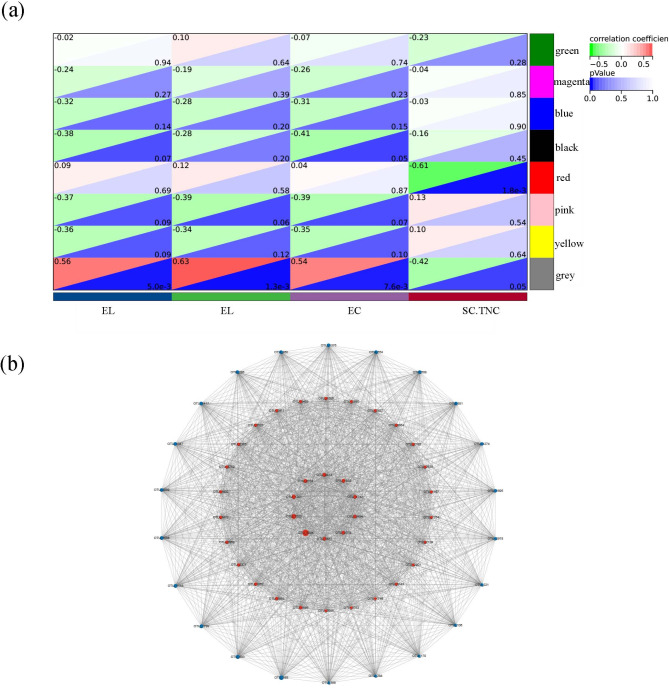
Changes in diet causing ecological stress pose a significant challenge to animal survival. In response, the gut microbiota, a crucial part of the host's digestive system, exhibits patterns of change reflective of alterations in the host's food component. The impact of temporal dietary shifts on gut microbiota has been elucidated through multidimensional modeling of both food component and macronutrient intake. However, the broad distribution of wild generalist and the intricate complexity of their food component hinder our capacity to ascertain the degree to which their gut microbiota assist in adapting to spatial dietary variations. We examined variation in patterns of the gut microbial community according to changes in diet and in a colobine monkey with a regional variable diet, the golden snub-nosed monkey (Rhinopithecus roxellana). Specifically, we analyse the interactions between variation in food component, macronutrient intake and the gut microbial community. We compared monkeys from four populations by quantifying food component and macronutrient intake, and by sequencing 16S rRNA and the microbial macro-genomes from the faecal samples of 44 individuals. We found significant differences in the diets and gut microbial compositions, in nutrient space and macronutrient intake among some populations. Variations in gut microbiota composition across distinct populations mirror the disparities in macronutrient intake, with a notable emphasis on carbohydrate. Geographical differences in the diet among of golden snub-nosed monkey populations will result in macronutrient intake variation, with corresponding differences in macronutrient intake driving regional differences in the compositions and abundances of gut microbiota. Importantly, the gut microbiota associated with core digestive functions does not vary, with the non-core gut microbiota fluctuating in response to variation in macronutrient intake. This characteristic may enable species heavily reliant on gut microbiota for digestion to adapt to diet changes. Our results further the understanding of the roles gut microbiota play in the formation of host dietary niches.
Keywords: Dietary niches; Gut microbiota; Macronutrient intake; Primate; Weighted gene co-expression network.
© 2024. The Author(s).
Conflict of interest statement
The authors declare no competing interests.
Figures
Similar articles
-
Does diet or macronutrients intake drive the structure and function of gut microbiota?Front Microbiol. 2023 Feb 13;14:1126189. doi: 10.3389/fmicb.2023.1126189. eCollection 2023. Front Microbiol. 2023. PMID: 36860485 Free PMC article.
-
Comparative Analysis of Gut Microbiota between Wild and Captive Golden Snub-Nosed Monkeys.Animals (Basel). 2023 May 12;13(10):1625. doi: 10.3390/ani13101625. Animals (Basel). 2023. PMID: 37238055 Free PMC article.
-
Comparative study of the gut microbiota in three captive Rhinopithecus species.BMC Genomics. 2023 Jul 14;24(1):398. doi: 10.1186/s12864-023-09440-z. BMC Genomics. 2023. PMID: 37452294 Free PMC article.
-
Dietary glycation compounds - implications for human health.Crit Rev Toxicol. 2024 Sep;54(8):485-617. doi: 10.1080/10408444.2024.2362985. Epub 2024 Aug 16. Crit Rev Toxicol. 2024. PMID: 39150724
-
Recent Advances in Genetics and Genomics of Snub-Nosed Monkeys (Rhinopithecus) and Their Implications for Phylogeny, Conservation, and Adaptation.Genes (Basel). 2023 Apr 27;14(5):985. doi: 10.3390/genes14050985. Genes (Basel). 2023. PMID: 37239345 Free PMC article. Review.
References
-
- Slatyer RA, Hirst M, Sexton JP. Niche breadth predicts geographical range size: a general ecological pattern. Eco Lett. 2013;16(8):1104–14. 10.1111/ele.12140 - PubMed
-
- Brown JH. On the relationship between abundance and distribution of species. AM NAT. 1984;124(2):255–79. 10.7208/9780226115504-035
-
- Hardy NB, Kaczvinsky C, Bird G, Normark BB. What we don’t know about diet-breadth evolution in herbivorous insects. Annu Rev Ecol Evol S. 2020;51(1):103–22. 10.1146/annurev-ecolsys-011720-023322
-
- Hahn PG, Cammarano JH. Environmental context and herbivore traits mediate the strength of associational effects in a meta-analysis of crop diversity. J Appl Ecol. 2023;60(5):875–85. 10.1111/1365-2664.14382
-
- Hou R, Chapman CA, Jay O, Guo ST, Li BG, Raubenheimer D. Cold and hungry: combined effects of low temperature and resource scarcity on an edge-of‐range temperate primate, the golden snub‐nose monkey. Ecography. 2020;43(11):1672–82. 10.1111/ecog.05295
Grants and funding
- 32371563/Natural Science Foundation of China under Grant
- 32220103002/Major International Joint Research Program of Natural Science Foundation of China under Grant
- 32370534/National Natural Science Foundation of General Project under Grant
- S2021-ZC GHID-0013/Innovation Support Plan of Shaanxi Province under Grant
LinkOut - more resources
Full Text Sources