. 2024 Nov;13(21):e70082.
doi: 10.1002/cam4.70082.

Combined inhibition of histone methyltransferases EZH2 and DOT1L is an effective therapy for neuroblastoma

Affiliations

Combined inhibition of histone methyltransferases EZH2 and DOT1L is an effective therapy for neuroblastoma

Janith A Seneviratne et al. Cancer Med. 2024 Nov.

Abstract

Background: The child cancer, neuroblastoma (NB), is characterised by a low incidence of mutations and strong oncogenic embryonal driver signals. Many new targeted epigenetic modifier drugs have failed in human trials as monotherapy.

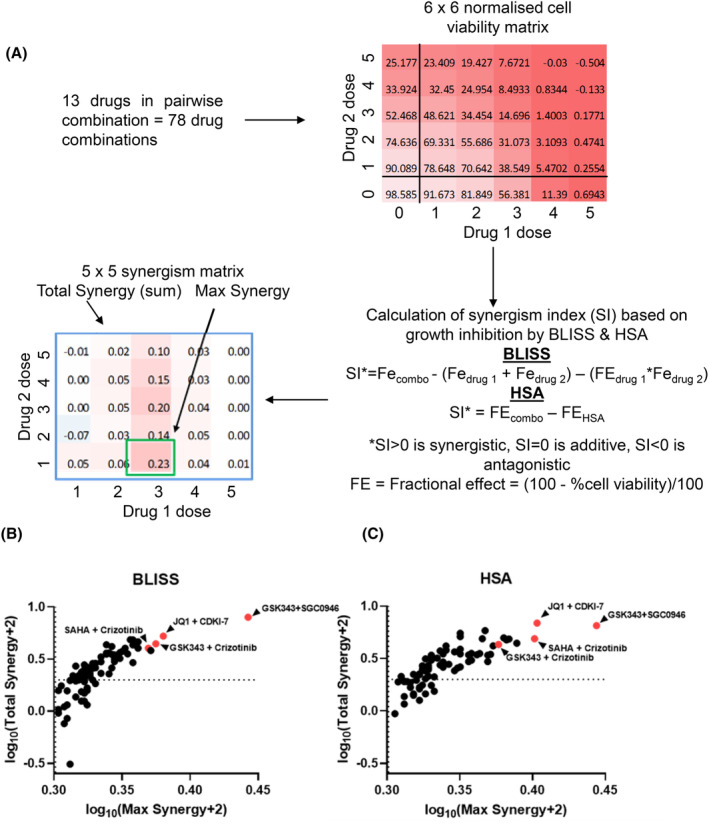
Methods: We performed a high-throughput, combination chromatin-modifier drug screen against NB cells. We screened 13 drug candidates in 78 unique combinations.

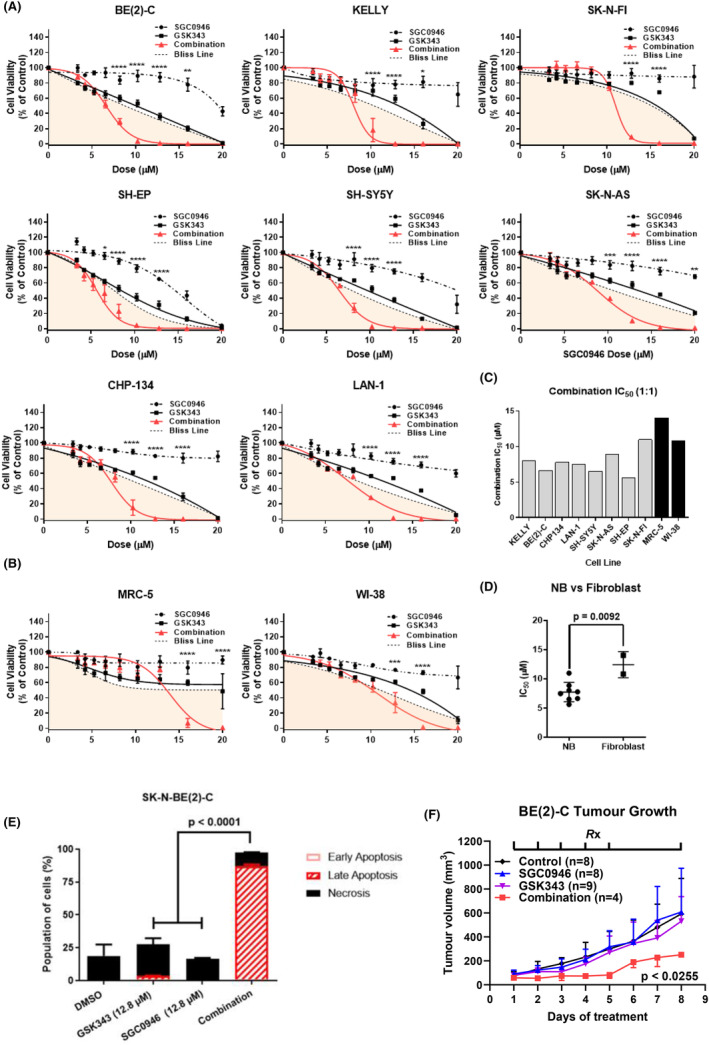
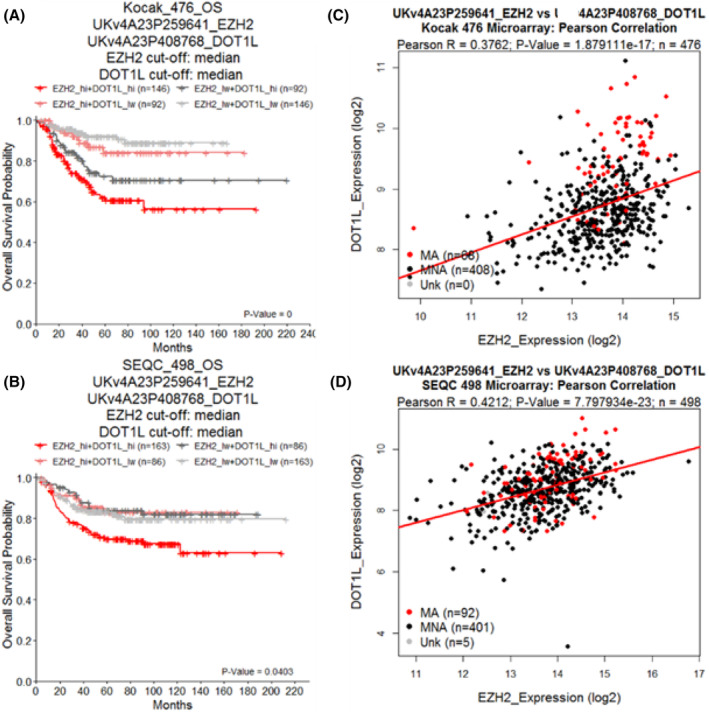
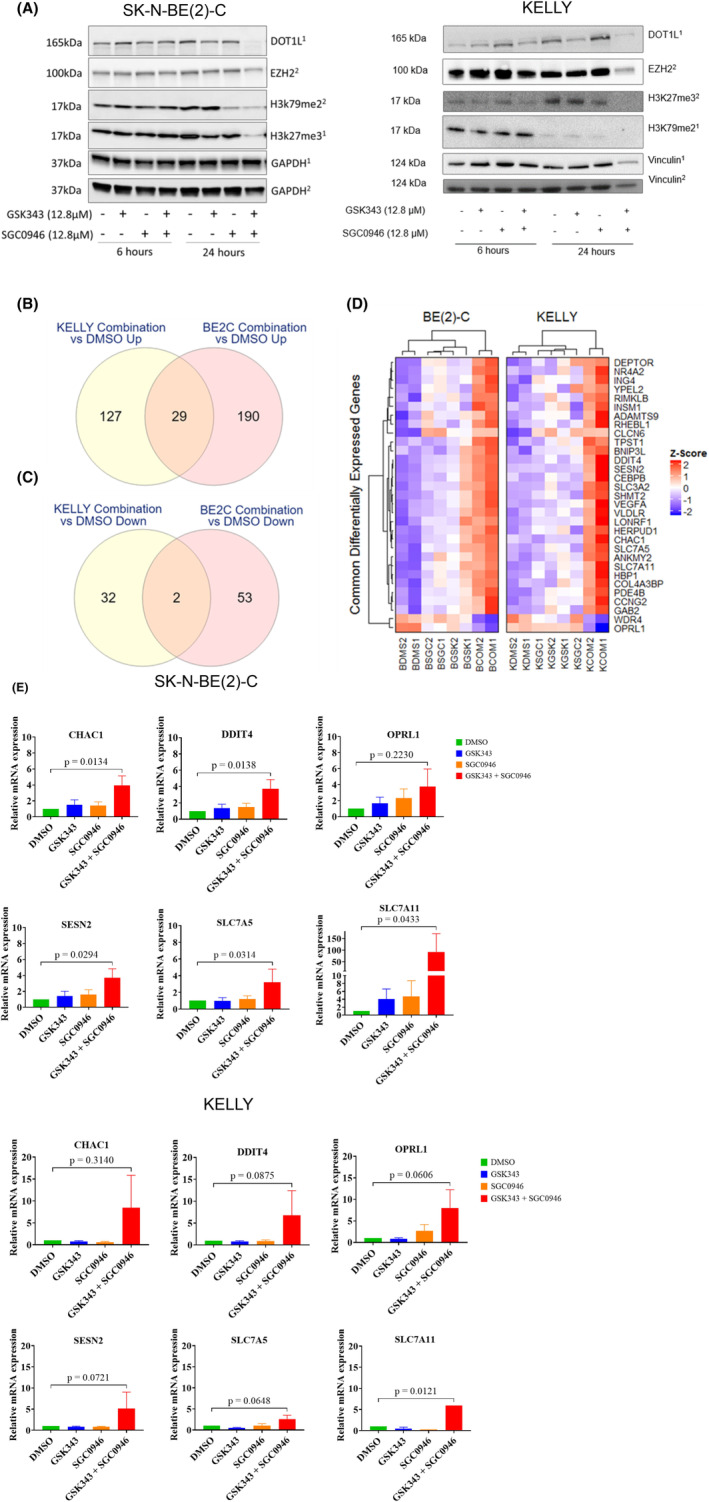
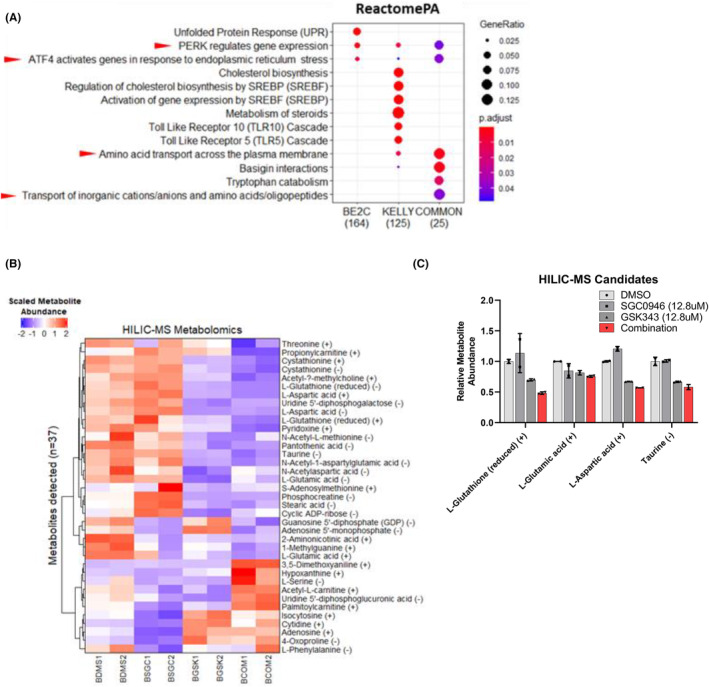
Results: We found that the combination of two histone methyltransferase (HMT) inhibitors: GSK343, targeting EZH2, and SGC0946, targeting DOT1L, demonstrated the strongest synergy across 8 NB cell lines, with low normal fibroblast toxicity. High mRNA expression of both EZH2 and DOT1L in NB tumour samples correlated with the poorest patient survival. Combination HMT inhibitor treatment caused activation of ATF4-mediated endoplasmic reticulum (ER) stress responses. In addition, glutathione and several amino acids were depleted by HMT inhibitor combination on mass spectrometry analysis. The combination of SGC0946 and GSK343 reduced tumour growth in comparison to single agents.

Conclusion: Our results support further investigation of HMT inhibitor combinations as a therapeutic approach in NB.

Keywords: biomarkers; cancer biology; chromatin modifications and dynamics; epigenetics; molecular biology; neuroblastoma.


Conflict of interest statement

The authors do not have a conflict of interest to declare.

Figures

FIGURE 1
FIGURE 1
Drug combination screening identifies highly synergistic drug combinations against the SK‐N‐BE(2)‐C neuroblastoma cell line. (A) Schematic of the drug combination screen and downstream data analysis. The treatment control (DMSO) normalised cell viability data are subject to BLISS and HSA models to calculate synergism indices (SI). First the fractional effect (FE) is calculated from normalised cell viability values. Then FE values are subject to BLISS; wherein SI is calculated by subtracting the sum of FE and multiple of FE of individual drugs (FEdrug1/drug2) from the FE of the drug combination (FEcombo) per dose combination. SI values for HSA are calculated by subtracting the FE of the single drug with the highest activity (FEHSA) from FEcombo. For all SI values, SI >0 is synergistic, SI = 0 is additive whilst SI <0 is antagonistic for that specific dose pair. Finally, the total synergy for the drug pair is calculated by taking the sum of the 5 × 5 synergism matrix, and the max synergy for the drug pair is the highest value from the synergism matrix. (B) BLISS and (C) HSA synergism summary metrics are plotted in a scatterplot to illustrate synergism of drug pairs. The x‐axis represents the maximum synergy and y‐axis represents total synergism within the synergism matrix of each drug pair. These values were transformed into the log‐space using log10(×+2). Synergism thresholds are indicated by dotted lines (SI = 0), values above these lines are synergistic. Drug pairs which were highly synergistic across both models are highlighted in red.
FIGURE 2
FIGURE 2
SGC0946 combined with GSK343 has high selectivity against neuroblastoma cells. (A) Resazurin cell viability assays were performed on a panel of 8 neuroblastoma (NB) cell lines (SK‐N‐BE(2)‐C, CHP134, KELLY, SH‐SY5Y, LAN‐1, SK‐N‐AS, SH‐EP and SK‐N‐FI) 72 h posttreatment using an expanded dose range (9‐point) for SGC0946, GSK343 or the combination of these drugs in a 1:1 ratio. (B) The same cell viability assays were performed in human fibroblast cell lines (MRC‐5, WI‐38). Error bars represent the standard error of the mean for at least three independent experiments. For each plot a ‘Bliss Line’ is provided, which represents the expected result if both compounds were additive in nature, and values below the line in the shaded region indicate synergistic dose combinations. Furthermore, p‐values are reported for significant differences between the combination and both single‐agents using two‐way anova analyses (*p < 0.05, **p < 0.01, ***p < 0.001, ****p < 0.0001). (C) IC50's for the combination of drugs are presented in a column graph for the eight neuroblastoma and two fibroblast cell lines. (D) IC50's is grouped into neuroblastoma (NB) cell lines or fibroblast categories. Reported p‐value is from a two‐sided unpaired t‐test between the two groups. Error bars represent the standard error of the mean IC50's for each group. (E) Apoptotic and necrotic effects of the single agents and combination treatment were determined following pre‐treatment of SK‐N‐BE(2)‐C cells for 24 h before collecting the cells and staining with Annexin V/7‐AAD. Staining was detected by FACS analysis. A summary of results is shown as the percentage of cells in early or late apoptosis, and necrosis as histograms. Significance was determined from three independent experiments. (F) Tumour growth curves of Balb/c nude mice, xenografted with SK‐N‐BE(2)‐C cells, following treatment with either a vehicle control, 30 mg/kg/day SGC0946, 30 mg/kg/day GSK343 or the combination of these treatments. The treatment schedule (Rx) is indicated on the top of the plot, wherein drugs were administered on a 5 day on and 2 days off schedule with intraperitoneal injections. Averaged tumour growth curves are shown for time points where all mice in each treatment arm were alive. The reported p‐value is from the comparison between combination and single agent/control treatments derived from a one‐way anova with mixed‐effects analysis, corrected with Tukey's multiple comparison test. Error bars represent the standard error of the mean and are one‐sided for visualisation.
FIGURE 3
FIGURE 3
High expression of both EZH2 and DOT1L predicts poor neuroblastoma patient outcome. Kaplan–Meier curves of overall survival (OS) of neuroblastoma patient cohorts subdivided by the median expression of either EZH2 or DOT1L. Cohorts are annotated at the top of each plot (Kocak, SEQC), as well as the microarray probe ID used for the given gene. The reported p‐value is from a log‐rank test comparing the two curves. Cohorts were further subdivided using both median EZH2 and DOT1L expression to create four sub‐groups (EZH2 high + DOT1L high, EZH2 high + DOT1L low, EZH2 low + DOT1L high, EZH2 low + DOT1L low). These sub‐groups were classified in either (A) Kocak or (B) SEQC NB neuroblastoma patient cohorts and plotted as Kaplan–Meier curves with respect to EFS or OS survival times. The reported BH adjusted p‐value represents the log‐rank comparison between the EZH2+DOT1L high subgroup and the EZH2+DOT1L low subgroup after correcting for multiple comparisons with other groups. Pearson correlations between EZH2 and DOT1L gene expression were made in (C) Kocak and (D) SEQC cohorts. Pearson correlation coefficients (r) are provided at the top of each plot, along with associated p‐values and sample sizes (n). Dots are coloured by MYCN amplification status, either being amplified (MA, red), non‐amplified (MNA, black) or unknown (Unk, grey).
FIGURE 4
FIGURE 4
Combination therapy induces an ER stress response expression profile in NB cells. (A) Western blot analyses of cell lysates from treated cells for DOT1L, EZH2, H3K27me3, H3K79me2, Vinculin and GAPDH proteins. Cells were treated with a DMSO vehicle control or 12.8 μM of drug for 6 or 24 h followed by protein extraction. The size at which bands were detected (kDa) are shown to the left of the plot and respective treatment conditions/time points are shown below the plot. Specific antibodies were probed on different blots, where superscripts 1 and 2 annotated on the right of the plot indicates matching blots. (B, C) Venn diagrams depict the number of common differentially expressed genes (B) upregulated or (C) down‐regulated by the combination treatment in both SK‐N‐BE(2)‐C and KELLY cells. (D) Scaled gene expression heatmap of 31 common differentially expressed genes between SK‐N‐BE(2)‐C (B) and KELLY (K) cells after combination treatment. Columns represent individual replicates of the conditions (DMS = DMSO Control, SGC=SGC0946, GSK = GSK343, COM = Combination) and rows represent commonly regulated genes, both of which were hierarchically clustered. Gene expression scale (z‐score) is provided to the right of the heatmap. (E) qRT‐PCR assessing the mRNA expression levels of the top six ER stress target genes CHAC1, DDIT4, OPRL1, SESN2, SLC7A5 and SLC7A11 in SK‐N‐BE(2)‐C and KELLY cells from the microarray. The cells were treated with DMSO control, GSK343 (12.8 μM), SGC0946 (12.8 μM) and with combination of GSK343 and SGC0946 (1:1) for 6 h. For relative quantification of mRNA expression, expression levels of cells treated with DMSO were set to 1. Bars depict mean values ± standard error of the mean (SEM) of three different experiments. PCR reactions were performed in triplicates.
FIGURE 5
FIGURE 5
Gene set analyses in combination treated SK‐N‐BE(2)‐C and KELLY cells reveals an ATF4‐driven ER stress response. (A) Over‐representation analyses (ORA) using differentially expressed genes in combination treated KELLY or SK‐N‐BE(2)‐C cells versus control were performed using the ReactomePA database. The ‘COMMON’ differentially expressed genes previously identified were also used as input for each analysis. The results are represented as enrichment dot plots, wherein the size of the dot represents the gene ratio (number of genes in gene set/total number of genes in gene set) and the colour of the dot represents the Benjamini‐Hochberg adjusted p‐value after a Fisher's exact test for each pathway. The number of differentially expressed genes in the presented gene sets are also indicated below each plot. Only significantly over‐represented gene sets are shown (adjusted p < 0.05). Red arrows indicate either ATF4, ER stress or amino acid related gene sets. (B) Glutathione (GSH) and several amino acids are depleted by the combination of SGC0946 and GSK343. SK‐N‐BE(2)‐C cells were treated for 6 h followed by metabolomic profiling using hydrophilic interaction chromatography mass spectrometry (HILIC‐MS). Heatmap of HILIC‐MS detected metabolites, where rows represent metabolites (n = 37) and the columns represent samples. A scale bar is provided at the top left of the plot, indicating scaled metabolite abundance. HILIC separates positively (+) and negatively (−) charged metabolites. Some metabolites have both positively and negatively charged groups and therefore appear in both fractions. (C) Select HILIC‐MS metabolite candidates which were significantly changed in the combination treated cells compared with DMSO. Relative metabolite abundances (to the DMSO control) are provided for reduced GSH and the amino acids; glutamate, aspartate and taurine. Error bars represent the standard error of the mean.

Similar articles

References

    1. Keshelava N, Seeger RC, Groshen S, Reynolds CP. Drug resistance patterns of human neuroblastoma cell lines derived from patients at different phases of therapy. Cancer Res. 1998;58:5396‐5405. - PubMed
    1. Webster RM. Combination therapies in oncology. Nat Rev Drug Discov. 2016;15:81‐82. - PubMed
    1. Puissant A, Frumm SM, Alexe G, et al. Targeting MYCN in neuroblastoma by BET bromodomain inhibition. Cancer Discov. 2013;3:308‐323. - PMC - PubMed
    1. Chipumuro E, Marco E, Christensen CL, et al. CDK7 inhibition suppresses super‐enhancer‐linked oncogenic transcription in MYCN‐driven cancer. Cell. 2014;159:1126‐1139. - PMC - PubMed
    1. Boeva V, Louis‐Brennetot C, Peltier A, et al. Heterogeneity of neuroblastoma cell identity defined by transcriptional circuitries. Nat Genet. 2017;49:1408‐1413. - PubMed

MeSH terms