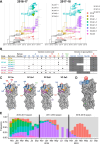
Measures of Population Immunity Can Predict the Dominant Clade of Influenza A (H3N2) in the 2017-2018 Season and Reveal Age-Associated Differences in Susceptibility and Antibody-Binding Specificity
- PMID: 39501522
- PMCID: PMC11538025
- DOI: 10.1111/irv.70033
Measures of Population Immunity Can Predict the Dominant Clade of Influenza A (H3N2) in the 2017-2018 Season and Reveal Age-Associated Differences in Susceptibility and Antibody-Binding Specificity
Abstract
Background: For antigenically variable pathogens such as influenza, strain fitness is partly determined by the relative availability of hosts susceptible to infection with that strain compared with others. Antibodies to the hemagglutinin (HA) and neuraminidase (NA) confer substantial protection against influenza infection. We asked if a cross-sectional antibody-derived estimate of population susceptibility to different clades of influenza A (H3N2) could predict the success of clades in the following season.
Methods: We collected sera from 483 healthy individuals aged 1 to 90 years in the summer of 2017 and analyzed neutralizing responses to the HA and NA of representative strains using focus reduction neutralization tests (FNRT) and enzyme-linked lectin assays (ELLA). We estimated relative population-average and age-specific susceptibilities to circulating viral clades and compared those estimates to changes in clade frequencies in the following 2017-2018 season.
Results: The clade to which neutralizing antibody titers were lowest, indicating greater population susceptibility, dominated the next season. Titer correlations between viral strains varied by age, suggesting age-associated differences in epitope targeting driven by shared past exposures. Yet substantial unexplained variation remains within age groups.
Conclusions: This study indicates how representative measures of population immunity might improve evolutionary forecasts and inform selective pressures on influenza.
© 2024 The Author(s). Influenza and Other Respiratory Viruses published by John Wiley & Sons Ltd.
Conflict of interest statement
S.E.H. is a co‐inventor on patents that describe the use of nucleoside‐modified mRNA as a vaccine platform. S.E.H reports receiving consulting fees from Sanofi, Pfizer, Lumen, Novavax, and Merck. The other authors declare no conflicts of interest.
Figures


Update of
-
Measures of population immunity can predict the dominant clade of influenza A (H3N2) in the 2017-2018 season and reveal age-associated differences in susceptibility and antibody-binding specificity.medRxiv [Preprint]. 2024 Oct 10:2023.10.26.23297569. doi: 10.1101/2023.10.26.23297569. medRxiv. 2024. Update in: Influenza Other Respir Viruses. 2024 Nov;18(11):e70033. doi: 10.1111/irv.70033. PMID: 37961288 Free PMC article. Updated. Preprint.
Similar articles
-
Measures of population immunity can predict the dominant clade of influenza A (H3N2) in the 2017-2018 season and reveal age-associated differences in susceptibility and antibody-binding specificity.medRxiv [Preprint]. 2024 Oct 10:2023.10.26.23297569. doi: 10.1101/2023.10.26.23297569. medRxiv. 2024. Update in: Influenza Other Respir Viruses. 2024 Nov;18(11):e70033. doi: 10.1111/irv.70033. PMID: 37961288 Free PMC article. Updated. Preprint.
-
Antigenic drift and subtype interference shape A(H3N2) epidemic dynamics in the United States.Elife. 2024 Sep 25;13:RP91849. doi: 10.7554/eLife.91849. Elife. 2024. PMID: 39319780 Free PMC article.
-
Serum strain-specific or cross-reactive neuraminidase inhibiting antibodies against pandemic А/California/07/2009(H1N1) influenza in healthy volunteers.BMC Res Notes. 2015 Apr 10;8:136. doi: 10.1186/s13104-015-1086-z. BMC Res Notes. 2015. PMID: 25889924 Free PMC article.
-
Differential Antibody Recognition of H3N2 Vaccine and Seasonal Influenza Virus Strains Based on Age, Vaccine Status, and Sex in the 2017-2018 Season.J Infect Dis. 2020 Sep 14;222(8):1371-1382. doi: 10.1093/infdis/jiaa289. J Infect Dis. 2020. PMID: 32496543 Free PMC article.
-
H3N2 influenza viruses in humans: Viral mechanisms, evolution, and evaluation.Hum Vaccin Immunother. 2018;14(8):1840-1847. doi: 10.1080/21645515.2018.1462639. Epub 2018 May 14. Hum Vaccin Immunother. 2018. PMID: 29641358 Free PMC article. Review.
Cited by
-
SARS-CoV-2 neutralizing antibody specificities differ dramatically between recently infected infants and immune-imprinted individuals.bioRxiv [Preprint]. 2025 Jan 20:2025.01.17.633612. doi: 10.1101/2025.01.17.633612. bioRxiv. 2025. Update in: J Virol. 2025 Apr 15;99(4):e0010925. doi: 10.1128/jvi.00109-25. PMID: 39896663 Free PMC article. Updated. Preprint.
-
High-throughput neutralization measurements correlate strongly with evolutionary success of human influenza strains.bioRxiv [Preprint]. 2025 Mar 12:2025.03.04.641544. doi: 10.1101/2025.03.04.641544. bioRxiv. 2025. PMID: 40161702 Free PMC article. Preprint.
-
Concepts and methods for predicting viral evolution.ArXiv [Preprint]. 2024 Nov 27:arXiv:2403.12684v3. ArXiv. 2024. Update in: Methods Mol Biol. 2025;2890:253-290. doi: 10.1007/978-1-0716-4326-6_14. PMID: 38745695 Free PMC article. Updated. Preprint.
-
A speed limit on serial strain replacement from original antigenic sin.bioRxiv [Preprint]. 2024 Apr 20:2024.01.04.574172. doi: 10.1101/2024.01.04.574172. bioRxiv. 2024. Update in: Proc Natl Acad Sci U S A. 2024 Jun 18;121(25):e2400202121. doi: 10.1073/pnas.2400202121. PMID: 38260288 Free PMC article. Updated. Preprint.
-
Concepts and methods for predicting viral evolution.bioRxiv [Preprint]. 2024 Nov 30:2024.03.19.585703. doi: 10.1101/2024.03.19.585703. bioRxiv. 2024. Update in: Methods Mol Biol. 2025;2890:253-290. doi: 10.1007/978-1-0716-4326-6_14. PMID: 38746108 Free PMC article. Updated. Preprint.
References
-
- Mc Cauley J., Daniels R., Lin Y., et al., “Report Prepared for the WHO Annual Consultation on the Composition of Influenza Vaccine for the Northern Hemisphere 2017‐2018,” The Crick Worldwide Influenza Centre (WIC), WHO CC for Reference & Research on Influenza, (2017).
-
- Wentworth D. E., “Vaccines and Related Biological Products Advisory Committee October 6,” in 2022 Meeting Presentation—Global Influenza Virus Surveillance and Characterization, (2022), Available from: https://www.fda.gov/media/162115/download.
Publication types
MeSH terms
Substances
Grants and funding
LinkOut - more resources
Full Text Sources
Medical
Miscellaneous

