. 2024 Nov 6;138(19):2481-2490.
doi: 10.1097/CM9.0000000000003306. Online ahead of print.

Predictive value of pre-treatment circulating tumor DNA genomic landscape in patients with relapsed/refractory multiple myeloma undergoing anti-BCMA CAR-T therapy: Insights from tumor cells and T cells

Affiliations

Predictive value of pre-treatment circulating tumor DNA genomic landscape in patients with relapsed/refractory multiple myeloma undergoing anti-BCMA CAR-T therapy: Insights from tumor cells and T cells

Rongrong Chen et al. Chin Med J (Engl). .

Abstract

Background: B-cell maturation antigen (BCMA)-directed chimeric antigen receptor T (CAR-T) therapy yield remarkable responses in patients with relapsed/refractory multiple myeloma (R/RMM). Circulating tumor DNA (ctDNA) reportedly exhibits distinct advantages in addressing the challenges posed by tumor heterogeneity in the distribution and genetic variations in R/RMM.

Methods: Herein, the ctDNA of 108 peripheral blood plasma samples from patients with R/RMM was thoroughly investigated before administration of anti-BCMA CAR-T therapy to establish its predictive potential. Flow cytometry is used primarily to detect subgroups of T cells or CAR-T cells.

Results: In this study, several tumor and T cell effector-mediated factors were considered to be related to treatment failure by an integrat analysis, including higher percentages of multiple myeloma (MM) cells in the bone marrow (P = 0.013), lower percentages of CAR-T cells in the peripheral blood at peak (P = 0.037), and higher percentages of CD8+ T cells (P = 0.034). Furthermore, there is a substantial correlation between high ctDNA level (>143 ng/mL) and shorter progression-free survival (PFS) (P = 0.007). Multivariate Cox regression analysis showed that high levels of ctDNA (>143 ng/mL), MM-driven high-risk mutations (including IGLL5 [P = 0.004], IRF4 [P = 0.024], and CREBBP [P = 0.041]), number of multisite mutations, and resistance-related mutation (ERBB4, P = 0.040) were independent risk factors for PFS.

Conclusion: Finally, a ctDNA-based risk model was built based on the above independent risk factors, which serves as an adjunct non-invasive measure of substantial tumor burden and a prognostic genetic feature that can assist in predicting the response to anti-BCMA CAR-T therapy.

Registeration: Chinese Clinical Trial Registry (ChiCTR2100046474) and National Clinical Trial (NCT04670055, NCT05430945).


Conflict of interest statement

None.

Figures

Figure 1
Figure 1
Flow chart of study design. Plasma samples were obtained before lymphodepletion from 108 patients with R/RMM (ChiCTR2100046474, NCT04670055, and NCT05430945). pt: Patient; R/RMM: Relapsed/refractory multiple myeloma.
Figure 2
Figure 2
Pre-treatment genomic alterations of all 108 R/RMM patients. Mutations are classified according to the type of genetic change in different colors. The figure depicts the genes that affected at least four patients with mutations. Red indicates multiple-site mutations. The plot is modified from an open-source template (https://github.com/ptgrogan/excel-oncoplot). R/RMM: Relapsed/refractory multiple myeloma.
Figure 3
Figure 3
Clinical correlation of ctDNA concentrations with other evaluation indicators. (A,B) Kaplan–Meier survival curve for OS (A) and PFS (B) in patients with R/RMM in the ctDNA-hi and ctDNA-lo groups at screening; (C) Higher percentages of morphological abnormal plasma cells along with higher percentages of abnormal plasma cells by FCM in the ctDNA-hi group in bone marrow. No significant abnormalities were observed between the two groups in the percentages of M protein or iFLC/niFLC. (D) Lower percentages of CAR-T cells at peak and higher percentages of CD8+ T cells were observed in the ctDNA-hi groups. (E) Number of mutations detected and ctDNA concentration had no significant linear correlation. CAR-T: Chimeric antigen receptor T; ctDNA: Circulating tumor DNA; iFLC/niFLC: Involved free light chain/non-involved free light chain; OS: Overall survival; PFS: Progression-free survival; R/RMM: Relapsed/refractory multiple myeloma.
Figure 4
Figure 4
Genes related to the outcomes of 108 R/RMM patients receiving anti-BCMA CAR-T cell therapy. (A) (Left) Mutated genes in patients receiving anti-BCMA CAR-T cell therapy, stratified by alive vs. death status among pooled patients. (Right) Effect of mutations in a given gene on OS (HR from proportional hazard model); (B) (Left) Mutated genes in patients receiving anti-BCMA CAR-T cell therapy, stratified by ongoing response vs. progression among pooled patients. (Right) Effect of mutations in a given gene on PFS (HR from proportional hazard model). BCMA: B-cell maturation antigen; CAR-T: Chimeric antigen receptor T; HR: Hazard ratio; OS: Overall survival; PFS: Progression-free survival.
Figure 5
Figure 5
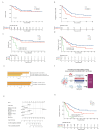
Kaplan–Meier curves for OS and PFS according to risk factors and the nomogram model. (A,B) Kaplan–Meier survival curves for OS and PFS in patients with R/RMM with number of mutations being >4 and ≤4 groups at screening; (C,D) Kaplan–Meier survival curves for OS and PFS in patients with R/RMM with multiple site mutations = 0, 1, and 2 groups at screening. (E) Corresponding pathways for all genes associated with CAR-T cell expansion (FBXW7, MET, PTPRT, CDKN2A, and STED2). (F) Illustration summarizing the strategy through which ctDNA is profiled from plasma samples. (G) Nomogram model to predict PFS, including high ctDNA concentrations, MM-derived high-risk mutations, number of multisite mutations, and resistance-related mutation (ERBB4). (H) Kaplan–Meier curves for PFS among three groups: low risk (score 0–51), intermediate risk (score 51–150), and high risk (score >150) in terms of the total points according to the nomogram models. BCMA: B-cell maturation antigen; CAR-T: Chimeric antigen receptor T; ctDNA: Circulating tumor DNA; OS: Overall survival; PFS: Progression-free survival; R/RMM: Relapsed/refractory multiple myeloma.

References

    1. Kumar SK Rajkumar V Kyle RA van Duin M Sonneveld P Mateos MV, et al. Multiple myeloma. Nat Rev Dis Primers 2017;3:17046. doi: 10.1038/nrdp.2017.46. - PubMed
    1. Yan W Fan H Xu J Liu J Li L Du C, et al. Prognostic value of the Second Revision of the International Staging System (R2-ISS) in a real-world cohort of patients with newly-diagnosed multiple myeloma. Chin Med J 2023;136:1744–1746. doi: 10.1097/cm9.0000000000002735. - PMC - PubMed
    1. Stroun M Maurice P Vasioukhin V Lyautey J Lederrey C Lefort F, et al. The origin and mechanism of circulating DNA. Ann N Y Acad Sci 2000;906:161–168. doi: 10.1111/j.1749-6632.2000.tb06608.x. - PubMed
    1. Liu Y Guo J Yi Y Gao X Wen L Duan W, et al. Circulating tumor DNA: Less invasive, more representative method to unveil the genomic landscape of newly diagnosed multiple myeloma than bone marrow aspirates. Cancers (Basel) 2022;14:4914. doi: 10.3390/cancers14194914. - PMC - PubMed
    1. Mithraprabhu S Morley R Khong T Kalff A Bergin K Hocking J, et al. Monitoring tumour burden and therapeutic response through analysis of circulating tumour DNA and extracellular RNA in multiple myeloma patients. Leukemia 2019;33:2022–2033. doi: 10.1038/s41375-019-0469-x. - PubMed

Associated data