. 2025 Feb;73(2):399-421.
doi: 10.1002/glia.24641. Epub 2024 Nov 6.

Oligodendrocyte Slc48a1 (Hrg1) encodes a functional heme transporter required for myelin integrity

Affiliations

Oligodendrocyte Slc48a1 (Hrg1) encodes a functional heme transporter required for myelin integrity

John H Stockley et al. Glia. 2025 Feb.

Abstract

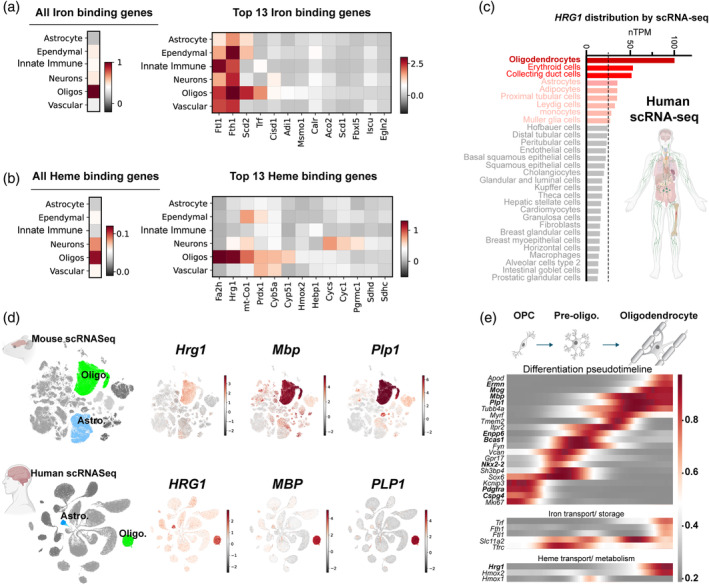
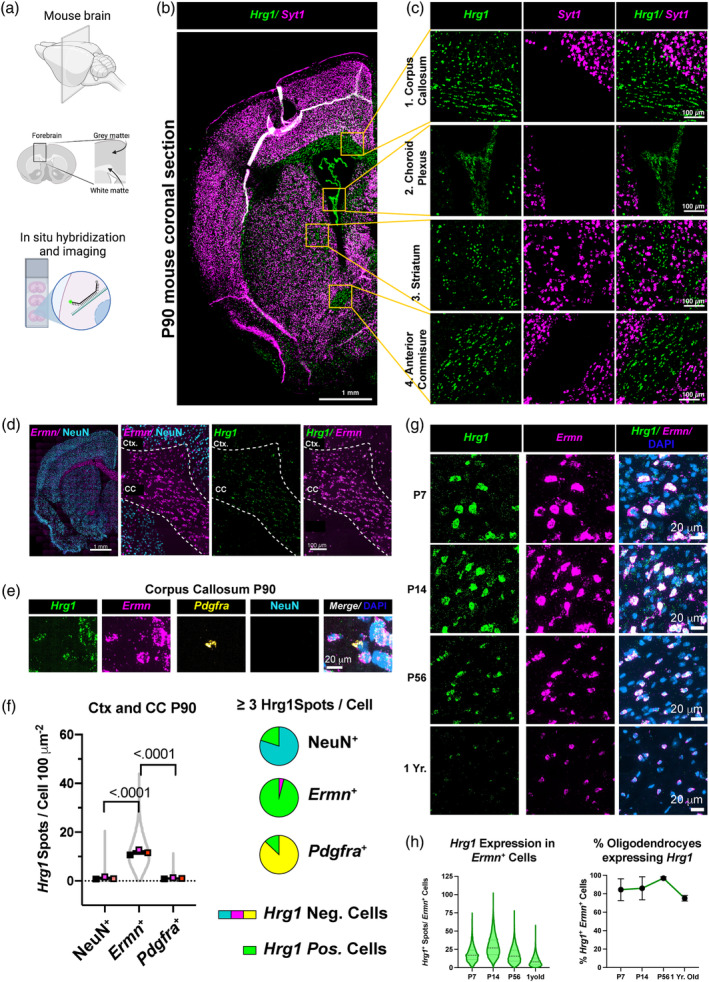
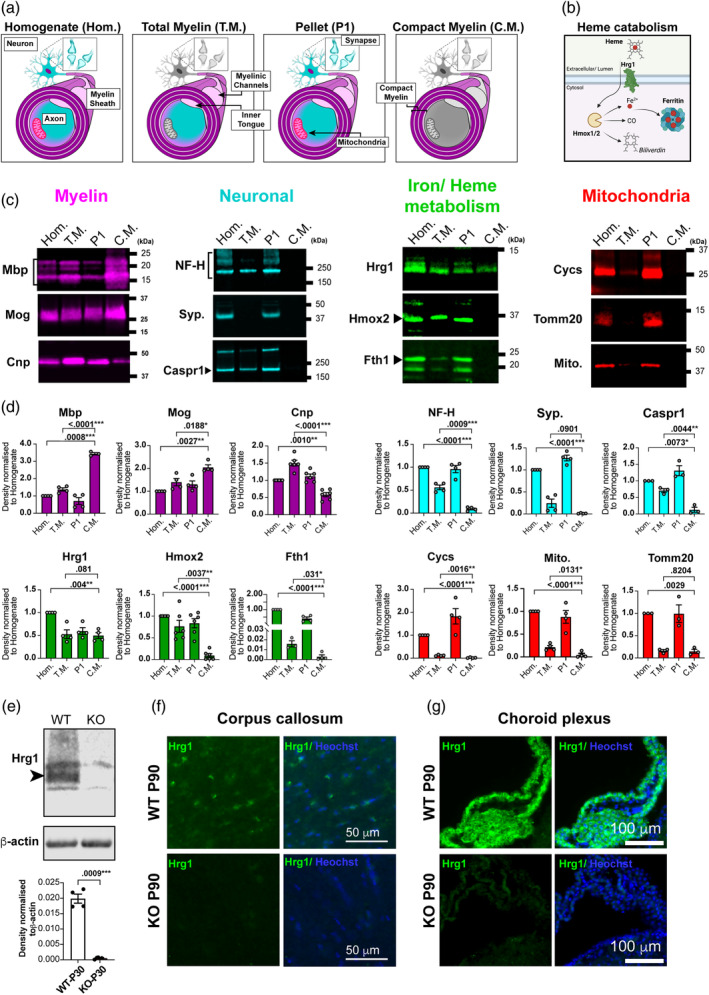
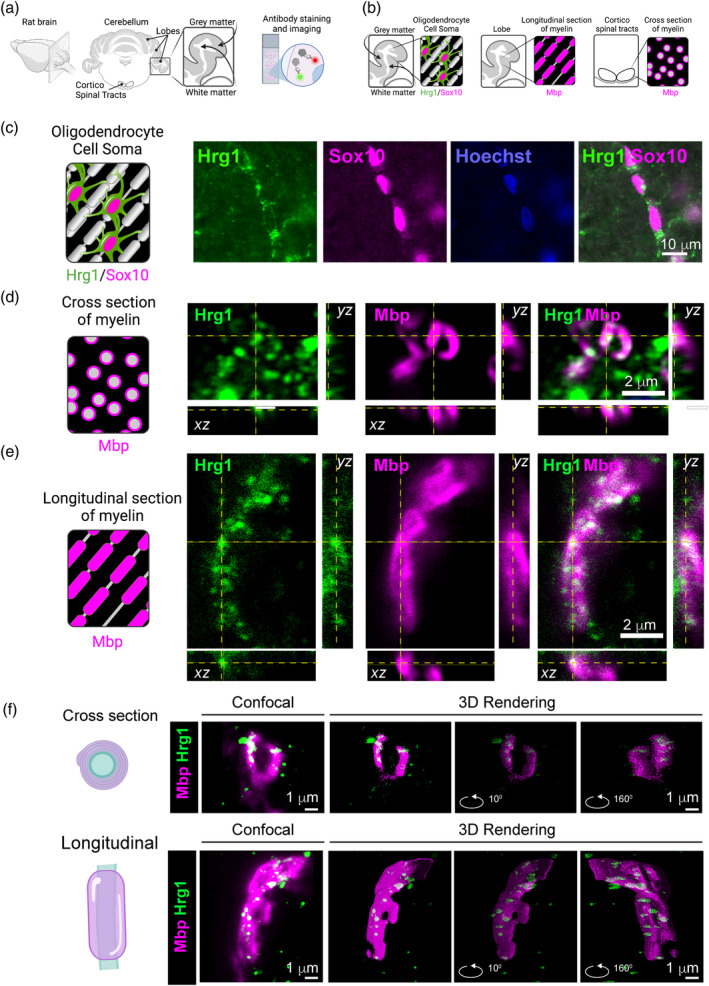
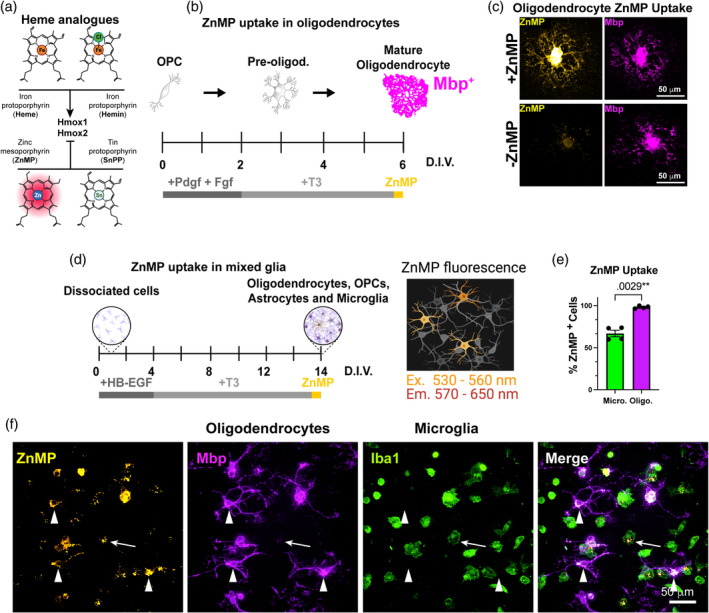
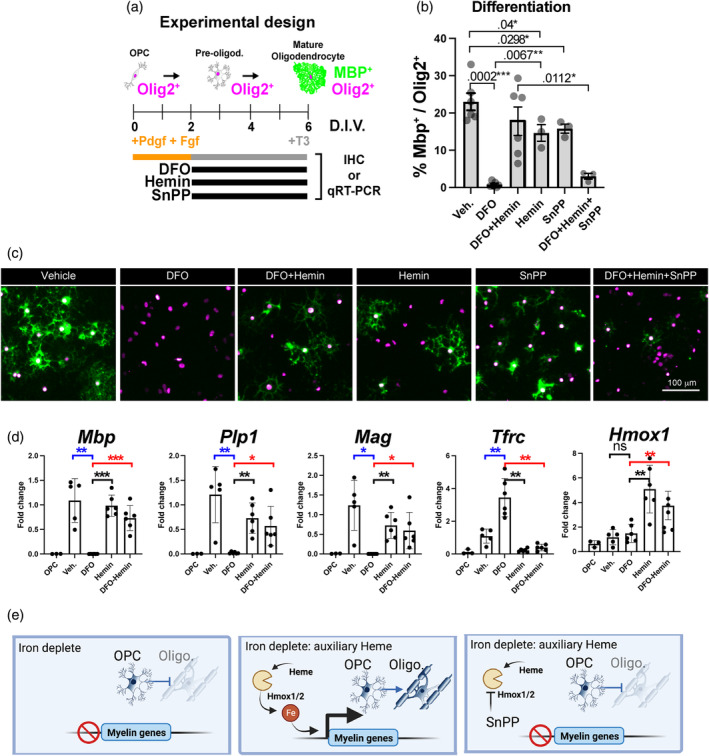
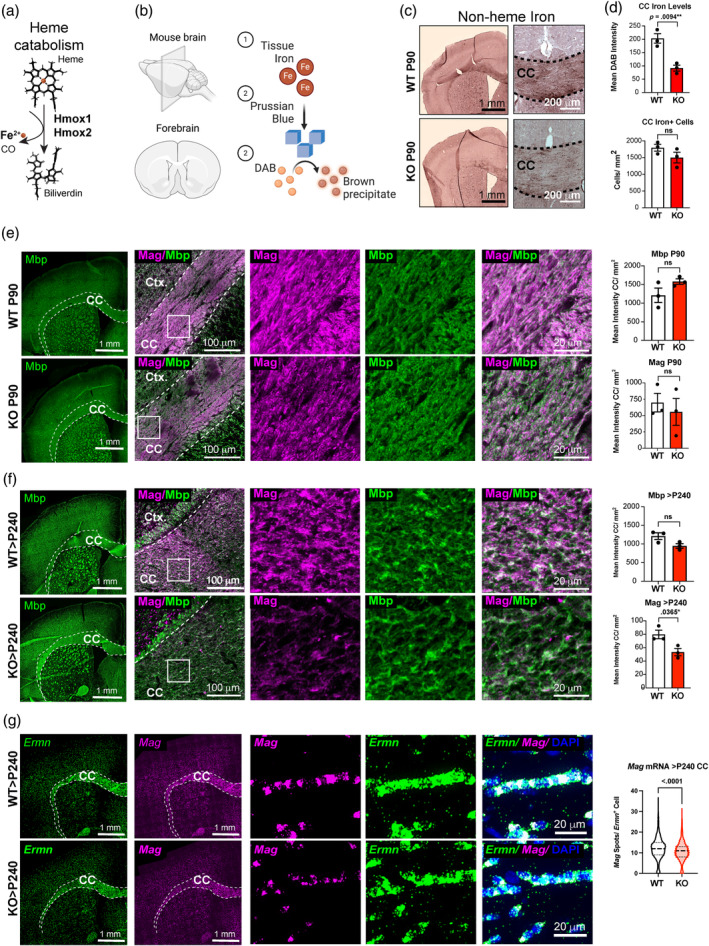
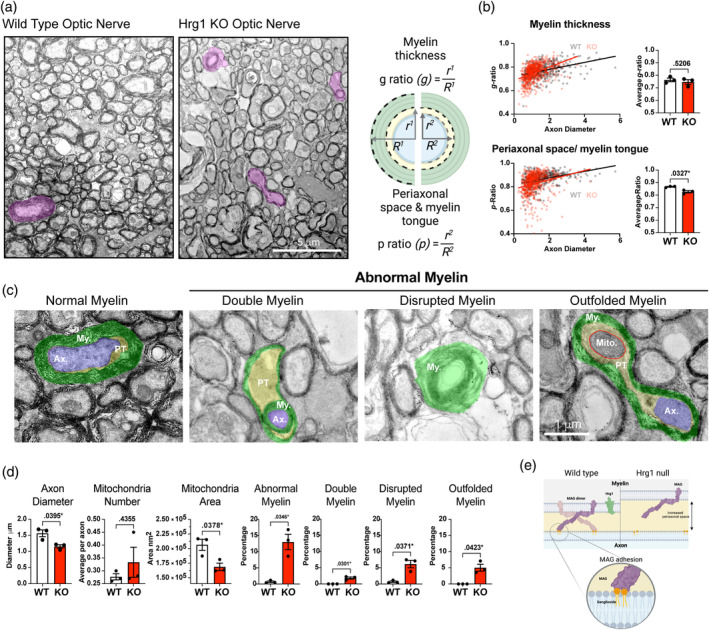
Oligodendrocytes (OLs) of the central nervous system require iron for proteolipid biosynthesis during the myelination process. Although most heme is found complexed to hemoglobin in red blood cells, surprisingly, we found that Slc48a1, encoding the heme transporter Hrg1, is expressed at higher levels in OLs than any other cell type in rodent and humans. We confirmed in situ that Hrg1 is expressed in OLs but not their precursors (OPCs) and found that Hrg1 proteins in CNS white matter co-localized within myelin sheaths. In older Hrg1 null mutant mice we observed reduced expression of myelin associated glycoprotein (Mag) and ultrastructural myelin defects reminiscent of Mag-null animals, suggesting myelin adhesion deficiency. Further, we confirmed reduced myelin iron levels in Hrg1 null animals in vivo, and show that OLs in vitro can directly import both the fluorescent heme analogue ZnMP and heme itself, which rescued iron deficiency induced inhibition of OL differentiation in a heme-oxidase-dependent manner. Together these findings indicate OL Hrg1 encodes a functional heme transporter required for myelin integrity.

Keywords: Hrg1; axon; heme; heme oxygenase; iron deficiency; myelin; myelin associated glycoprotein (Mag); myelin basic protein (Mbp); neurodegeneration; oligodendrocyte.


Conflict of interest statement

Iqbal Hamza is the President and Founder of Rakta Therapeutics Inc. (Maryland), a company involved in the development of heme transporter‐related diagnostics. He declares no other competing financial interests. The remaining authors declare no competing interests.

Figures

FIGURE 1
FIGURE 1
Hrg1 (Slc48a1) expression is enriched in mature myelinating oligodendrocytes. (a and b) Heat map displaying the expression of all iron and heme binding genes (columns) across six central nervous system (CNS) cell types (rows), identified through gene ontology terms GO:0005506 (iron ion binding) and GO:0020037 (heme binding genes). The top 13 highest expressed transcripts are highlighted. Expression levels were normalized and shown in log scale. See also Figure S1. (c) Single‐cell RNAseq expression profile of human HRG1 across human cells obtained from the Human Protein Atlas (www.proteinatlas.org/ENSG00000211584‐SLC48A1/single+cell+type). (d) Uniform Manifold Approximation and Projection (UMAP) depicting the single RNA sequencing from mouse and human CNS cell types for Hrg1/HRG1 (mouse/human orthologues) alongside mature oligodendrocyte markers Mbp/MBP and Plp1/PLP1. (e) Pseudo‐timeline illustrating the expression dynamics of selected transcripts from SPLiT‐Seq (Rosenberg et al., 2018) data of oligodendroglial lineage cells from P2 and P11 CNS, highlighting the differentiation of oligodendrocyte precursor cells (OPC) into mature oligodendrocytes (OLs). Heme and iron metabolic transcripts are included for comparison.
FIGURE 2
FIGURE 2
Hrg1 is expressed in mature oligodendrocytes in vivo. (a) Schematic depicting the region from the adult (P90) mouse central nervous system (CNS) that was selected for single‐molecule fluorescence in situ hybridization (smFISH). (b) Representative stitched confocal image of an adult (P90) mouse coronal brain section, stained for neuronal Syt1 and Hrg1 transcripts, with four regions being selected for neuronal Syt1 and Hrg1 transcripts. Scale bar of 1 millimeter is shown. (c) Magnified views of selected regions from (b) showcasing white matter tracts, that is, corpus callosum (1.) and anterior commissure (4.), as well as cerebrospinal fluid‐generating cells of the choroid plexus (2.), and striatum (3.). Scale bars of 100 μ are shown. (d) Representative stitched confocal image of an adult (P90) mouse coronal brain section displaying NeuN neuronal protein and Ermn mature oligodendrocyte marker mRNA for gray (cerebral cortex, Ctx.) and white matter corpus callosum (CC) regions, respectively. Scale bars of 1 millimeter,100 μ are shown. (e) High magnification image of the CC illustrating Hrg1, Ermn, Pdgfra mRNA, NeuN protein, and DNA stained with DAPI. Scale bar of 20 μ is shown. (f) Violin plot and pie charts of Hrg1 mRNA expression detected by smFISH in CC and cortical regions (Ctx.) of adult mouse (P90) in neurons (NeuN+), oligodendrocytes (Ermn +), and oligodendrocyte precursor cells (OPCs) (Pdgra +). (g) Representative high magnification images of Hrg1 mRNA expression in oligodendrocytes (Ermn +) during mouse CNS development at post‐natal day 7 (P7), P14, P56, and 1 year old in the pons. Pons was selected as oligodendrocytes are present in the same field of view at all developmental time points. No Ermn positive oligodendrocytes were detected in Ctx. and CC at P7. Refer to Figure S1c. Scale bars of 20 μ are shown. (h) Expression analysis of Hrg1 mRNA in oligodendrocytes (Ermn +) by smFISH across pons, cerebellum white matter, CC, and Ctx. at indicated time points. Left panel represent Hrg1 mRNA spot quantification in (Ermn +) cells with ≥7 Ermn spots and right panel represents the percentage of Ermn + cells with ≥7 Hrg1 mRNA spots. Violin plots are represented as all data points and scatter plots the average of three biological replicates ± standard error of the mean. All unpaired t‐tests performed with Welch's correction, values deemed significant as p < .05(*), <.005(**), and <.0005(***), and ns as non‐significant. Pie charts depict cells with a threshold of ≥3 Hrg1 spots per cell. Fluorescent images are pseudo‐colored for aid of the reader.
FIGURE 3
FIGURE 3
Hrg1 proteins are localized in central nervous system (CNS) myelin. (a) Schematic illustrating CNS compartments generated during the fractionation of brain homogenate (Hom.) into total myelin (T.M.), compact myelin (C.M.), and the first pellet (P1). (b) Proposed schematic of heme catabolism and iron storage relevant to this study. (c) Representative western blots of CNS fractions during myelin enrichment for myelin proteins, neuronal proteins, heme catabolism proteins as shown in (B), and mitochondrial proteins. Western blot fluorescent images are pseudo‐colored for aid of the reader. (d) Densitometry analysis of westerns in (c), normalized to their respective levels in Hom. fractions. Note the enrichment of Mbp in (C.M.), Caspr and Cnp in (T.M.), and depleted levels of neuronal proteins neurofilament‐heavy (NF‐H) and synaptophysin (Syp.), and mitochondrial proteins (Cycs, Tomm20, and mitochondrial antigen) in myelin fractions. Hrg1 is detected in all fractions, but Hmox2 and Fth1 are absent from (C.M.) Biological replicates are presented as single points on each histogram. All blots were repeated at least two times. (e) Validation of Hrg1 antibody for western blotting in mouse brain lysates from P30 wild type (WT) and Hrg1 mutants (KO), analyzed by densitometry with normalization to β‐actin levels. Western blot fluorescent images are depicted in gray scale and biological replicates are presented as single points on each histogram. All blots were repeated at least two times. (f and g) Validation of Hrg1 antibody for immunofluorescence staining in mouse brain sections from P90 WT and Hrg1 mutants in the CC (f) and choroid plexus (g). Scale bars of 50 and 100 μ are shown. Histograms error bars are ± standard error of the mean. and all unpaired t‐tests performed with Welch's correction, values deemed significant as p < .05(*), <.005(**), and <.0005(***), and ns as non‐significant. See also Figure S2a–c.
FIGURE 4
FIGURE 4
Hrg1 proteins co‐locate with Mbp within myelin sheath. (a and b) Graphical representations of mouse brain cerebellum immunofluorescence. Two main regions are analyzed for longitudinal myelin (Lobes) and cross sections of myelin in the cortico spinal tract. (c) Representative epifluorescent images of Hrg1 and Sox10 immunofluorescence in cerebellar Lobe white matter (see Figure S2f,g). Scale bar of 10 μ is shown. (d) Representative orthogonal confocal image slice of myelin sheaths at high magnification from the cortico spinal tract (cross‐sectional). Scale bar of 2 μ is shown. (e) Representative orthogonal confocal image slice of myelin sheaths at high magnification from the cerebellar lobe (longitudinal). Scale bar of 2 μ is shown. (f) Maximum intensity projection confocal image (left panels) used for 3D reconstruction using the Volume J 1.8 plugin in Fiji of myelin cross‐section (top panel) and longitudinal (bottom panel) (see Movies S1 and S2). Scale bar of 1 μ is shown.
FIGURE 5
FIGURE 5
Hrg1 is a functional heme importer in oligodendrocytes. (a) Schematic of heme and heme analogues hemin (oxidized heme), zinc mesoporphyrin (ZnMP), and tin protoporphyrin (SnPP). Heme and hemin are stimulants while ZnMP and SnPP are inhibitors of heme oxygenases (Hmox1/2). (b) Schematic of method for oligodendrocyte precursor cells (OPC) differentiation, treatment with ZnMP and detection of ZnMP autofluorescence. (c) Representative maximum projection of confocal image of single Mbp (magenta) positive oligodendrocyte from rat primary cultures with or without ZnMP treatment (hot orange). Scales bars of 50 μ are shown. Note the distribution of ZnMP throughout the cytoplasm and processes and its absence from untreated cells. (d) Schematic of method for mixed glial differentiation, treatment with ZnMP, and detection of ZnMP autofluorescence. (e) Unbiased quantification of cells with ZnMP fluorescence in primary mixed glial cultures from (f). Note the higher percentage of Mbp positive oligodendrocytes (magenta histogram) containing ZnMP versus professional phagocytic microglia (green histogram). (f) Representative maximum projection of confocal image of mouse primary mixed glial cultures treated with ZnMP. Note the distribution of ZnMP (hot orange) in Mbp positive oligodendrocytes (magenta/arrowheads) and Iba1 positive microglia (green/arrows). Scales bars of 50 μ are shown. See also Figure S3a.
FIGURE 6
FIGURE 6
Heme is an auxiliary source of iron for oligodendrocyte precursor cells (OPC) differentiation. (a) Schematic of method for primary OPC differentiation into mature oligodendrocytes. Differentiation is initiated by growth factor (PDGF and FGF) withdrawal and supplementation with thyroid hormone T3. Black bars represent drugs used in the treatments with deferoxamine (DFO) to chelate iron, oxidized heme (hemin) as a heme surrogate and SnPP as a specific heme oxygenase inhibitor. Treated cells were analyzed by immunofluorescence or qPCR. (b) Unbiased quantification of images from (c) analyzed for the percentage of Mbp+ cells and normalized to the number of Olig2+ cells. (c) Representative epifluorescent images from cells treated with drugs stained for pan oligodendroglial marker Olig2 (magenta) and mature oligodendrocytes with Mbp (green). Quantifications depicted in (b). Scales bar1 of 100 μ are shown. Note that iron depletion with DFO blocks OPC differentiation, which is rescued by hemin treatment but requires the activity of heme oxygenases blocked by SnPP. (d) quantitative real‐time PCR (qRT‐PCR) analysis of OPCs and oligodendrocytes treated with vehicle (Veh.), DFO, Hemin, and DFO with hemin. Genes significantly responsive to iron depletion are shown as blue p‐values and genes responsive to hemin during iron depletion are shown as red p‐values. Note that iron depletion halts oligodendrocyte gene transcription (Mbp, Plp1, and Mag), which is rescued by hemin treatment, and conversely iron depletion elevates Tfrc while hemin attenuates Tfrc expression. Hmox1 is also increased by hemin treatment. Biological replicates are presented as single points on each histogram and error bars are ± standard error of the mean All unpaired t‐tests performed with Welch's correction, values deemed significant as p < .05(*), <.005(**), and <.0005(***), and ns as non‐significant and fluorescent images are pseudo‐colored for aid of the reader. See also Figure S4.
FIGURE 7
FIGURE 7
Aging Hrg1 mutant mice show progressive reduction in Mag expression. (a) Structural schematic of heme degradation to iron, carbon monoxide (CO), and biliverdin by heme oxygenases. (b) Schematic of section Turnbull iron staining. Tissue iron in sections (1) is (2) oxidized to Prussian blue crystals by potassium ferricyanide and acts as a redox catalyst to polymerize diaminobenzidine (DAB) in the presence of H202. (c) Enhanced section Turnbull's staining for non‐heme iron in the central nervous system of Hrg1 deficient mice (KO) and wild type (WT) littermates at P90 (3 months old). Note the localization of brown DAB reaction indicative of iron in white matter tracts. Scales bars of 1 mm and 200 μ are shown. (d) Quantification of iron staining intensity in Hrg1 KO compared to controls is lower. At higher magnifications, this was quantified for the corpus callosum (CC) as mean DAB intensities and the number of cells with DAB staining. (e) Representative stitched confocal images from mouse coronal sections stained for Mag (Magenta) and Mbp (Green) in Hrg1 deficient mice (KO) and WT littermates at P90 (3 months old) and quantified for Mag levels in CC with scale bars of 1 mm and 100 μ. Higher magnifications of insets are shown to the right. Scale bar of 20 μ is shown. (f) Representative stitched confocal images from mouse coronal sections stained for Mag (Magenta) and Mbp (Green) in Hrg1 deficient mice (KO) and WT littermates at >P240 (>8 months old) and quantified for Mag levels in the CC with scale bars of 1 mm and 100 μ. Higher magnifications of insets are shown to the right. Scale bar of 20 μ is shown. (g) Representative stitched confocal images from mouse coronal sections stained for Mag (Magenta) and Ermn (Green) mRNA by smFISH in Hrg1 deficient mice (KO) and WT littermates at >P240 (>8 months old) and quantified for Mag spots per Ermn + cells in the CC with scale bars of 1 mm and 20 μ. Violin plots are represented as all data points and scatter plots the average of three biological replicates ± standard error of the mean. All unpaired t‐tests performed with Welch's correction, values deemed significant as p < .05(*), <.005(**), and <.0005(***), and ns as non‐significant. Pie charts depict cells with a threshold of ≥3 Hrg1 spots per cell. Fluorescent images are pseudo‐colored for aid of the reader.
FIGURE 8
FIGURE 8
Hrg1 function is required to maintain myelin ultrastructural integrity. (a) Electron photomicrographs of optic nerves from Hrg1 deficient mice (KO) and wild type (WT) littermates at P90, highlighting myelin types in pink. Scale bar of 5 μ is shown. (b) Schematic representation of g‐ratio and p‐ratio measurements, accompanied by scatter plots and averaged values. (c) Higher magnification of myelin types with pseudo‐coloring for myelin (green), axon (blue), periaxonal space and tongue (PT) (yellow), and mitochondria (Mito.) (circled in red). Scale bar of 1 μ is shown. (d) Morphometric analysis from ultrastructural examination reveals an increase in abnormal myelin, including double myelin, disrupted myelin, and outfolded myelin. Data presented as mean ± standard error of the mean. of three biological replicates. (e) Schematic outlining the proposed hypothesis for the loss of axonal adhesion due to reduced Mag levels in Hrg1 deficient myelin. Biological replicates are presented as single points on each histogram and error bars are ± standard error of the mean. All unpaired t‐tests performed with Welch's correction, values deemed significant as p < .05(*), <.005(**), and <.0005(***), and ns as non‐significant.

References

    1. Aboul‐Enein, F. , Rauschka, H. , Kornek, B. , Stadelmann, C. , Stefferl, A. , Brück, W. , Lucchinetti, C. , Schmidbauer, M. , Jellinger, K. , & Lassmann, H. (2003). Preferential loss of myelin‐associated glycoprotein reflects hypoxia‐like white matter damage in stroke and inflammatory brain diseases. Journal of Neuropathology and Experimental Neurology, 62, 25–33. - PubMed
    1. Absinta, M. , Sati, P. , Masuzzo, F. , Nair, G. , Sethi, V. , Kolb, H. , Ohayon, J. , Wu, T. , Cortese, I. C. M. , & Reich, D. S. (2019). Association of Chronic Active Multiple Sclerosis Lesions with Disability in Vivo. JAMA Neurology, 76, 1474–1483. - PMC - PubMed
    1. Alvarez, J. , Giuditta, A. , & Koenig, E. (2000). Protein synthesis in axons and terminals: Significance for maintenance, plasticity and regulation of phenotype. With a critique of slow transport theory. Progress in Neurobiology, 62, 1–62. - PubMed
    1. Andreini, C. , Putignano, V. , Rosato, A. , & Banci, L. (2018). The human iron‐proteome. Metallomics, 10, 1223–1231. - PubMed
    1. Asadollahi, E. , Trevisiol, A. , Saab, A. S. , Looser, Z. J. , Dibaj, P. , Ebrahimi, R. , Kusch, K. , Ruhwedel, T. , Möbius, W. , Jahn, O. , Lee, J. Y. , Don, A. S. , Khalil, M.‐A. , Hiller, K. , Baes, M. , Weber, B. , Abel, E. D. , Balabio, A. , Popko, B. , … Nave, K.‐A. (2024). Oligodendroglial fatty acid metabolism as a central nervous system energy reserve. Nature Neuroscience, 27, 1934–1944. - PMC - PubMed