. 2024 Sep 27;27(11):111063.
doi: 10.1016/j.isci.2024.111063. eCollection 2024 Nov 15.

Mycobacteria develop biofilms on airway epithelial cells and promote mucosal barrier disruption

Affiliations

Mycobacteria develop biofilms on airway epithelial cells and promote mucosal barrier disruption

Amy M Barclay et al. iScience. .

Abstract

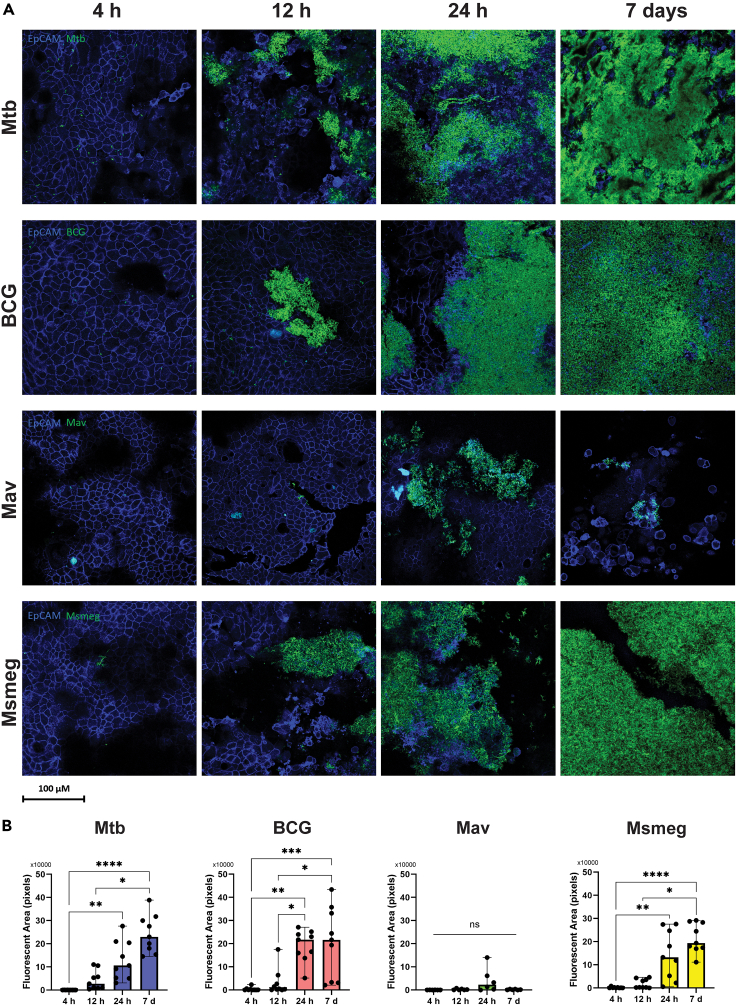
Tuberculosis displays several features commonly linked to biofilm-associated infections, including recurrence of infection and resistance to antibiotic treatment. The respiratory epithelium represents the first line of defense against pathogens such as Mycobacterium tuberculosis (Mtb). Here, we use an air-liquid interface model of human primary bronchial epithelial cells (PBEC) to explore the capability of four species of mycobacteria (Mtb, M. bovis (BCG), M. avium, and M. smegmatis) to form biofilms on airway epithelial cells. Mtb, BCG, and M. smegmatis consistently formed biofilms with extracellular matrixes on PBEC cultures. Biofilms varied in biomass, matrix polysaccharide content, and bacterial metabolic activity between species. Exposure of PBEC to mycobacteria caused the disruption of the epithelial barrier and was accompanied by mostly apical non-apoptotic cell death. Structural analysis revealed pore-like structures in 7-day biofilms. Taken together, mycobacteria can form biofilms on human airway epithelial cells, and long-term infection negatively affects barrier function and promotes cell death.

Keywords: Bacteriology; Clinical microbiology; Medical microbiology; Microbiology.


Conflict of interest statement

The authors declare no competing interests.

Figures

None
Graphical abstract
Figure 1
Figure 1
Formation and metabolic activity of mycobacterial aggregates attached to abiotic surfaces (A) Light microscopy images of 1x10⁸ bacteria cultured for 24 h or 7 days on tissue culture plates, and stained with crystal violet. Representative images from N = 3 independent experiments. (B) Boxplots show the optical density of crystal violet stained bacterial cultures. N = 2 independent experiments with 4–5 technical replicates (single biofilms) per experiment. Statistics performed as two-way ANOVA with Tukey correction for multiple testing. (C) Bar graphs show the metabolic activity of planktonic bacteria and biofilms grown on tissue culture plates. N = 3 independent experiments. Data are shown as median with range. Statistics were performed as the Kruskal-Wallis test with Dunn’s correction for multiple testing. p < 0.05 indicated with ∗, p < 0.01 ∗∗, p < 0.001 ∗∗∗, p < 0.0001 ∗∗∗∗.
Figure 2
Figure 2
Mycobacterial aggregations are formed on bronchial epithelial cells (A) Confocal microscopy images of primary bronchial epithelial cells (PBEC) cultured at an air-liquid interface for 14 days, infected with bacteria at a multiplicity of infection (MOI) of 100, taken at 24 h post-infection. EpCAM membrane marker is depicted in blue, bacteria are depicted in green. Representative images from n = 3 independent experiments. (B) Side views of z-stacks of 24 h bacterial infections depicted in A (total images, not cut-outs). (C) Boxplots show the optical density of crystal violet stained bacteria cultured on well-differentiated PBEC. N = 3 independent experiments using 3 different donor mixes, with 5 technical replicates (single PBEC inserts) per experiment. Statistics were performed as two-way ANOVA with Tukey’s correction for multiple testing. p < 0.05 indicated with ∗, p < 0.01 ∗∗, p < 0.001 ∗∗∗, p < 0.0001 ∗∗∗∗.
Figure 3
Figure 3
Polysaccharides secreted by mycobacteria increase as biofilms develop (A) Confocal microscopy images of 24 h and 7-day mycobacterial infections cultured on well-differentiated PBEC, stained with wheat germ agglutinin (WGA) to indicate polysaccharides. EpCAM is depicted in blue, bacteria in green, and WGA in red. Representative images from N = 3 independent experiments using three different donor mixes. (B) Bar graphs depicting the total area in pixels which was positive for WGA staining. Per PBEC insert, one 50 × 50 μm region of interest within the biofilm was selected for analysis. Data are shown as median with range. Statistics performed as Friedman test with Dunn’s correction for multiple testing. p < 0.05 indicated with ∗, p < 0.01 ∗∗, p < 0.001 ∗∗∗.
Figure 4
Figure 4
PBEC barrier integrity is disrupted by mycobacterial infection (A and B) Bar graphs of TEER measured on PBEC after 24 h and 7 days of biofilm formation. Positive control is 2% Triton X-100. N = at least 4 independent experiments. Data are shown as median with range. (C) Bar graph shows the passage of FITC-dextran through PBEC after 24 h and 7 days of biofilm formation. Positive control is 2% Triton X-100. N = at least 4 independent experiments. Data are shown as median with range. Statistics are performed as the Kruskal-Wallis test with Dunn’s correction for multiple testing. p < 0.05 indicated with ∗, p < 0.01 ∗∗, p < 0.001 ∗∗∗, p < 0.0001 ∗∗∗∗.
Figure 5
Figure 5
Cell death is induced upon contact with mycobacterial (A) Bar graphs showing percentage cytotoxicity induced by the presence of mycobacteria on PBEC. Percentages were calculated from the LDH release (see STAR Methods section). Data are shown as median with range. Statistics are performed as the Kruskal-Wallis test with Dunn’s correction for multiple testing. p < 0.05 indicated with ∗, p < 0.01 ∗∗, p < 0.001 ∗∗∗, p < 0.0001 ∗∗∗∗. (B and C) Confocal microscopy images of cell death (B) and apoptosis (C) induced by mycobacteria at 24 h, at the point of contact between biofilms and PBEC (top layer) and in a deeper cell layer of the same PBEC insert. Top panels are zoomed in examples of cell death and apoptosis staining in uninfected PBEC. Images from N = 2 independent experiments. EpCAM is depicted in blue, bacteria in green, and cell death markers in red.
Figure 6
Figure 6
Mycobacterial biofilms are formed within 24 h of infection (A) Confocal microscopy images of the formation of biofilms and secretion of polysaccharides at 4 h, 12 h, 24 h, and 7 days. Images from N = at least 2 independent experiments. EpCAM is depicted in blue, and bacteria in green. (B) Bar graphs depicting the total area in pixels positive for fluorescent bacteria. Data are shown as median with range. Data points are single-plane images of z-stacks. Per the experiment, the 3 planes with the largest area of bacteria were chosen for quantification. Statistics performed as Friedman test with Dunn’s correction for multiple testing. p < 0.05 indicated with ∗, p < 0.01 ∗∗, p < 0.001 ∗∗∗, p < 0.0001 ∗∗∗∗.
Figure 7
Figure 7
Morphological differences between planktonic and biofilm-associated mycobacteria (A) Scanning electron microscopy images of mycobacteria from liquid culture (planktonic) and biofilms of 24 h and 7 days grown on PBEC. Images from N = 1 experiment, taken at 150,000× magnification. (B) Scanning electron microscopy images of 24 h and 7-day Msmeg biofilms on PBEC show the formation of pore-like structures. Images taken at 10.000× magnification.

References

    1. Global Tuberculosis Report 2022. World Health Organization; 2022. https://www.who.int/teams/global-tuberculosis-programme/tb-reports/globa...
    1. Flemming H.C., Wingender J., Szewzyk U., Steinberg P., Rice S.A., Kjelleberg S. Biofilms: an emergent form of bacterial life. Nat. Rev. Microbiol. 2016;14:563–575. doi: 10.1038/nrmicro.2016.94. - DOI - PubMed
    1. Krol J.E., Wojtowicz A.J., Rogers L.M., Heuer H., Smalla K., Krone S.M., Top E.M. Invasion of E. coli biofilms by antibiotic resistance plasmids. Plasmid. 2013;70:110–119. doi: 10.1016/j.plasmid.2013.03.003. - DOI - PMC - PubMed
    1. Yamada K.J., Kielian T. Biofilm-Leukocyte Cross-Talk: Impact on Immune Polarization and Immunometabolism. J. Innate Immun. 2019;11:280–288. doi: 10.1159/000492680. - DOI - PMC - PubMed
    1. Cerca N., Jefferson K.K., Oliveira R., Pier G.B., Azeredo J. Comparative antibody-mediated phagocytosis of Staphylococcus epidermidis cells grown in a biofilm or in the planktonic state. Infect. Immun. 2006;74:4849–4855. doi: 10.1128/IAI.00230-06. - DOI - PMC - PubMed