. 2024 Nov 4:15:20417314241283148.
doi: 10.1177/20417314241283148. eCollection 2024 Jan-Dec.

Synthetic injectable and porous hydrogels for the formation of skeletal muscle fibers: Novel perspectives for the acellular repair of substantial volumetric muscle loss

Affiliations

Synthetic injectable and porous hydrogels for the formation of skeletal muscle fibers: Novel perspectives for the acellular repair of substantial volumetric muscle loss

Louise Griveau et al. J Tissue Eng. .

Abstract

In severe skeletal muscle damage, muscle tissue regeneration process has to face the loss of resident muscle stem cells (MuSCs) and the lack of connective tissue necessary to guide the regeneration process. Biocompatible and standardized 3D structures that can be injected to the muscle injury site, conforming to the defect shape while actively guiding the repair process, holds great promise for skeletal muscle tissue regeneration. In this study, we explore the use of an injectable and porous lysine dendrimer/polyethylene glycol (DGL/PEG) hydrogel as an acellular support for skeletal muscle regeneration. We adjusted the DGL/PEG composition to achieve a stiffness conducive to the attachment and proliferation of murine immortalized myoblasts and human primary muscle stems cells, sustaining the formation and maturation of muscle fibers in vitro. We then evaluated the potential of one selected "myogenic-porous hydrogel" as a supportive structure for muscle repair in a large tibialis anterior muscle defect in rats. This injectable and porous formulation filled the defect, promoting rapid cellularization with the presence of endothelial cells, macrophages, and myoblasts, thereby supporting neo-myogenesis more specifically at the interface between the wound edges and the hydrogel. The selected porous DGL/PEG hydrogel acted as a guiding scaffold at the periphery of the defect, facilitating the formation and anchorage of aligned muscle fibers 21 days after injury. Overall, our results indicate DGL/PEG porous injectable hydrogel potential to create a pro-regenerative environment for muscle cells after large skeletal muscle injuries, paving the way for acellular treatment in regenerative muscle medicine.

Keywords: Volumetric muscle loss; injectable and porous hydrogels; regenerative muscle medicine.


Conflict of interest statement

The author(s) declared no potential conflicts of interest with respect to the research, authorship, and/or publication of this article.

Figures

Graphical abstract
Graphical abstract
Figure 1.
Figure 1.
DGL/PEG hydrogel formulation and mechanical characterization: (a) Illustration of the chemical reaction occurring between DGL and PEG-NHS to form cross-linked DGL/PEG hydrogel and (b) representative picture of a 2/25 mM DGL/PEG hydrogel disc of 2 mm thickness and 9.1 mm diameter at room temperature. (c) Elastic modulus (E′) and (d) loss modulus (E″), in compression of DGL/PEG hydrogels of various concentration and ratio (kPa). (e) Elastic modulus as a function of DGL/PEG concentration for a set DGL concentration (2 mM) and (f) for a set PEG concentration (25 mM) Lines: (e) linear (R²: 0.9998) and (f) exponential (R²: 0.8702) regression. (g) Swelling ratio over time of hydrogels of various DGL/PEG concentration (mM). (c and d) One-way ANOVA + Tukey’s multiple comparison test p < 0.05 compared to Φ: 2/25, δ: 2/37, α: 2/50 mM DGL/PEG hydrogel. G: One-way ANOVA + Tukey’s multiple comparison test *p < 0.05. **p < 0.01. ***p < 0.001.
Figure 2.
Figure 2.
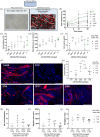
C2C12 myoblasts behavior on DGL/PEG hydrogels of various stiffness and compositions: (a) Myoblasts were cultured 30 h in proliferative condition and then switched culture for six more days in serum-depleted medium for six more days. (b) C2C12 myoblasts confluence over time on various DGL/PEG hydrogels in proliferative conditions. (c) Cell confluence and (d) cell spreading area and (e) cell velocity for 24 and 30 h post myoblasts seeding, as a function of DGL/PEG hydrogel concentration and ratio (mM DGL/PEG). F) Representative images of C2C12 myotubes on 2D flat DGL/PEG hydrogels stained for Myosin Heavy Chain (Red, MyHC) and Dapi (Blue, cell nuclei). Scale bar = 200 m. (g) Fusion index as a function of hydrogel concentration (mM DGL/PEG), after 6 days in serum depleted medium. (h–j) C2C12 myotubes quantifications after 6 days in serum depleted medium as a function of hydrogel concentration (mM DGL/PEG): (h) nuclei per myotubes, (i) myotubes area quantification (j), and elongation index (Feret’s diameter/width; left). P: Plastic dish. C, D, E, G: One-way ANOVA + Tukey’s multiple comparison p < 0.05 compared to γ: 1.6/25; Φ: 2/25, δ: 2/37, * Plastic dish.
Figure 3.
Figure 3.
C2C12 myoblasts behavior inside EPH of various concentrations: (a) scheme of the procedure for the cell culture. (b) Representative images of C2C12 myoblasts repartition inside a 2/25 mM DGL/PEG EPH after 7 days in proliferative conditions (myoblasts nuclei in blue and hydrogel in green) and close up (red dashed rectangle) with red arrows pointing at cell nuclei accumulation. (c) Representative images of C2C12 repartition inside a 2/25 mM DGL/PEG EPH after 7 days in proliferative conditions and 6 days in serum-depleted medium (cell nuclei in blue and hydrogel in grey). Scale bar = 400 m. (d) Quantification of MyH4 mRNA expression after 1, 3, and 6 days after serum depletion on various EPH conditions. One-way ANOVA + Tukey’s multiple comparison. (e) Representative images of myotubes inside EPH of various DGL/PEG compositions stained for actin cytoskeleton in green, myosin heavy chain (MyHC) in red, cell nuclei in blue, and hydrogel in dark gray). Scale bar = 200 m.
Figure 4.
Figure 4.
Primary humans muscle stem cells (pHMs) behavior inside EPH of various DGL/PEG concentrations: (a) pHMs plated onto 2/25 or 2/37 mM DGL/PEG EPH after 6 days in serum depleted medium (DM6). Cells were stained for either Myosin Heavy Chain (red, MyHC, top) or desmin (red, bottom), actin in green and dapi, in Blue (cell nuclei). Scale bar = 100 m. (b) pHMs plated onto 2/25 or 2/37 mM DGL/PEG EPH after 10 days in serum depleted medium (DM10). Top: images of cells stained for desmin (red), α-actinin in gray and dapi, in blue (cell nuclei). Bottom: close up of red dashed rectangle (top) pointing α-actinin striation. Scale bar = 50 m.
Figure 5.
Figure 5.
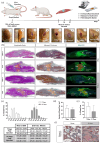
EPH suitability and fate in a muscle defect: (a) Scheme of the experimental design, images of rat tibialis anterior muscle defect and EPH injection procedure. (b) Hematoxylin Eosin (HE), Masson’s Trichrome (TM) and Wheat-Germ Agglutinin (WGA) staining of whole TA muscle harvest at two distinct time points (7- and 21-day post-implantation). Images provides a macroscopic view of tissue morphology and the spatial distribution of the injected EPH constructs within the muscle tissue (highlighted in orange). Injured-healthy muscle interfaces are indicated by dashed lines. All scale bars = 500 μm. (c; up) Closed pore size distribution, in μm, of EPH in muscles (n = 3); (bottom) Closed pore mean diameters characteristics after 7 and 21 days, in μm (n = 3). (d) Closed circular pore density within EPH over implantation time, refers to the density of circular-shaped pores within the EPH implants. (e) Percentage of empty pores within EPH at 7- and 21-day post-implantation, giving information on the rate of cellular infiltration and scaffold degradation. (f) Representative Masson’s trichrome staining showing cellularized pores within the EPH over implantation. EPH is annotated with an asterisk (*).
Figure 6.
Figure 6.
Microenvironmental characterization and cellular dynamics toward the EPH implants: (a) Representative images of immunofluorescence staining for M1 (CD11) and M2 (CD206) macrophages, and (b) blood vessels (collagen type IV). Scale bar = 200 m. (c) Right: representative images depicting MyoD immunohistochemistry. Scale bar = 500 m. Left: cropped area from the right panel, white arrows point multinucleated cells, positives for MyoD with centralized/aligned myonuclei; orange arrows point multinucleated cells, negatives for MyoD with aggregated myonuclei. EPH is denoted with an asterisk (*). Scale bar = 100 m. (d and e) Representative images illustrating immunofluorescence staining of muscle cells (MyoD in green and MyHC in red). EPH is denoted with an asterisk (*) and dapi: in blue. Multinucleated cell with aggregated myonuclei is circled with dash lines. Scale bars = 200 μm. (f) Percentage of aligned and non-aligned myofibers at 7- and 21-day post-muscle defect with EPH injection compared to empty defects. Injured-healthy muscle interfaces are indicated by dashed lines.

References

    1. Janssen IA N, Heymsfield SB, Wang ZM, et al.. Skeletal muscle mass and distribution in 468 men and women aged 18–88 yr. J Appl Physiol 2000; 89: 81–88. - PubMed
    1. Sluka KA. Gray’s anatomy - The anatomical basis of clinical practice (Chap. 5). Elsevier, 2016.
    1. Frontera WR, Ochala J. Skeletal muscle a brief review of structure and function. Calcif Tissue Int 2015; 96: 183–195. - PubMed
    1. Turner NJ, Badylak S F. Regeneration of skeletal muscle. Cell Tissue Res 2012; 347: 759–774. - PubMed
    1. Yin H, Price F, Rudnicki MA. Satellite cells and the muscle stem cell niche. Physiol Rev 2013; 93: 23–67. - PMC - PubMed

LinkOut - more resources