

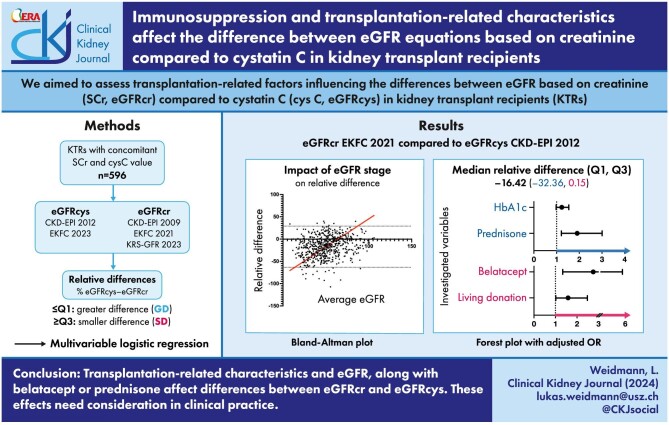
Immunosuppression and transplantation-related characteristics affect the difference between eGFR equations based on creatinine compared to cystatin C in kidney transplant recipients
- PMID: 39502371
- PMCID: PMC11536772
- DOI: 10.1093/ckj/sfae253
Immunosuppression and transplantation-related characteristics affect the difference between eGFR equations based on creatinine compared to cystatin C in kidney transplant recipients
Abstract
Introduction: Previous studies show heterogeneity when applying estimated glomerular filtration (eGFR) equations to kidney transplant recipients (KTRs). However, research on the impact of transplantation-related characteristics on eGFR equations using creatinine (eGFRcr) compared to cystatin C (eGFRcys) is scarce.
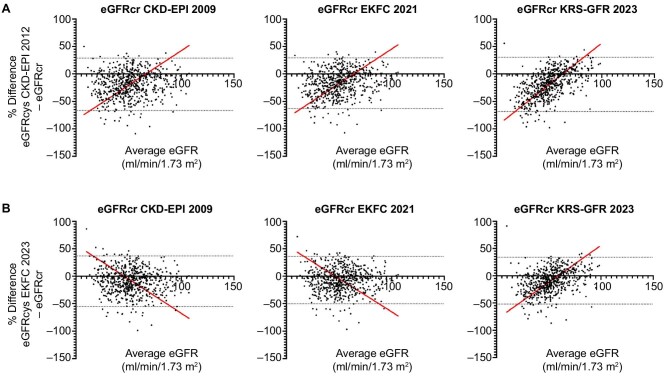
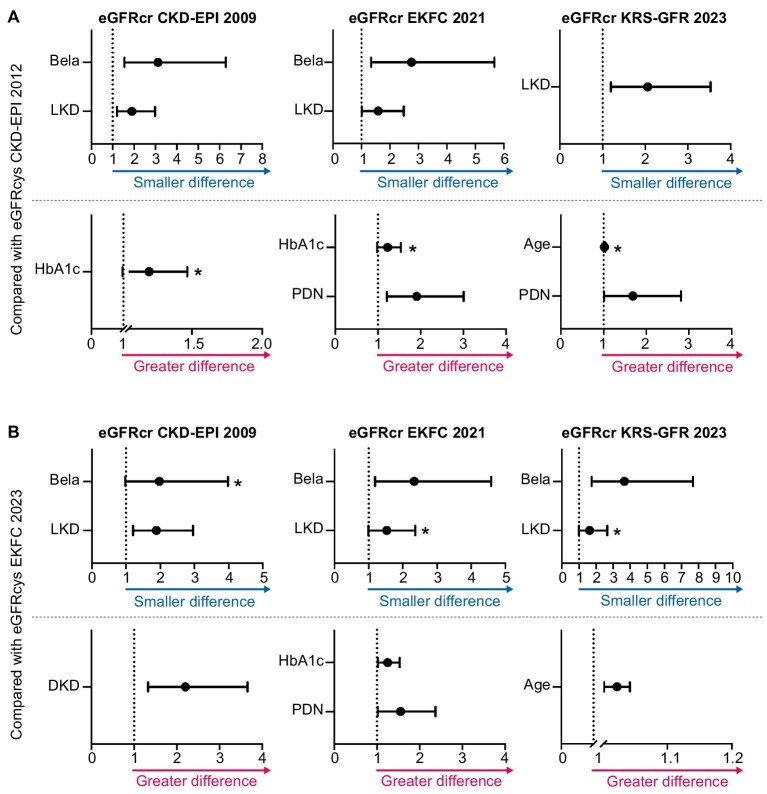
Methods: We conducted a comprehensive analysis with three eGFRcr equations (Chronic Kidney Disease Epidemiology Collaboration (CKD-EPI) 2009, European Kidney Function Consortium (EKFC) 2021, kidney recipient specific-glomerular filtration rate KRS-GFR) 2023), comparing them to two eGFRcys (CKD-EPI 2012 and EKFC 2023) in 596 KTRs. Bland-Altman plots demonstrated relative differences according to different eGFR-stages. Multivariable logistic regression identified transplantation-related characteristics independently associated with smaller or greater differences between eGFRcr and eGFRcys equations.
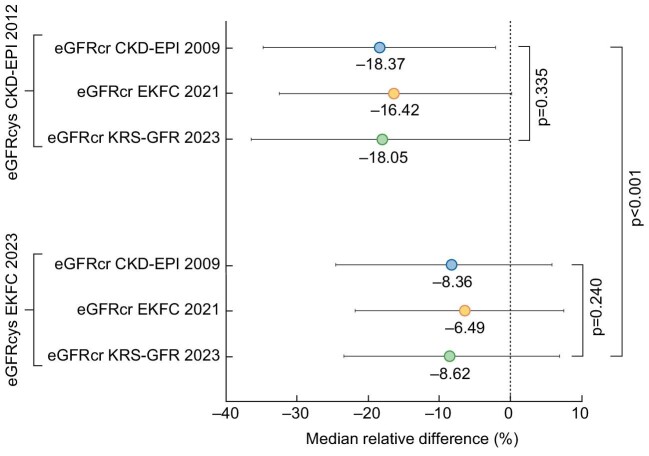
Results: 94.3% of the cohort were White individuals. Median eGFR differed as much as 9 ml/min/1.73 m2 between equations. The median relative differences (Q2) were greater (more negative) when comparing the eGFRcr equations to eGFRcys CKD-EPI 2012, than when comparing them to eGFRcys EKFC 2023 (P < .001). Better average eGFR was associated with smaller mean relative differences in all comparisons but eGFRcr CKD-EPI 2009 with eGFR EKFC 2023 and eGFRcr EKFC 2021 with eGFRcys EKFC 2023. Living kidney donation and belatacept use were independent factors associated with a smaller difference (≥Q3) between eGFRcr and eGFRcys equations, while prednisone use or higher HbA1c were independently associated with a greater difference (≤Q1) between equations.
Conclusion: Different eGFR-stages, donor, or recipient characteristics, along with immunosuppression such as belatacept or prednisone, contribute to differences between eGFRcr and eGFRcys. These effects need to be considered in the clinical management of KTRs.
Keywords: creatinine; cystatin C; estimated glomerular filtration rate; immunosuppression; kidney transplantation.
© The Author(s) 2024. Published by Oxford University Press on behalf of the ERA.
Conflict of interest statement
All authors had no competing interests to declare.
Figures


References
-
- Levey AS, Coresh J, Greene T et al. Using standardized serum creatinine values in the modification of diet in renal disease study equation for estimating glomerular filtration rate. Ann Intern Med 2006;145:247–54. 10.7326/0003-4819-145-4-200608150-00004. (Erratum in: Ann Intern Med. 2008 Oct 7;149(7):519. Erratum in: Ann Intern Med. 2021 Apr;174(4):584). - DOI - PubMed
LinkOut - more resources
Full Text Sources
Research Materials
Miscellaneous
