. 2024 Oct 3;6(1):vdae159.
doi: 10.1093/noajnl/vdae159. eCollection 2024 Jan-Dec.

Distinction of pseudoprogression from true progression in glioblastomas using machine learning based on multiparametric magnetic resonance imaging and O6-methylguanine-methyltransferase promoter methylation status

Affiliations

Distinction of pseudoprogression from true progression in glioblastomas using machine learning based on multiparametric magnetic resonance imaging and O6-methylguanine-methyltransferase promoter methylation status

Virendra Kumar Yadav et al. Neurooncol Adv. .

Abstract

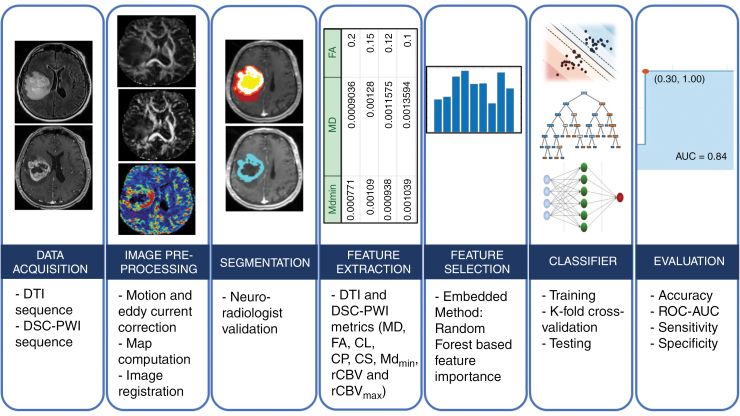
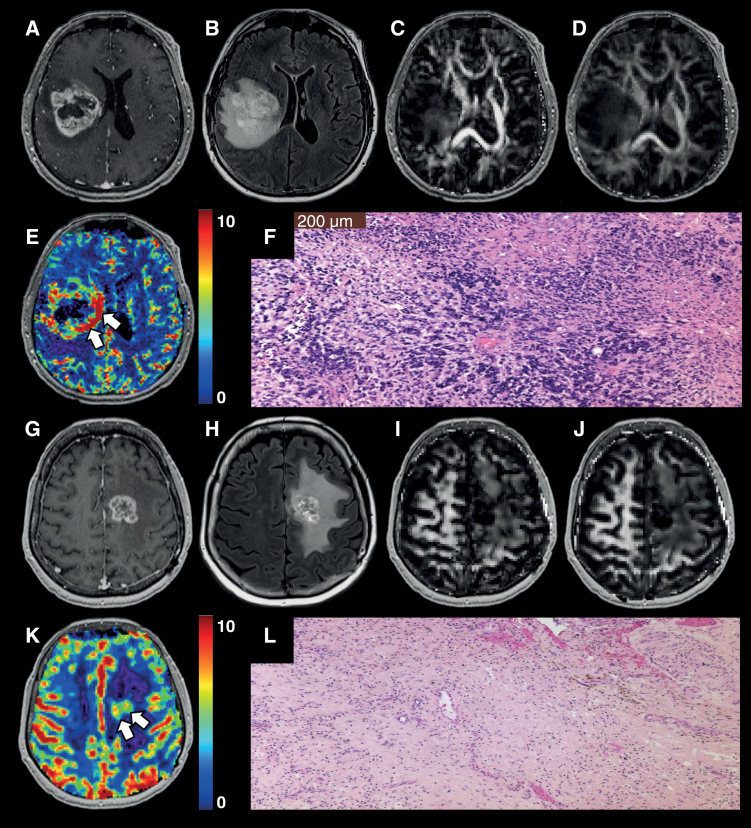
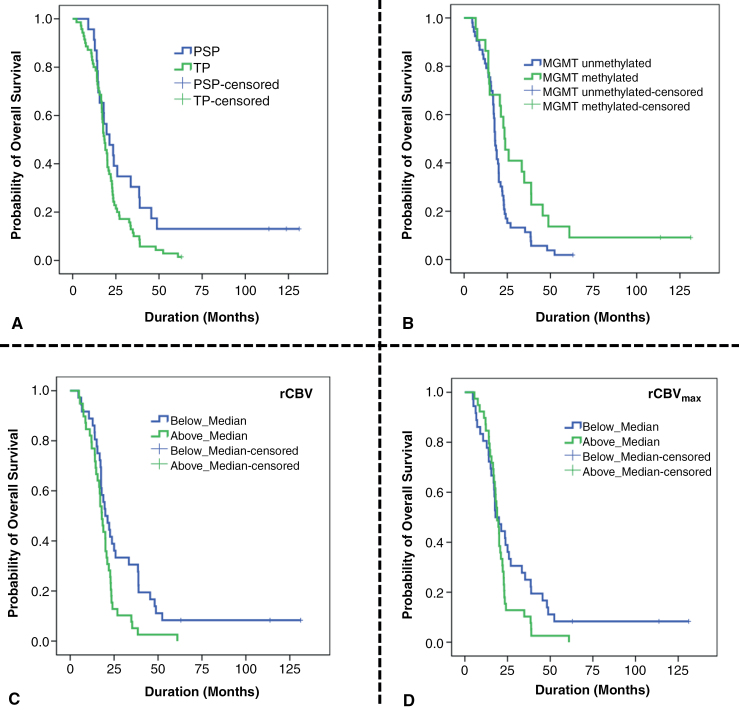
Background: It is imperative to differentiate true progression (TP) from pseudoprogression (PsP) in glioblastomas (GBMs). We sought to investigate the potential of physiologically sensitive quantitative parameters derived from diffusion and perfusion magnetic resonance imaging (MRI), and molecular signature combined with machine learning in distinguishing TP from PsP in GBMs in the present study.

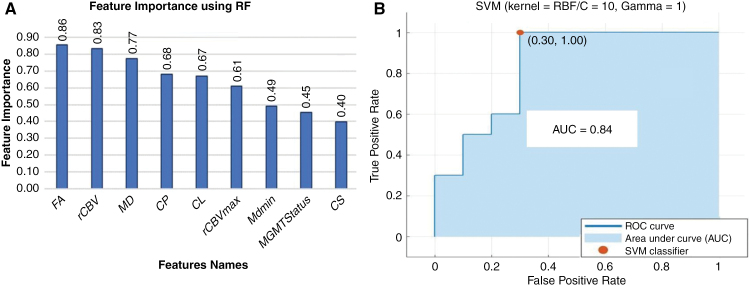
Methods: GBM patients (n = 93) exhibiting contrast-enhancing lesions within 6 months after completion of standard treatment underwent 3T MRI. Final data analyses were performed on 75 patients as O6-methylguanine-DNA-methyltransferase (MGMT) status was available only from these patients. Subsequently, patients were classified as TP (n = 55) or PsP (n = 20) based on histological features or mRANO criteria. Quantitative parameters were computed from contrast-enhancing regions of neoplasms. PsP datasets were artificially augmented to achieve balanced class distribution in 2 groups (TP and PsP). A random forest algorithm was applied to select the optimized features. The data were randomly split into training and testing subsets in an 8:2 ratio. To develop a robust prediction model in distinguishing TP from PsP, several machine-learning classifiers were employed. The cross-validation and receiver operating characteristic (ROC) curve analyses were performed to determine the diagnostic performance.

Results: The quadratic support vector machine was found to be the best classifier in distinguishing TP from PsP with a training accuracy of 91%, cross-validation accuracy of 86%, and testing accuracy of 85%. Additionally, ROC analysis revealed an accuracy of 85%, sensitivity of 70%, and specificity of 100%.

Conclusions: Machine learning using quantitative multiparametric MRI may be a promising approach to distinguishing TP from PsP in GBMs.

Keywords: diffusion and perfusion MR imaging; glioblastoma; machine-learning; pseudoprogression; true progression.


Conflict of interest statement

The authors declare no conflict of interest. The authors have no relevant financial or nonfinancial interests to disclose.

Figures

Figure 1.
Figure 1.
Workflow depicting the steps in developing a prediction model in distinguishing TP from PsP and subsequent evaluation of diagnostic performance by calculating accuracy, sensitivity, specificity, and AUC on a separate, independent test dataset (Abbreviations: DTI, diffusion tensor imaging; DSC-PWI, dynamic susceptibility contrast-perfusion weighted imaging; MD, mean diffusivity; FA, fractional anisotropy; CL, coefficient of linear anisotropy; CP, planar anisotropy; CS, spherical anisotropy; ROC, receiver operating characteristic curve; AUC, area under the ROC curve).
Figure 2.
Figure 2.
Subfigure(A-F) A 56-year-old male patient with GBM, status post gross total resection and chemoradiation. Post-contrast T1-weighted image (A) shows a heterogeneously enhancing lesion located in the right parietal region and extending into the lateral ventricles, which had increased from prior scans. T2-FLAIR image (B) demonstrates a large area of associated hyperintense signal abnormality. DTI-derived maps CL (C) and FA (D) show median values of anisotropy indices (CL = 0.04 and FA = 0.12) from the contrast-enhancing regions of the neoplasm. DSC-PWI-derived CBV map (E) shows a markedly elevated rCBVmax value of 7.08 from enhancing regions (white arrows). A photomicrograph (F) of hematoxylin-eosin (H & E) stain from this case demonstrates areas of high tumor cellularity, pseudopalisading necrosis, endothelial proliferation, and increased mitotic activity consistent with the findings of true progression (The magnification is 100 × [10× eyepiece, 10× objective lens]). Subfigure(G-L) A 55-year-old male patient with GBM, status post gross total resection and chemoradiation. Post-contrast T1-weighted image (G) shows a heterogeneously enhancing lesion at the site of the previously resected neoplasm in the left frontal lobe. T2-FLAIR image (H) demonstrates hyperintense signal intensity surrounding the lesion. DTI-derived maps CL (I) and FA (J) show moderate median values of anisotropy indices (CL = 0.04 and FA = 0.10) from contrast-enhancing regions of the neoplasm. DSC-PWI-derived CBV map (K) shows a low rCBVmax value of 2.28 from enhancing regions (white arrows). A photomicrograph (L) of hematoxylin-eosin (H & E) stain demonstrates a predominant treatment effect (~80%) with hyalinization of vessels and tissues, geographic necrosis, and chronic lymphocytic infiltration consistent with the findings of PsP. However, infiltrating glial tumor cells with moderate nuclear pleomorphism were also present, comprising approximately 20% of the specimen. (Abbreviations—GBM, glioblastoma; FLAIR, fluid-attenuated inversion recovery; DTI, diffusion tensor imaging; CL, coefficient of linear anisotropy; FA, fractional anisotropy; DSC-PWI, dynamic susceptibility contrast-perfusion weighted imaging; CBV, cerebral blood volume; rCBV, relative cerebral blood volume; TP, true progression; PsP, pseudoprogression).
Figure 3.
Figure 3.
The bar plots (A) represent the feature importance (in descending order) based on a random-forest algorithm. The ROC curve (B) exhibits an AUC of 0.84 for the best prediction model (SVM with RBF kernel) in distinguishing TP from PsP. (Abbreviations- FA, fractional anisotropy; rCBV, relative cerebral blood volume; MD, mean diffusivity; CL, coefficient of linear anisotropy; CP, planar anisotropy; CS, spherical anisotropy; ROC, receiver operating characteristic curve; AUC, area under the ROC curve; SVM, support vector machine).
Figure 4.
Figure 4.
The Boxplot labeled A to H depicts the classification training and cross-validation accuracies of logistic regression (LR), support vector machine with a radial basis kernel (quadratic SVM), random forest (RF), medium neural network (MNN) across the 6-folds, with Series 1 to Series 9 representing feature vectors. Feature vector: Series1={FA}, Series2= {FA, rCBV}, Series3={FA, rCBV, MD}, Series4= {FA, rCBV, MD, CP}, Series5= {FA, rCBV, MD, CP, CL}, Series6= {FA, rCBV, MD, CP, CL, rCBVmax}, Series7= {FA, rCBV, MD, CP, CL, rCBVmax, MDmin}, Series8= {FA, rCBV, MD, CP, CL, rCBVmax, MDmin, MGMT}, Series9= {FA, rCBV, MD, CP, CL, rCBVmax, MDmin, MGMT, CS}. (Abbreviations- FA, fractional anisotropy; rCBV, relative cerebral blood volume; MD, mean diffusivity; CL, coefficient of linear anisotropy; CP, planar anisotropy; MGMT, O6-methylguanine-DNA-methyltransferase; CS, spherical anisotropy).
Figure 5.
Figure 5.
Kaplan–Meier (KM) curves illustrate that patients with PsP have significantly longer overall survival compared to those with TP (log-rank P = .043) in subfigure (A). Additionally, GBM patients with MGMT promoter methylation status exhibit longer overall survival than those without (log-rank P = .015) in subfigure (B). KM curves also show that GBM patients with lower median rCBV have significantly longer survival times compared to those with higher median rCBV (20.5 ± 2.47 vs. 18.1 ± 1.09 months, log-rank P = .011) in subfigure (C). Furthermore, there is a trend towards longer survival for GBM patients with lower rCBVmax (17.9 ± 2.4 vs. 18.9 ± 1.24 months, log-rank P = .081) in subfigure (D) (Abbreviations–PsP, pseudoprogression; TP, true progression; GBM, glioblastoma; MGMT, O6-methylguanine-DNA-methyltransferase; rCBV, relative cerebral blood volume).

Similar articles

Cited by

References

    1. Thust SC, van den Bent MJ, Smits M.. Pseudoprogression of brain tumors. J Magn Reson Imaging. 2018;48(3):571–589. - PMC - PubMed
    1. Abbasi AW, Westerlaan HE, Holtman GA, et al. Incidence of tumour progression and pseudoprogression in high-grade gliomas: A systematic review and meta-analysis. Clin Neuroradiol. 2018;28(3):401–411. - PMC - PubMed
    1. Gunjur A, Lau E, Taouk Y, Ryan G.. Early post-treatment pseudo-progression amongst glioblastoma multiforme patients treated with radiotherapy and temozolomide: A retrospective analysis. J Med Imaging Radiat Oncol. 2011;55(6):603–610. - PubMed
    1. Van Mieghem E, Wozniak A, Geussens Y, et al. Defining pseudoprogression in glioblastoma multiforme. Eur J Neurol. 2013;20(10):1335–1341. - PubMed
    1. Kong DS, Kim ST, Kim EH, et al. Diagnostic dilemma of pseudoprogression in the treatment of newly diagnosed glioblastomas: The role of assessing relative cerebral blood flow volume and oxygen-6-Methylguanine-DNA Methyltransferase Promoter Methylation Status. AJNR Am J Neuroradiol. 2011;32(2):382–387. - PMC - PubMed

LinkOut - more resources