. 2024 Oct 22:12:1469272.
doi: 10.3389/fbioe.2024.1469272. eCollection 2024.

A novel framework for elucidating the effect of mechanical loading on the geometry of ovariectomized mouse tibiae using principal component analysis

Affiliations

A novel framework for elucidating the effect of mechanical loading on the geometry of ovariectomized mouse tibiae using principal component analysis

Stamatina Moraiti et al. Front Bioeng Biotechnol. .

Abstract

Introduction: Murine models are used to test the effect of anti-osteoporosis treatments as they replicate some of the bone phenotypes observed in osteoporotic (OP) patients. The effect of disease and treatment is typically described as changes in bone geometry and microstructure over time. Conventional assessment of geometric changes relies on morphometric scalar parameters. However, being correlated with each other, these parameters do not describe separate fractions of variations and offer only a moderate insight into temporal changes.

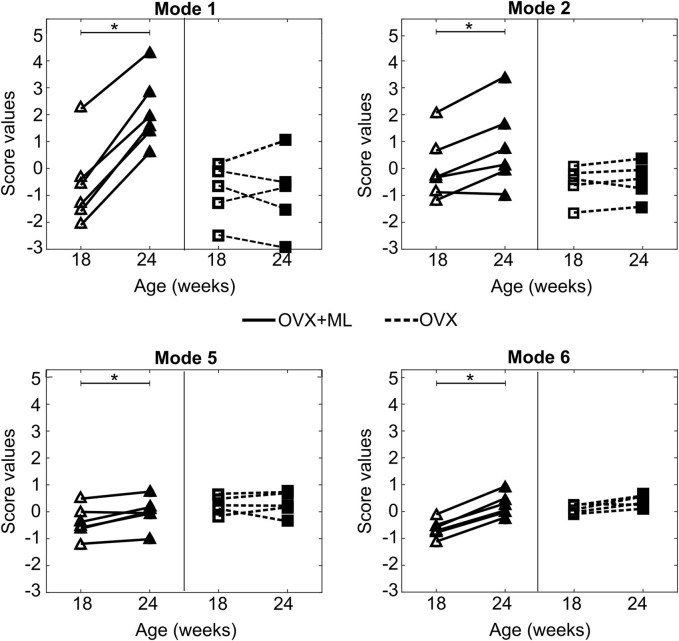
Methods: The current study proposes a novel image-based framework that employs deformable image registration on in vivo longitudinal images of bones and Principal Component Analysis (PCA) for improved quantification of geometric effects of OP treatments. This PCA-based model and a novel post-processing of score changes provide orthogonal modes of shape variations temporally induced by a course of treatment (specifically in vivo mechanical loading).

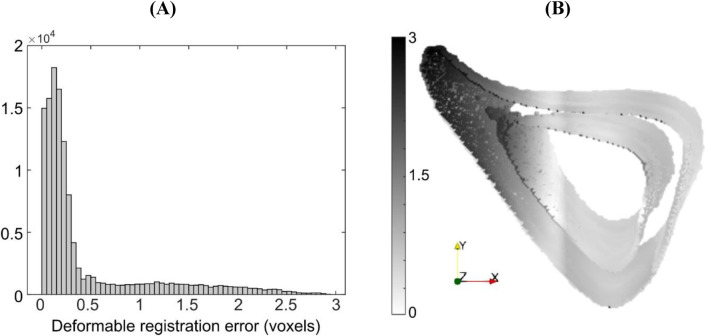
Results and discussion: Errors associated with the proposed framework are rigorously quantified and it is shown that the accuracy of deformable image registration in capturing the bone shapes (∼1 voxel = 10.4 μm) is of the same order of magnitude as the relevant state-of-the-art evaluation studies. Applying the framework to longitudinal image data from the midshaft section of ovariectomized mouse tibia, two mutually orthogonal mode shapes are reliably identified to be an effect of treatment. The mode shapes captured changes of the tibia geometry due to the treatment at the anterior crest (maximum of 0.103 mm) and across the tibia midshaft section and the posterior (0.030 mm) and medial (0.024 mm) aspects. These changes agree with those reported previously but are now described in a compact fashion, as a vector field of displacements on the bone surface. The proposed framework enables a more detailed investigation of the effect of disease and treatment on bones in preclinical studies and boosts the precision of such assessments.

Keywords: bone morphometry; mechanical loading; mouse tibia; osteoporosis; principal component analysis (PCA).


Conflict of interest statement

The authors declare that the research was conducted in the absence of any commercial or financial relationships that could be construed as a potential conflict of interest.

Figures

FIGURE 1
FIGURE 1
Framework flowchart. Step 0: The grayscale image slices corresponding to the midshaft section are extracted for each of the M images of mouse tibia. Step1: All images are aligned to a reference image sample previously registered to its anatomical coordinate system. Step 2: The greyscale images are binarized and corrected to enforce topological equivalence. Step 3: The reference surface mesh, consisting of N nodes with x, y and z coordinates, is extracted from the binarized reference image. Step 4: The reference bone is mapped to all other image samples by applying a deformable image registration algorithm using the Sheffield Image Registration Toolkit (ShIRT). The deformation field is applied to the reference surface mesh leading to individual surface meshes for each bone shape observation. The periosteum and endosteum surface mesh for each mouse image constitutes the rows of the PCA input P.
FIGURE 2
FIGURE 2
Example of the trabecula feature and its structural evolution over time between weeks 18 and 24 of age.
FIGURE 3
FIGURE 3
Examples of applied virtual deformation fields: (A) Study #5: Posterior, Smaller Part, Tc = 0.85; (B) Study #5: Posterior, Smaller Part, Tc = 1.15; (C) Study #5: Anterior, Half, Tc = 1.2. The deformations comprise: a virtual translation with components 2.5 voxels in horizontal (anterior, A to posterior, P) and vertical (medial, M to lateral, L) directions (red arrows), and two voxels in the length direction (proximal to distal, not shown here); and an affine transformation that deforms only the part of the image spanned by the blue arrows, displaces the dashed blue line by zero and reaches its full magnitude (Tc) at the corresponding edge of the image. Regions of overlap between the fixed (red) and moved (green) bone images are shown in yellow.
FIGURE 4
FIGURE 4
Types of variations in the examined population. The population includes longitudinal data of treated and untreated mice. The proposed PCA score processing uncovers all the sources of variations and differentiates them into classes. These classes are generic variations among groups and systematic variations with respect to time. The latter can be further categorized into disease progression and growth, and treatment effects.
FIGURE 5
FIGURE 5
Dependence of errors associated with accuracy (A) and precision (B) of the deformable registration on Nodal Spacing. Each line corresponds to a different imposed displacement field; the details of these are found in the main text.
FIGURE 6
FIGURE 6
(A) Histogram of registration errors and (B) their spatial distribution on the bone surface for the simulated displacement field given by ‘Study #5, Anterior, Half, Tc = 1.2’. Errors are shown for a representative specimen taken from the “OVX + ML” group at 18 weeks of age. Contour darkness indicates error magnitude at the specific location on the bone surface.
FIGURE 7
FIGURE 7
Cumulative variance (%) explained by the PCA modes. The first six modes (red circles) describe up to 91% of the total geometric variance within the examined population.
FIGURE 8
FIGURE 8
The 3D profiles of the treatment-related modes 1, 2, 3, 4, 5 and 6, depicted as vectors plotted on the mean shape. The vectors are scaled and colored by the mode magnitude at each point of the mesh. Darker and longer arrows indicate higher variability in shape across different bone specimens at that surface location. All profiles share the same viewpoint.
FIGURE 9
FIGURE 9
(A) Boxplots of the leave-one-out errors in reconstructing the bone geometry of six mice in the “OVX + ML” group at weeks 18 and 24. The overall median error for week 24 is statistically significantly higher (p < 0.05) than for week 18. (B) Two different views of the endosteal and periosteal surfaces (mean bone shape for week 24) overlaid with contours levels indicating magnitude of median error at each bone surface location for week 24.
FIGURE 10
FIGURE 10
Treatment categorization of Modes 1, 2, 5 and 6. Mode score values of individual mice at are shown at week 18 (unfilled) and week 24 (filled) (“OVX + ML”, △; “OVX”, ▢). Lines (“OVX + ML”, solid; “OVX”, dashed) connect mode scores of individual mice between the two time points. Asterisks (*) highlight median changes with time of mode scores in a group that are statistically significantly (p < 0.05) different from zero.
FIGURE 11
FIGURE 11
Median changes in endosteum and periosteum shapes due to Modes 1, 2, 5 and 6 between weeks 18 and 24 in “OVX + ML” group. The directions of change at different locations are denoted by the arrows, and a redder arrow indicates a relatively larger change. The mean bone profile at week 18 is shown as a solid gray surface, whilst the mean profile at week 24 is given as a colored wireframe.

Similar articles

References

    1. Akhter M. P., Recker R. R. (2021). High resolution imaging in bone tissue research-review. Bone 143, 115620. 10.1016/j.bone.2020.115620 - DOI - PubMed
    1. Aldieri A., Terzini M., Audenino A. L., Bignardi C., Morbiducci U. (2020). Combining shape and intensity dxa-based statistical approaches for osteoporotic HIP fracture risk assessment. Comput. Biol. Med. 127, 104093. 10.1016/j.compbiomed.2020.104093 - DOI - PubMed
    1. Barber D. C., Hose D. R. (2005). Automatic segmentation of medical images using image registration: diagnostic and simulation applications. J. Med. Eng. and Technol. 29 (2), 53–63. 10.1080/03091900412331289889 - DOI - PubMed
    1. Barratt D. C., Chan C. S. K., Edwards P. J., Penney G. P., Slomczykowski M., Carter T. J., et al. (2008). Instantiation and registration of statistical shape models of the femur and pelvis using 3D ultrasound imaging. Med. Image Anal. 12 (3), 358–374. 10.1016/j.media.2007.12.006 - DOI - PubMed
    1. Birkhold A. I., Razi H., Duda G. N., Checa S., Willie B. M. (2017). Tomography-based quantification of regional differences in cortical bone surface remodeling and mechano-response. Calcif. tissue Int. 100, 255–270. 10.1007/s00223-016-0217-4 - DOI - PubMed

LinkOut - more resources