[Preprint]. 2024 Oct 23:2024.10.22.24315478.
doi: 10.1101/2024.10.22.24315478.

The role of the microbiota in respiratory virus-bacterial pathobiont relationships in the upper respiratory tract

Affiliations

The role of the microbiota in respiratory virus-bacterial pathobiont relationships in the upper respiratory tract

Matthew S Kelly et al. medRxiv. .

Update in

Abstract

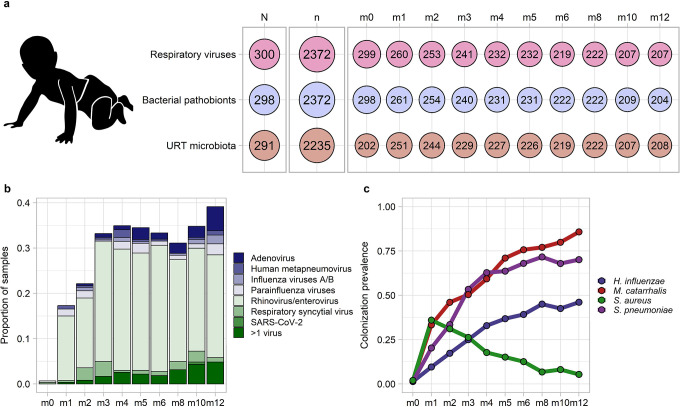
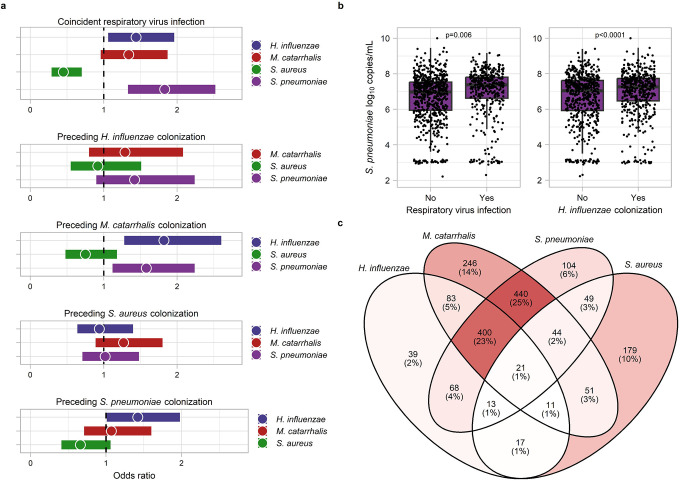
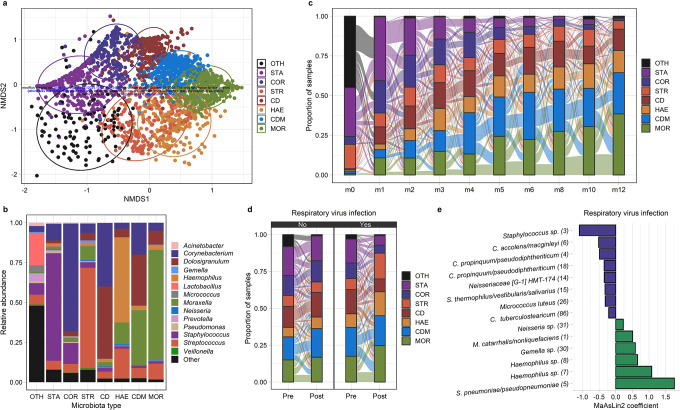
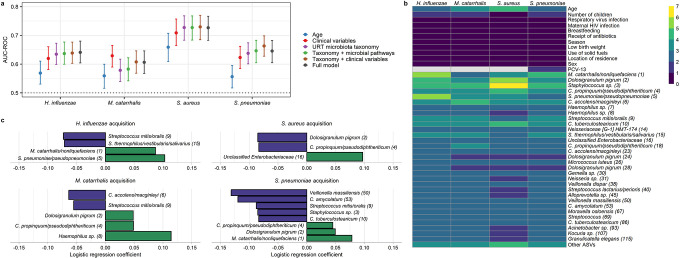
The mechanisms by which respiratory viruses predispose to secondary bacterial infections remain poorly characterized. Using 2,409 nasopharyngeal swabs from 300 infants in Botswana, we performed a detailed analysis of factors that influence the dynamics of bacterial pathobiont colonization during infancy. We quantify the extent to which viruses increase the acquisition of Haemophilus influenzae, Moraxella catarrhalis, and Streptococcus pneumoniae. We provide evidence of cooperative interactions between these pathobionts while identifying host characteristics and environmental exposures that influence the odds of pathobiont colonization during early life. Using 16S rRNA gene sequencing, we demonstrate that respiratory viruses result in losses of putatively beneficial Corynebacterium and Streptococcus species that are associated with a lower odds of pathobiont acquisition. These findings provide novel insights into viral-bacterial relationships in the URT of direct relevance to respiratory infections and suggest that the URT bacterial microbiota is a potentially modifiable mechanism by which viruses promote bacterial respiratory infections.

Keywords: Haemophilus influenzae; Moraxella catarrhalis; Staphylococcus aureus; Streptococcus pneumoniae carriage; childhood respiratory infections; children; nasopharyngeal microbiota; respiratory microbiome; sub-Saharan Africa.


Conflict of interest statement

Competing interests: MSK is a consultant for Merck & Co, Inc. and Invivyd. All other authors declare that they have no competing interests.

Figures

Figure 1.
Figure 1.. Respiratory viral infections and bacterial pathobiont colonization during infancy.
a. Overview of the number of infants (N) and samples (n) from which data were available for respiratory virus testing by PCR, identification of bacterial pathobiont colonization by PCR, and characterization of the upper respiratory tract microbiota through sequencing of the 16S ribosomal RNA gene. The number of samples with available data is further shown by age of sample collection in months (m0-m12). b. Stacked histogram showing the prevalence of detection of specific respiratory viruses by age of sample collection. c. Line plots depicting the prevalence of nasopharyngeal colonization by bacterial pathobionts by age of sample collection. URT, upper respiratory tract; SARS-CoV-2, severe acute respiratory syndrome coronavirus 2
Figure 2.
Figure 2.. Viral-bacterial and bacterial-bacterial relationships and the dynamics of bacterial pathobiont colonization during infancy.
a. Forest plots presenting results from mixed effect logistic regression models evaluating associations between preceding bacterial pathobiont colonization or respiratory virus infection and the subsequent acquisition of specific bacterial pathobionts. b. Box and whisker plots show the log10 copies/mL of Streptococcus pneumoniae DNA detected by quantitative PCR in samples from infants with pneumococcal colonization with and without concurrent respiratory virus detection or H. influenzae colonization. Lines splitting the boxes correspond to median values, box edges represent the 25th and 75th percentiles, and single points represent data for individual samples. p values were estimated using linear regression. c. Venn diagram depicting the co-occurrence of bacterial respiratory pathobionts within infant upper respiratory samples, including the number (percentage) of samples with detection of specific combinations of these pathobionts. There were 586 (25%) samples from which no bacterial pathobionts were detected (not shown).
Figure 3.
Figure 3.. The dynamics of the upper respiratory microbiota among infants in Botswana.
a. NMDS plot based on Bray-Curtis distances depicts microbiota composition based on 16S rRNA sequencing of nasopharyngeal swabs collected from infants in Botswana during the first year of life. k-medoids clustering was used to identify 8 distinct microbiota types. Ellipses define the regions containing 80% of all samples that can be drawn from the underlying multivariate t distribution. b. Relative abundances of highly abundant genera in upper respiratory samples from infants (n=2,235 samples) by microbiota type. c.,d. Alluvial diagram depicting upper respiratory microbiota community state transitions during the first year of life (c.) and with respiratory virus infection (d.). e. MaAsLin2 was used to a fit generalized linear mixed model evaluating the association between respiratory virus infection and the relative abundances of ASVs within the infant upper respiratory microbiota. The coefficients from these models, which correspond to the relative effect sizes of associations, are shown for significant associations (q<0.20). ASVs that decreased/increased in abundance in association with respiratory virus infection are shown as blue/green bars. The taxonomic classification of each ASV based on BLAST searches is shown followed by a number in parentheses corresponding to the mean relative abundance of this ASV in infant nasopharyngeal samples (ASV1 was the most abundant ASV across all samples). URT microbiota types are abbreviated CD, Corynebacterium/Dolosigranulum-dominant; CDM, Corynebacterium/Dolosigranulum/Moraxella-dominant; COR, Corynebacterium-dominant; HAE, Haemophilus-dominant; MOR, Moraxella-dominant; STA, Staphylococcus-dominant; STR, Streptococcus-dominant; and OTH, “other.” ASV, amplicon sequence variant; non-metric multidimensional scaling
Figure 4.
Figure 4.. Associations between the upper respiratory microbiota and the acquisition of bacterial pathobionts.
a. Forest plots depict the accuracy of random forest models for the prediction of acquisition of bacterial pathobionts. Clinical variables included in the models were age, number of children in the household (<5 years of age), respiratory virus infection, maternal HIV infection, breastfeeding, receipt of antibiotics, season, low birth weight, use of solid fuels, location of residency (urban or rural), and 13-valent pneumococcal conjugate vaccine doses (for S. pneumoniae only). Data on URT microbiota taxonomy and microbial pathways were from the study visit preceding the visit at which the sample was collected to evaluate for bacterial pathobiont acquisition. For time-varying clinical variables, the data included in the models were collected at the study visit at which the sample was collected to evaluate for pathobiont acquisition. b. Heatmap depicting variable of importance scores for features in random forest models predicting pathobiont colonization and containing URT microbiota taxonomic data and clinical variables. The taxonomic classification of each ASV based on a BLAST search is shown, followed by a number in parentheses corresponding to the mean relative abundance of this ASV in infant nasopharyngeal samples (ASV1 was the most abundant ASV across all samples). c. Mixed effect logistic regression was used to identify URT microbiota features from the preceding sample that predicted pathobiont acquisition. The coefficients from these models, which correspond to the relative effect sizes of associations, are shown for significant associations (q<0.20). ASVs for which higher/lower relative abundances were associated with lower odds of pathobiont acquisition are shown as blue/green bars. AUC-ROC, area under the receiving operating characteristic curve; URT, upper respiratory tract; ASV, amplicon sequence variant

References

    1. Bender RG, Sirota SB, Swetschinski LR, Dominguez R-MV, Novotney A, Wool EE, et al. Global, regional, and national incidence and mortality burden of non-COVID-19 lower respiratory infections and aetiologies, 1990–2021: a systematic analysis from the Global Burden of Disease Study 2021. The Lancet Infectious Diseases. 2024. - PMC - PubMed
    1. Kelly MS, Smieja M, Luinstra K, Wirth KE, Goldfarb DM, Steenhoff AP, et al. Association of respiratory viruses with outcomes of severe childhood pneumonia in Botswana. PloS one. 2015;10(5):e0126593. - PMC - PubMed
    1. O’Brien KL, Baggett HC, Brooks WA, Feikin DR, Hammitt LL, Higdon MM, et al. Causes of severe pneumonia requiring hospital admission in children without HIV infection from Africa and Asia: the PERCH multi-country case-control study. The Lancet. 2019;394(10200):757–79. - PMC - PubMed
    1. Wahl B, O’Brien KL, Greenbaum A, Majumder A, Liu L, Chu Y, et al. Burden of Streptococcus pneumoniae and Haemophilus influenzae type b disease in children in the era of conjugate vaccines: global, regional, and national estimates for 2000–15. The Lancet Global Health. 2018;6(7):e744–e57. - PMC - PubMed
    1. Chien Y-W, Klugman KP, Morens DM. Bacterial pathogens and death during the 1918 influenza pandemic. New England Journal of Medicine. 2009;361(26):2582–3. - PubMed

Publication types

LinkOut - more resources