[Preprint]. 2024 Oct 4:2024.10.02.24314732.
doi: 10.1101/2024.10.02.24314732.

Phenotype harmonization and analysis for The Populations Underrepresented in Mental illness Association Studies (the PUMAS Project)

Ana M Ramirez-Diaz  1 Ana M Diaz-Zuluaga  1 Rocky E Stroud 2nd  2   3 Annabel Vreeker  4   5 Mary Bitta  6   7 Franjo Ivankovic  8   3 Olivia Wootton  9 Cole A Whiteman  10 Hayden Mountcastle  2   3 Shaili C Jha  2   3 Penelope Georgakopoulos  11 Ishpreet Kaur  1 Laura Mena  1 Sandi Asaaf  1 André Luiz de Souza Rodrigues  12   13   14 Carolina Ziebold  15 Charles R J C Newton  7   16   17 Dan J Stein  17   18 Dickens Akena  19 Johanna Valencia-Echeverry  20 Joseph Kyebuzibwa  19 Juan D Palacio-Ortiz  20 Justin McMahon  2   3 Linnet Ongeri  21 Lori B Chibnik  3   2 Lucas C Quarantini  22 Lukoye Atwoli  23   6 Marcos L Santoro  24   25 Mark Baker  3 Mateus J A Diniz  26 Mauricio Castaño-Ramirez  27 Melkam Alemayehu  28 Nayana Holanda  29 Nohora C Ayola-Serrano  30 Pedro G Lorencetti  25 Rehema M Mwema  6 Roxanne James  17 Saulo Albuquerque  29 Shivangi Sharma  11 Sinéad B Chapman  3   8   31 Sintia I Belangero  25   32 Solomon Teferra  28 Stella Gichuru  33 Susan K Service  1 Symon M Kariuki  16   7 Thiago H Freitas  15   34 Zukiswa Zingela  35 Ary Gadelha  15 Carrie E Bearden  1   36 Roel A Ophoff  1   37 Benjamin M Neale  3   8   31 Alicia R Martin  8   3   31 Karestan C Koenen  3   2   31 Carlos N Pato  11 Carlos Lopez-Jaramillo  20 Victor Reus  38 Nelson Freimer  1 Michele T Pato  11 Bizu Gelaye  39   2 Loes Olde Loohuis  1   37   40
Affiliations

Phenotype harmonization and analysis for The Populations Underrepresented in Mental illness Association Studies (the PUMAS Project)

Ana M Ramirez-Diaz et al. medRxiv. .

Abstract

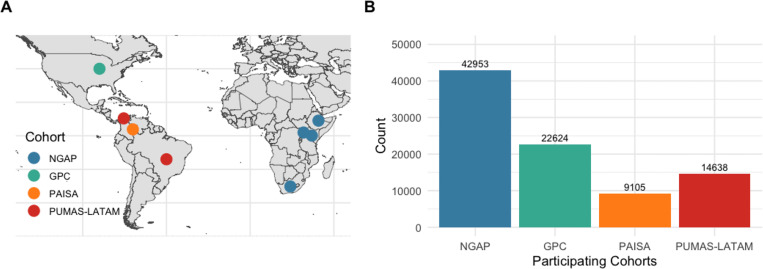
Background: The Populations Underrepresented in Mental illness Association Studies (PUMAS) project is attempting to remediate the historical underrepresentation of African and Latin American populations in psychiatric genetics through large-scale genetic association studies of individuals diagnosed with a serious mental illness [SMI, including schizophrenia (SCZ), schizoaffective disorder (SZA) bipolar disorder (BP), and severe major depressive disorder (MDD)] and matched controls. Given growing evidence indicating substantial symptomatic and genetic overlap between these diagnoses, we sought to enable transdiagnostic genetic analyses of PUMAS data by conducting phenotype alignment and harmonization for 89,320 participants (48,165 cases and 41,155 controls) from four cohorts, each of which used different ascertainment and assessment methods: PAISA n=9,105; PUMAS-LATAM n=14,638; NGAP n=42,953 and GPC n=22,624. As we describe here, these efforts have yielded harmonized datasets enabling us to analyze PUMAS genetic variation data at three levels: SMI overall, diagnoses, and individual symptoms.

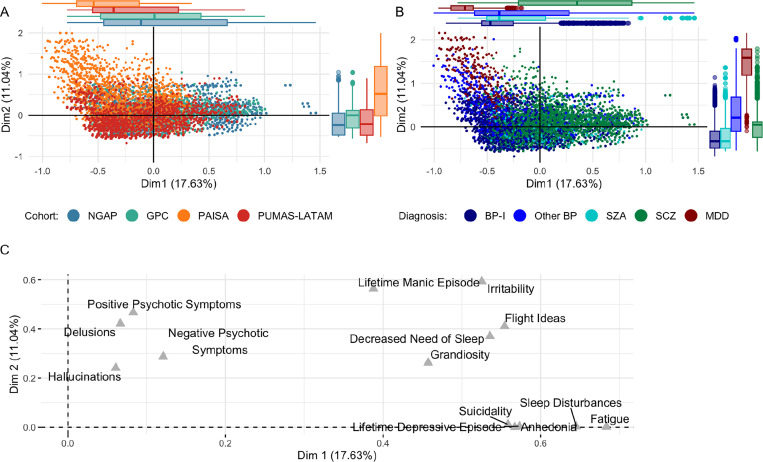
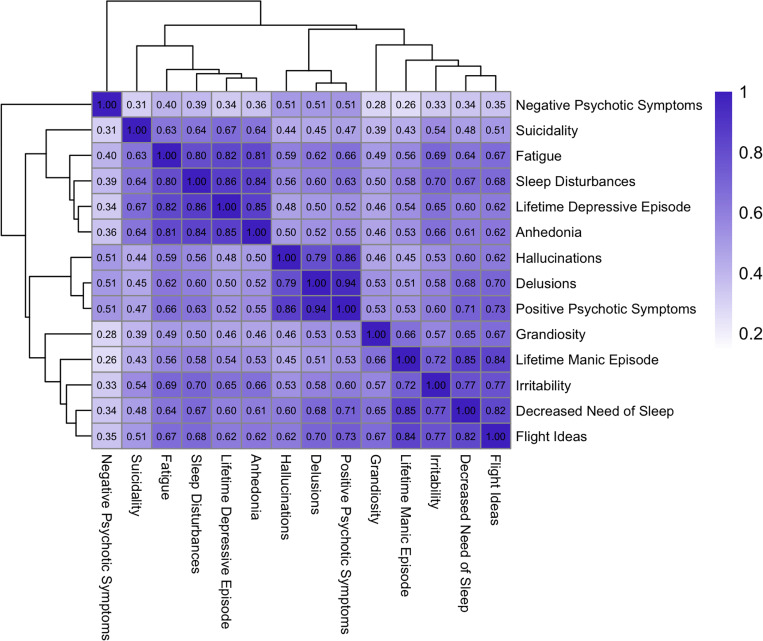
Methods: In aligning item-level phenotypes obtained from 14 different clinical instruments, we incorporated content, branching nature, and time frame for each phenotype; standardized diagnoses; and selected 19 core SMI item-level phenotypes for analyses. The harmonization was evaluated in PUMAS cases using multiple correspondence analysis (MCA), co-occurrence analyses, and item-level endorsement.

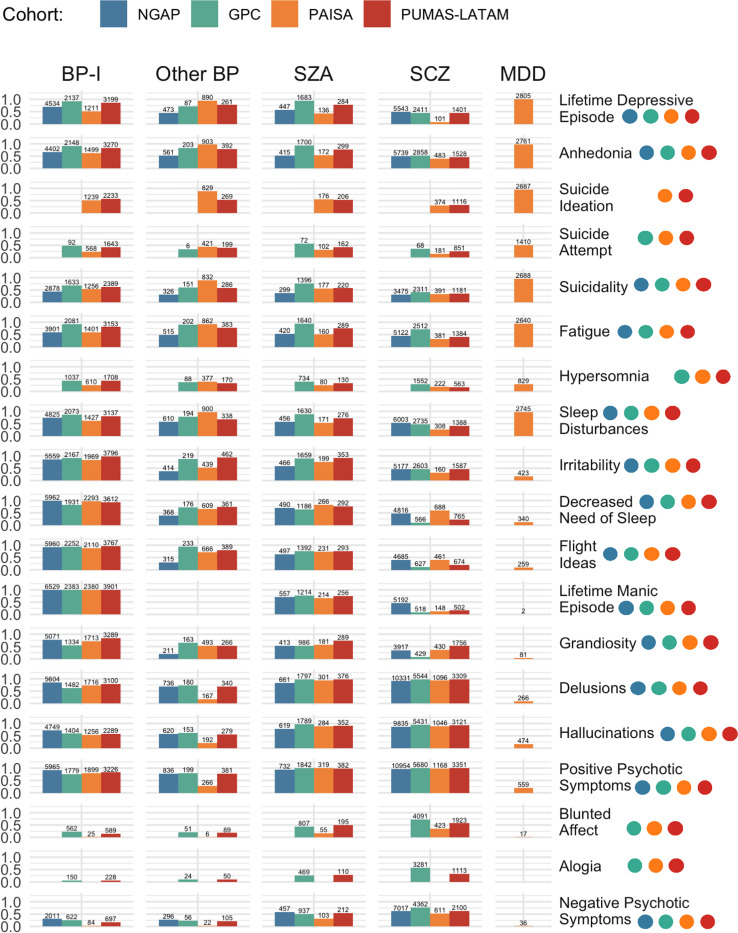
Outcomes: We mapped >6,895 item-level phenotypes in the aggregated PUMAS data, in which SCZ (44.97%) and severe BP (BP-I, 31.53%) were the most common diagnoses. Twelve of the 19 core item-level phenotypes occurred at frequencies of > 10% across all diagnoses, indicating their potential utility for transdiagnostic genetic analyses. MCA of the 14 phenotypes that were present for all cohorts revealed consistency across cohorts, and placed MDD and SCZ into separate clusters, while other diagnoses showed no significant phenotypic clustering.

Interpretation: Our alignment strategy effectively aggregated extensive phenotypic data obtained using diverse assessment tools. The MCA yielded dimensional scores which we will use for genetic analyses along with the item level phenotypes. After successful harmonization, residual phenotypic heterogeneity between cohorts reflects differences in branching structure of diagnostic instruments, recruitment strategies, and symptom interpretation (due to cultural variation).


Figures

Figure 1.
Figure 1.. Recruitment countries (A) and sample sizes (B) of PUMAS cohorts
including NGAP, GPC, PAISA, and PUMAS-LATAM. For cohorts with ongoing inclusion (GPC) data freezes up to August 2024 were used (see also Table 1).
Figure 2.
Figure 2.. PUMAS-wide Multiple Correspondence Analysis (MCA)
(A & B) depict the first two dimensions (Dim1 and Dim2) of an MCA performed using item-level phenotypes assessed in all cohorts (positive psychotic symptoms, delusions, hallucinations, negative psychotic symptoms, irritability, flight ideas, grandiosity, lifetime manic episode, lifetime depressive episode, suicidality, anhedonia, sleep disturbances, decreased need of sleep, and fatigue). Individuals are colored by cohort (NGAP, GPC, PAISA, PUMAS-LATAM (A) and by Diagnosis (BP-I, Other BP, SZA, SCZ, and MDD) (B). The percentage of variation (inertia) explained by each dimension is indicated in parentheses. The marginal box plots summarize the distribution of the MCA scores along Dim1 and Dim2 for each cohort or diagnosis group. The central line in each box represents the median of the data, while the hinges of the box indicate the first and third quartiles. (C) Visualizes the variable correlations to the MCA dimensions.
Figure 3.
Figure 3.. Jaccard similarity matrix of phenotypes including all PUMAS cohorts.
Each cell in the matrix corresponds to the Jaccard’s Similarity of two phenotypes, calculated as the proportion of instances where both phenotypes are endorsed relative to the total number of instances where at least one of the phenotypes is endorsed. The gradient scale from light to dark reflects the range of Jaccard Similarity Scores, from 0 (no similarity) to 1 (perfect similarity).
Figure 4.
Figure 4.. Phenotype endorsement by cohort and diagnosis
Colored dots represent phenotypic data availability per cohort.

References

    1. Akingbuwa W. A., Hammerschlag A. R., Bartels M., Nivard M. G. & Middeldorp C. M. Ultra-rare and common genetic variant analysis converge to implicate negative selection and neuronal processes in the aetiology of schizophrenia. Mol. Psychiatry 27, 3699–3707 (2022). - PMC - PubMed
    1. Singh T. et al. Rare coding variants in ten genes confer substantial risk for schizophrenia. Nature 604, 509–516 (2022). - PMC - PubMed
    1. Trubetskoy V. et al. Mapping genomic loci implicates genes and synaptic biology in schizophrenia. Nature 604, 502–508 (2022). - PMC - PubMed
    1. Als T. D. et al. Depression pathophysiology, risk prediction of recurrence and comorbid psychiatric disorders using genome-wide analyses. Nat. Med. 29, 1832–1844 (2023). - PMC - PubMed
    1. O’Connell K. S. et al. Genomics yields biological and phenotypic insights into bipolar disorder. bioRxiv (2023) doi: 10.1101/2023.10.07.23296687. - DOI - PMC - PubMed

Publication types