. 2024 Oct 22:15:1478063.
doi: 10.3389/fimmu.2024.1478063. eCollection 2024.

Acute-phase innate immune responses in SIVmac239-infected Mamu-B*08+ Indian rhesus macaques may contribute to the establishment of elite control

Affiliations

Acute-phase innate immune responses in SIVmac239-infected Mamu-B*08+ Indian rhesus macaques may contribute to the establishment of elite control

Brandon C Rosen et al. Front Immunol. .

Abstract

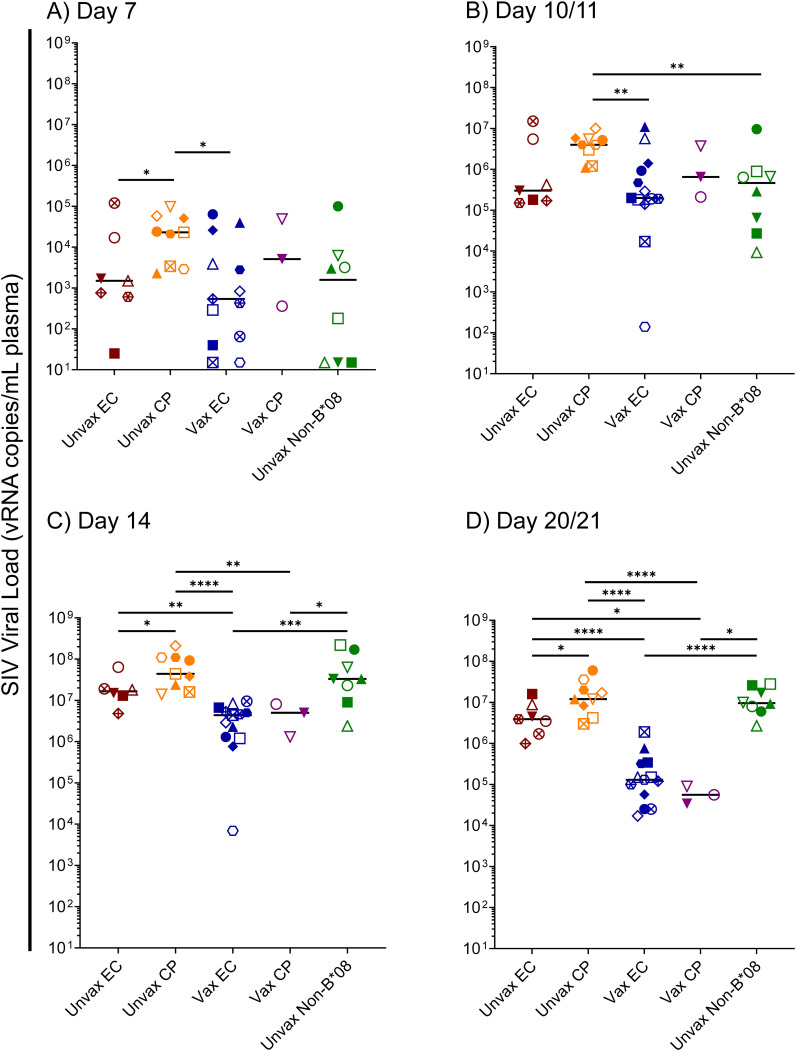
Introduction: Spontaneous control of chronic-phase HIV/SIV viremia is often associated with the expression of specific MHC class I allotypes. HIV/SIV-specific CD8+ cytotoxic T lymphocytes (CTLs) restricted by these MHC class I allotypes appear to be critical for viremic control. Establishment of the elite controller (EC) phenotype is predictable in SIVmac239-infected Indian rhesus macaques (RMs), with approximately 50% of Mamu-B*08+ RMs and 20% of Mamu-B*17+ RMs becoming ECs. Despite extensive characterization of EC-associated CTLs in HIV/SIV-infected individuals, the precise mechanistic basis of elite control remains unknown. Because EC and non-EC viral load trajectories begin diverging by day 14 post-infection, we hypothesized that hyperacute innate immune responses may contribute to viremic control.

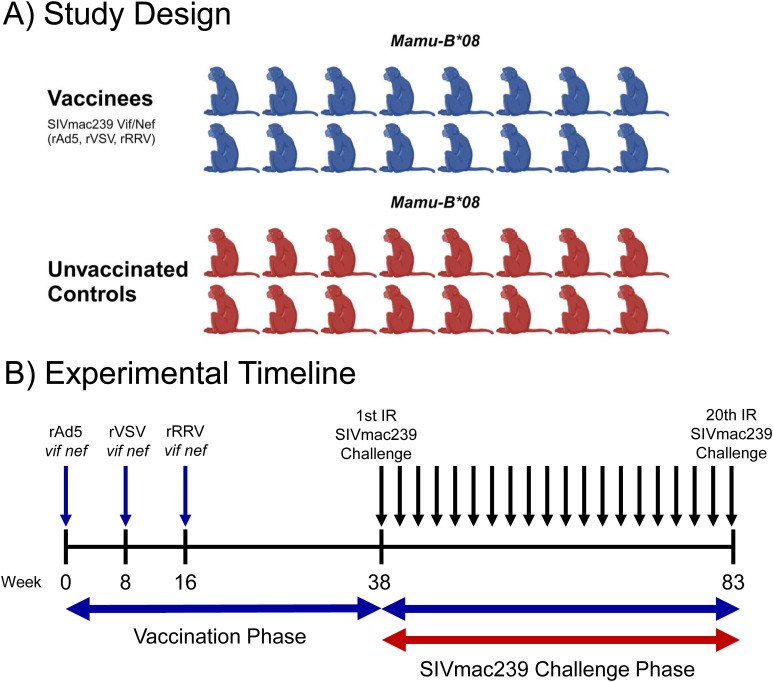
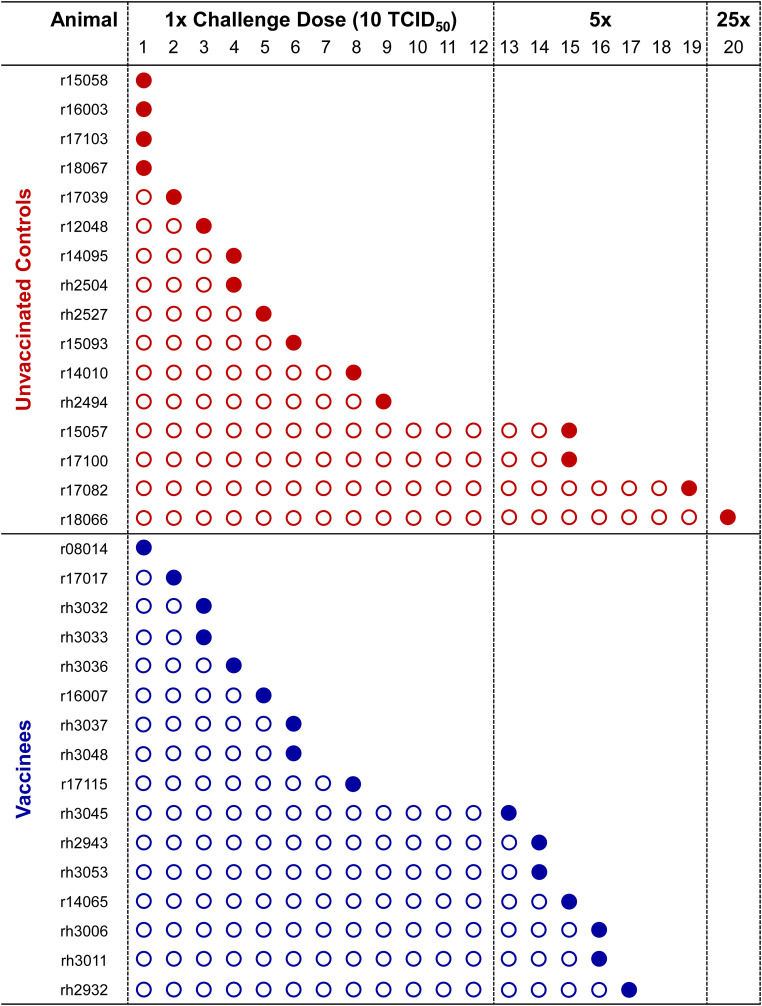
Methods: To gain insight into the immunological factors involved in the determination of EC status, we vaccinated 16 Mamu-B*08+ RMs with Vif and Nef to elicit EC-associated CTLs, then subjected these 16 vaccinees and an additional 16 unvaccinated Mamu-B*08+ controls to repeated intrarectal SIVmac239 challenges. We then performed whole-blood transcriptomic analysis of all 32 SIVmac239-infected Mamu-B*08+ RMs and eight SIVmac239-infected Mamu-B*08 - RMs during the first 14 days of infection.

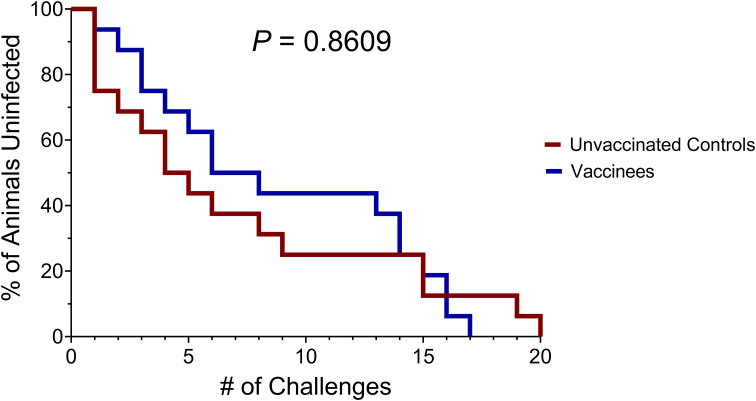
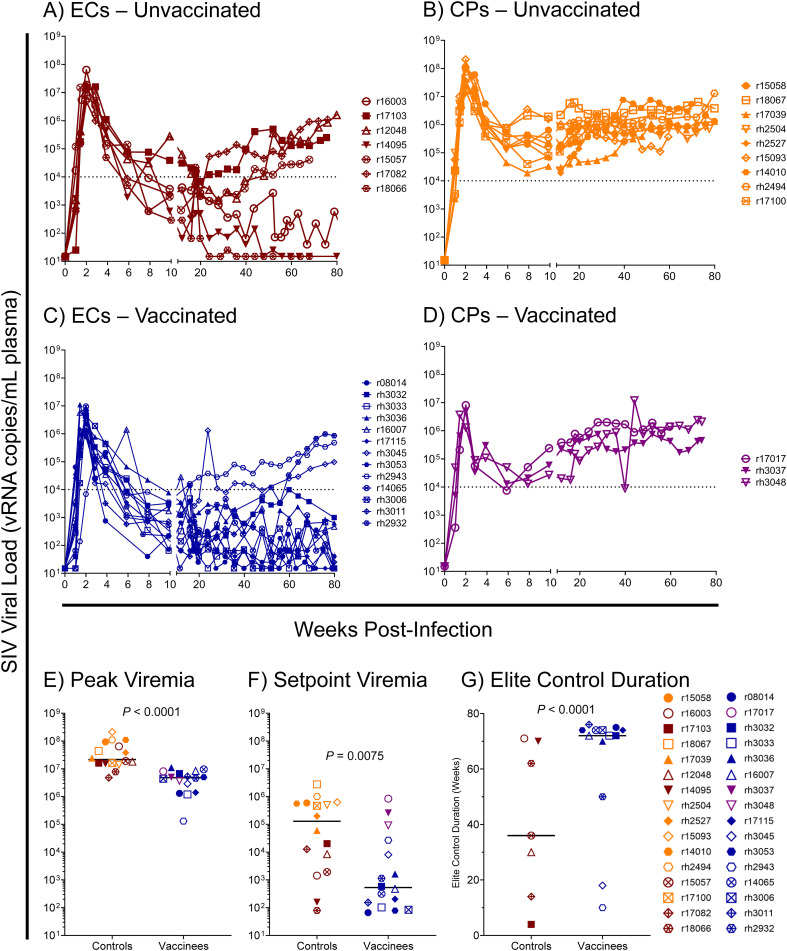
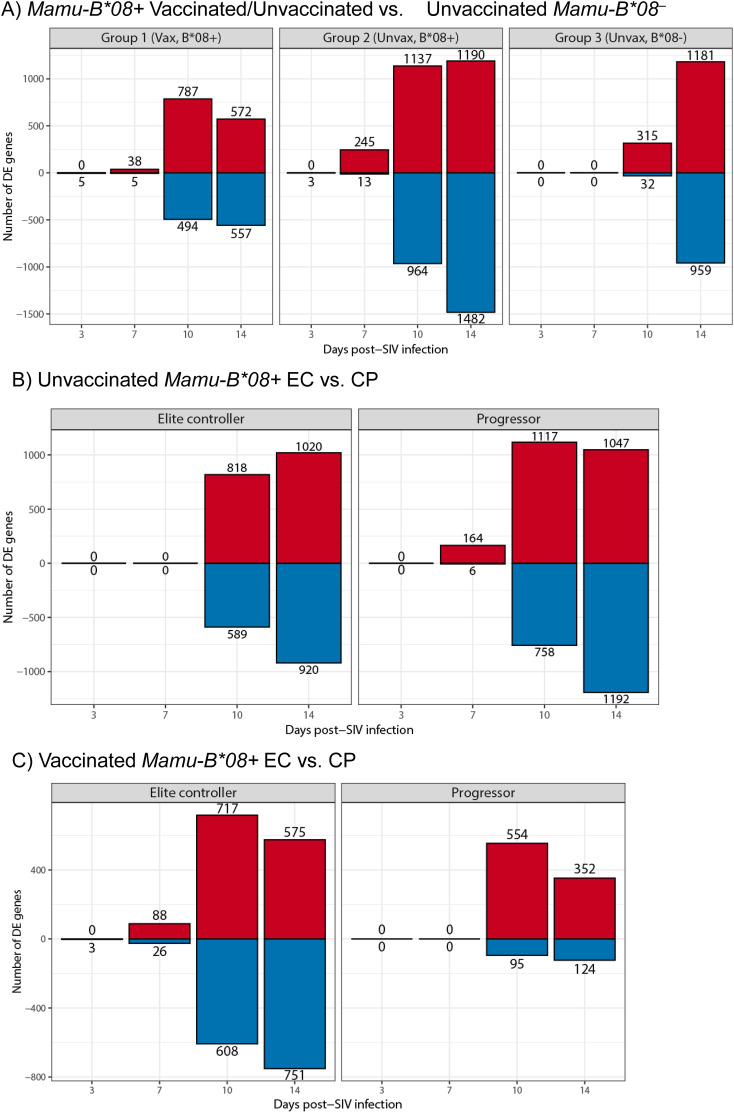
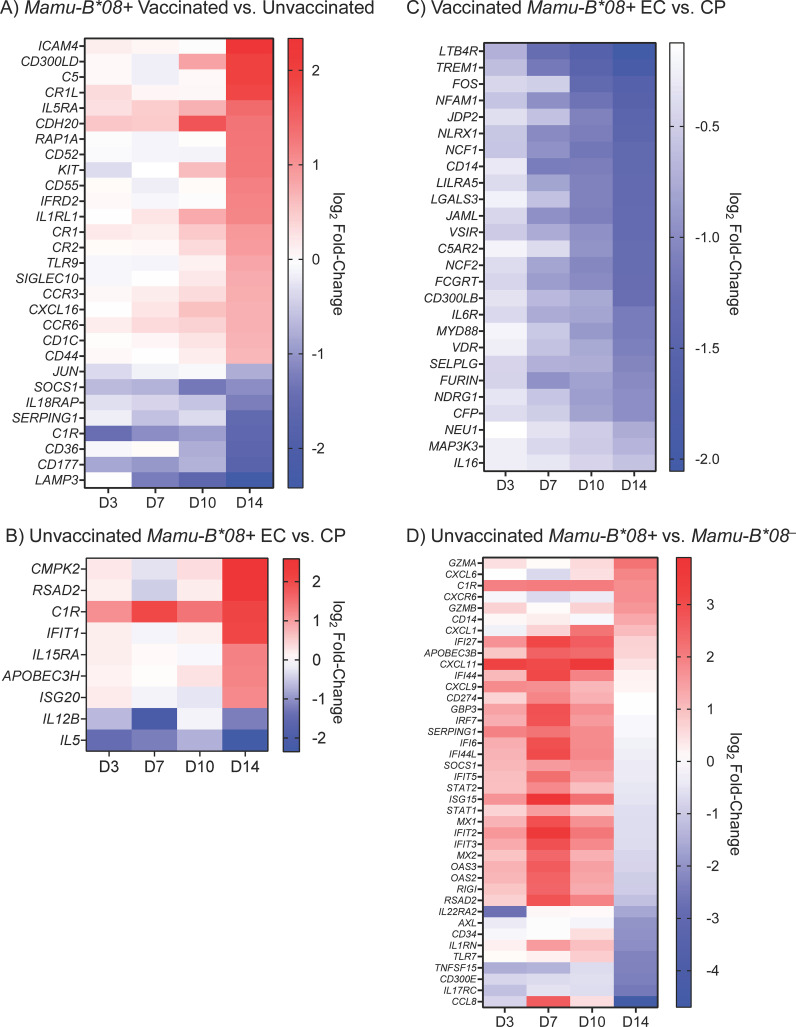
Results: Vaccination did not provide protection against acquisition, but peak and setpoint viremia were significantly lower in vaccinees relative to controls. We did not identify any meaningful correlations between vaccine-induced CTL parameters and SIVmac239 acquisition rate or chronic-phase viral loads. Ultimately, 13 of 16 vaccinees (81%) and 7 of 16 controls (44%) became ECs (viremia ≤ 10,000 vRNA copies/mL plasma for ≥ 4 weeks). We identified subsets of immunomodulatory genes differentially expressed (DE) between RM groupings based on vaccination status, EC status, and MHC class I genotype. These DE genes function in multiple innate immune processes, including the complement system, cytokine/chemokine signaling, pattern recognition receptors, and interferon-mediated responses.

Discussion: A striking difference in the kinetics of differential gene expression among our RM groups suggests that Mamu-B*08-associated elite control is characterized by a robust, rapid innate immune response that quickly resolves. These findings indicate that, despite the association between MHC class I genotype and elite control, innate immune factors in hyperacute SIV infection preceding CTL response development may facilitate the establishment of the EC phenotype.

Keywords: acquired immunodeficiency syndrome (AIDS); cytotoxic T lymphocytes (CTLs); human immunodeficiency virus (HIV); simian immunodeficiency virus (SIV); vaccines.


Conflict of interest statement

The authors declare that the research was conducted in the absence of any commercial or financial relationships that could be construed as a potential conflict of interest.

Figures

Figure 1
Figure 1
Study design and experimental timeline. Thirty-two Mamu-B*08+ RMs were recruited for this study. Animals were distributed into vaccinated (n = 16) and unvaccinated (n = 16) groups of equal size (A). One group was vaccinated with a heterologous prime-boost-boost regimen of different viral vectors encoding vif and nef minigenes as shown in (B). Both groups were then subjected to intrarectal challenges with a marginal infectious dose of SIVmac239 (10 TCID50 for challenges 1-12, 50 TCID50 for challenges 13-19, and 250 TCID50 for challenge 20) once every two weeks. Once an animal became infected, it no longer received additional intrarectal challenges, meaning that most animals received fewer than the maximum 20 challenges. The graphic in panel A was created using BioRender.com.
Figure 2
Figure 2
Frequencies of vaccine-induced, Mamu-B*08-restricted CTLs specific for immunodominant Vif- and Nef-derived CTL epitopes during the vaccination phase. Vaccinee PBMCs were stained with fluorophore-conjugated Mamu-B*08 tetramers presenting the indicated Vif- and Nef-derived CTL epitopes (A–D) at the following timepoints: two weeks post-rAd5 vaccination (“rAd5”), two weeks post-rVSV vaccination (“rVSV”), two weeks post-rRRV vaccination (“rRRV”), at the time of the first SIVmac239 challenge (“TOC 1”), and at the time of the infecting challenge for each animal (“SIV+”). Plots depict frequencies of tetramer+ cells among all CD8+ T cells (defined as live CD3+ CD8+ CD4 CD14 CD20 CD159a lymphocytes). (E) Summative frequencies of the four tetramer+ CTL populations [shown individually in (A–D)] for each vaccinee. Statistical significance testing was performed to assess differences in tetramer frequencies across all timepoints (Friedman test) and to determine whether CTL responses waned during the challenge phase (Wilcoxon test, comparing the “TOC 1” and “SIV+” timepoints). Friedman test P-values were < 0.0001, 0.0006, < 0.0001, 0.0737, and < 0.0001 for panels (A–E) respectively. Wilcoxon test results are shown in each panel: *P < 0.05, **P < 0.01, ***P < 0.001, ****P < 0.0001, ns, not significant.
Figure 3
Figure 3
Phenotypic characterization of vaccine-induced Nef RL10-specific CTLs during the vaccination phase. Vaccinee PBMCs were stained with fluorophore-conjugated Nef RL10-Mamu-B*08 tetramers and fluorophore-conjugated mAbs to assess the following CTL phenotypic characteristics: (A) frequencies of granzyme B+ CTLs, (B) frequencies of Ki-67+ CTLs, and (C) frequencies of terminally-differentiated effector memory (TEM2) CTLs, defined as CD28 CCR7 CTLs. PBMCs from the following timepoints were analyzed: two weeks post-rAd5 vaccination (“rAd5”), two weeks post-rVSV vaccination (“rVSV”), two weeks post-rRRV vaccination (“rRRV”), at the time of the first SIVmac239 challenge (“TOC 1”), and retrospectively at the time of the infecting challenge for a given animal (“SIV+”). Plots depict frequencies of Nef RL10-Mamu-B*08 tetramer+ CD8+ T cells (defined as live tetramer+ CD3+ CD8+ CD4 CD14 CD20 CD159a lymphocytes) meeting the staining criteria for each phenotypic characteristic. Statistical significance testing was performed to assess differences in Nef RL10-specific CTL phenotypic characteristics across all timepoints (Friedman test) and to determine whether these phenotypic characteristics changed during the challenge phase (Wilcoxon test, comparing the “TOC 1” and “SIV+” timepoints). Friedman test P-values were < 0.0001, < 0.0001, and 0.02073 for panels (A-C) respectively. Wilcoxon test results are shown in each panel: *P < 0.05, **P < 0.01.
Figure 4
Figure 4
Frequencies of total responding and polyfunctional Vif- and Nef-specific CTLs at the time of the first SIVmac239 challenge. The antigen responsiveness and effector function profiles of Vif- and Nef-specific CTLs within vaccinee PBMCs were assayed by CD107a degranulation assay with intracellular cytokine staining (CD107a/ICS) at the time of the first SIVmac239 challenge. (A) Frequencies of CD8+ T cells mounting responses to the indicated peptide stimuli; (B) frequencies of polyfunctional CD8+ T cells among all CD8+ T cells responding to each stimulus. Responding CD8+ T cells were defined as CD69+ CD3+ CD8+ CD4 CD14 CD20 CD159a lymphocytes staining positive for CD107a, IFN-γ, or TNF-α. Polyfunctional CD8+ T cells were defined as CD69+ CD3+ CD8+ CD4 CD14 CD20 CD159a lymphocytes staining positive for all three effector function markers (CD107a, IFN-γ, and TNF-α) simultaneously.
Figure 5
Figure 5
Kinetics of SIVmac239 acquisition in vaccinated and unvaccinated Mamu-B*08+ RMs. All 32 Mamu-B*08+ RMs were subjected to intrarectal challenges with a marginal infectious dose of SIVmac239 approximately once every two weeks. Infecting and noninfecting challenges are indicated by filled and open circles, respectively. Establishment of SIVmac239 infection was defined by detectable SIV plasma viral loads at day 7 and/or day 10 post-challenge, and animals meeting these criteria were not re-challenged. The intrarectal challenge dose was increased fivefold to 50 TCID50 on the 13th challenge, then again increased fivefold to 250 TCID50 on the 20th challenge.
Figure 6
Figure 6
Survival analysis of SIVmac239 acquisition in challenged vaccinated and unvaccinated Mamu-B*08+ RMs. The P-value of 0.8609 was computed using the log-rank/Mantel-Cox test.
Figure 7
Figure 7
SIVmac239 viral loads in vaccinated and unvaccinated Mamu-B*08+ RMs. Longitudinal SIVmac239 plasma viral loads for all Mamu-B*08+ RMs in this study. Animals are grouped based on vaccination status and chronic-phase viremia status (elite controller [EC] or common progressor [CP]): (A) unvaccinated ECs, (B) unvaccinated CPs, (C) vaccinated ECs, and (D) vaccinated CPs. Comparison of (E) peak viremia and (F) setpoint viremia in vaccinated and unvaccinated Mamu-B*08+ RMs by the Mann-Whitney test. Peak viremia was defined as the highest viral load measurement at any timepoint; setpoint viremia was defined as the geometric mean of all viral load measurements between weeks 10 and 40 post-infection. (G) Comparison of the duration of elite control in vaccinated and unvaccinated Mamu-B*08+ RMs classified as ECs by the Mann-Whitney test. Elite control duration was defined as the number of consecutive weeks an animal maintained viral loads ≤ 10,000 vRNA copies/mL plasma.
Figure 8
Figure 8
Kinetics of acute-phase SIVmac239 viremia in Mamu-B*08+ RMs and Mamu-B*08 RMs. Comparison of SIVmac239 plasma viral loads in various Mamu-B*08+ RM groupings (unvaccinated EC, unvaccinated CP, vaccinated EC, vaccinated CP) and unvaccinated Mamu-B*08 RMs at the indicated acute-phase timepoints: (A) day 7, (B) day 10/11, (C) day 14, and (D) day 21. Statistically significant differences in viremia were identified using the Mann-Whitney test (*P < 0.05, **P < 0.01, ***P < 0.001, ****P < 0.0001). All other pairwise group comparisons did not yield statistically significant P-values. Possible multiple testing error was assessed by the Kruskal-Wallis test; P-values were 0.1046, 0.0385, < 0.0001, and < 0.0001 for the day 7, day 10/11, day 14, and day 21 timepoints, respectively, indicating that the differences observed for the day 7 timepoint are likely not statistically significant.
Figure 9
Figure 9
Differential gene expression during acute SIVmac239 infection of RMs. Bar plots of differentially expressed genes relative to day 0 baseline (blood draw prior to SIVmac239 challenge later in day) in (A) vaccinated Mamu-B*08+ RMs, unvaccinated Mamu-B*08+ RMs, and unvaccinated Mamu-B*08 RMs, (B) unvaccinated Mamu-B*08+ ECs and CPs, and (C) vaccinated Mamu-B*08+ ECs and CPs. Red indicates upregulated genes; blue indicates downregulated genes.
Figure 10
Figure 10
Differentially expressed immunomodulatory genes in vaccinated, unvaccinated, Mamu-B*08+, and Mamu-B*08 RMs during acute SIVmac239 infection. Heat maps depict selected differentially expressed immunomodulatory genes during the first 14 days of SIVmac239 infection in (A) vaccinated Mamu-B*08+ RMs and unvaccinated Mamu-B*08+ RMs, (B) unvaccinated Mamu-B*08+ ECs and unvaccinated Mamu-B*08+ CPs, (C) vaccinated Mamu-B*08+ ECs and vaccinated Mamu-B*08+ CPs, and (D) unvaccinated Mamu-B*08+ RMs and unvaccinated Mamu-B*08 RMs. Differential expression criteria for the genes shown in (A, C) were a statistically significant adjusted P-value (P < 0.05) and |log2 fold-change| ≥ 1.5 for at least one of the four timepoints shown. Differential expression criteria for the genes shown in (B, D) were a statistically significant non-adjusted P-value (P < 0.05) and |log2 fold-change| ≥ 1.5 for at least one of the four timepoints shown. Red indicates upregulated genes; blue indicates downregulated genes.

References

    1. Walker BD, Chakrabarti S, Moss B, Paradis TJ, Flynn T, Durno AG, et al. . HIV-specific cytotoxic T lymphocytes in seropositive individuals. Nature. (1988) 328:345–8. doi: 10.1038/328345a0 - DOI - PubMed
    1. Koup RA, Safrit JT, Cao Y, Andrews CA, McLeod G, Borkowsky W, et al. . Temporal association of cellular immune responses with the initial control of viremia in primary human immunodeficiency virus type 1 syndrome. J Virol. (1994) 68:4650–5. doi: 10.1128/jvi.68.7.4650-4655.1994 - DOI - PMC - PubMed
    1. Borrow P, Lewicki H, Hahn BH, Shaw GM, Oldstone MB. Virus-specific CD8+ cytotoxic T-lymphocyte activity associated with control of viremia in primary human immunodeficiency virus type 1 infection. J Virol. (1994) 68:6103–10. doi: 10.1128/jvi.68.9.6103-6110.1994 - DOI - PMC - PubMed
    1. Goonetilleke N, Liu MKP, Salazar-Gonzalez JF, Ferrari G, Giorgi E, Ganusov VV, et al. . The first T cell response to transmitted/founder virus contributes to the control of acute viremia in HIV-1 infection. J Exp Med. (2009) 206:1253–72. doi: 10.1084/jem.20090365 - DOI - PMC - PubMed
    1. Kaslow RA, Carrington M, Apple R, Park L, Munoz A, Saah AJ, et al. . Influence of combinations of human major histocompatibility complex genes on the course of HIV-1 infection. Nat Med. (1996) 2:405–11. doi: 10.1038/nm0496-405 - DOI - PubMed

MeSH terms

Substances