Multicenter Study
. 2024 Nov;35(11):e14274.
doi: 10.1111/pai.14274.

Association between nasopharyngeal airway lipidome signatures of infants with severe bronchiolitis and risk of recurrent wheeze: A prospective multicenter cohort study

Affiliations
Multicenter Study

Association between nasopharyngeal airway lipidome signatures of infants with severe bronchiolitis and risk of recurrent wheeze: A prospective multicenter cohort study

Hideaki Miyachi et al. Pediatr Allergy Immunol. 2024 Nov.

Abstract

Background: Infants hospitalized for bronchiolitis are at high risk for developing recurrent wheeze in childhood. The role of airway lipids in the link between these two conditions remains unclear. This study aimed to identify the association between airway lipids in infants hospitalized for bronchiolitis and the development of recurrent wheeze, with a focus on immunoglobulin E (IgE) sensitization.

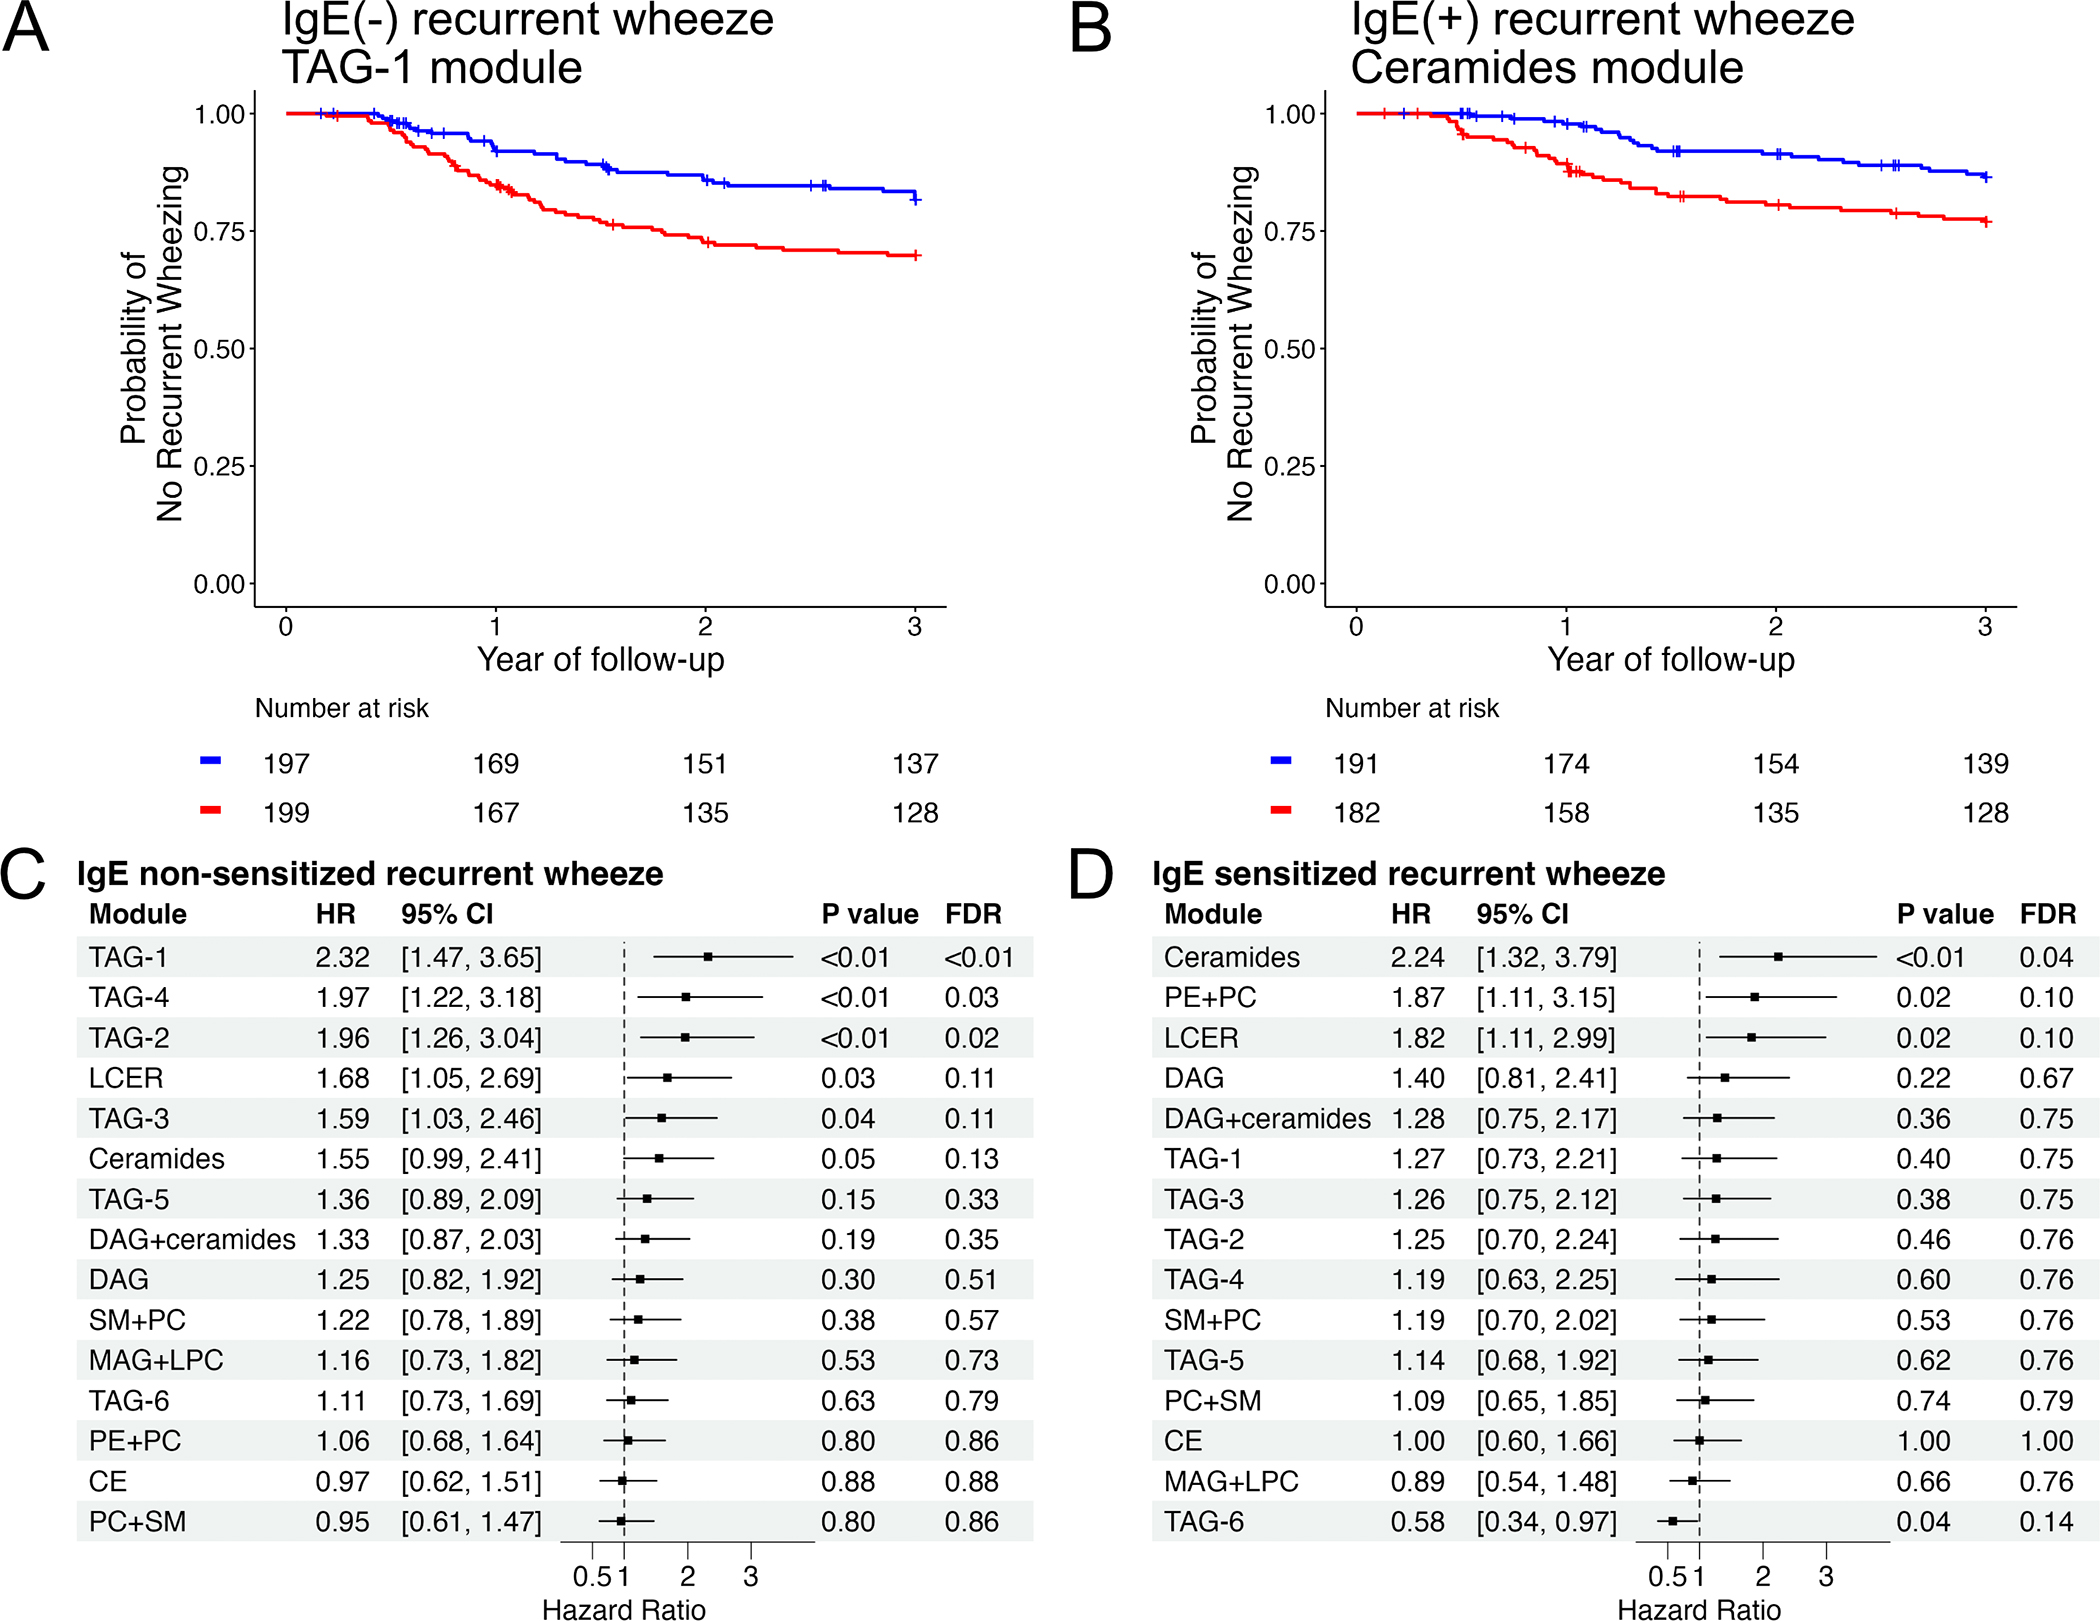
Methods: In a multicenter prospective cohort study of 919 infants (age <1 year) hospitalized for bronchiolitis, we performed lipidomic profiling of nasopharyngeal airway specimens collected at hospitalization. We first identified lipid modules composed of highly correlated lipids by performing weighted correlation network analysis. We then examined the longitudinal association of those lipid modules with the rate of recurrent wheeze by age 3 years after discharge from hospitalization for bronchiolitis. We also examined the associations of lipid modules with IgE non-sensitized (i.e., neither sensitized at admission nor at age 3 years) and IgE-sensitized (i.e., sensitized at admission and/or at age 3 years) recurrent wheeze by age 3 years, respectively.

Results: Our analysis identified 15 distinct lipid modules in the nasopharyngeal airway lipidome data. Overall, lipid modules composed of triacylglycerols (hazard ratio [HR] 1.78, 95% confidence interval [CI] 1.26-2.51, FDR < 0.01) and sphingolipids (HR 1.74, 95% CI 1.25-2.44, FDR <0.01) had the strongest associations with recurrent wheeze development. Stratification by IgE sensitization revealed differential associations. For example, the module composed of triacylglycerols was significantly associated with IgE non-sensitized recurrent wheeze, whereas the module composed of sphingolipids was significantly associated with IgE-sensitized recurrent wheeze (both FDR <0.05).

Conclusion: Distinct nasopharyngeal airway lipid modules are associated with recurrent wheeze development following severe bronchiolitis, with different patterns based on IgE sensitization status.

Keywords: airway; bronchiolitis; immunoglobulin E; infants; lipidomics; wheezing.


Conflict of interest statement

Conflict of interest statement: The authors have indicated that they have no financial relationships relevant to this article to disclose.

Figures

Figure 1.
Figure 1.. Analytic workflow
Nasopharyngeal airway lipidomics data in a multicenter prospective cohort study of infants hospitalized for bronchiolitis. First, we processed the nasopharyngeal airway lipidome data by removing samples missing measurements for more than certain number of lipid species, imputing missing values, removing near-zero variance lipids, and performed normalization. Second, we used Weighted Correlation Network Analysis to identify highly correlated lipid modules. Third, we analyzed the association between each lipid module and the rate of developing recurrent wheeze (time-to-event-outcome) with Kaplan-Meier curve and estimated by fitting Cox proportional hazards models. Lastly, to provide mechanistic insights by examining the association between lipid modules and nasopharyngeal transcriptome, we performed differential gene expression analysis and pathway analysis.
Figure 2.
Figure 2.. Weighted Correlation Network Analysis (WGCNA) applied to nasopharyngeal airway lipid data from infants hospitalized for bronchiolitis
(A) Analysis of network topology for various soft-thresholding powers. The left panel shows the scale-free fit index (y-axis) as a function of soft-thresholding power (x-axis). The right panel shows the mean connectivity (y-axis) as a function of soft-thresholding power (x-axis). Based on the plots, a soft-thresholding power of 12 was selected for our analysis. (B) Cluster dendrogram of lipid modules identified by WGCNA. The dendrogram shows hierarchical clustering of lipids based on the topological overlap matrix. Identified lipid modules are color-coded on the branches, with each color representing a distinct module of highly interconnected lipids. (C) Association of lipid modules with clinical outcomes. Each row represents a lipid module, and each column represents a clinical trait. Lipid modules are named based on the lipid classes that characterizes the module, with the color codes in the cluster dendrogram displayed alongside the module names. The correlations were analyzed for infants in the lowest and highest quartiles for each lipid module’s eigenvalue. The color gradient from red to blue indicates the Spearman correlation coefficients, with red representing positive correlations and blue representing negative correlations. The size of the dots denotes the magnitude of the correlations. *FDR<0.05, **FDR<0.01, ***FDR<0.001. CE, cholesteryl ester; DAG, diacylglycerol; LCER, lactosylceramide; LPC, lysophosphatidylcholine; MAG, monoacylglycerol; PC, phosphatidylcholine; PE, phosphatidylethanolamine; SM, sphingomyelin, TAG, triacylglycerol.
Figure 3.
Figure 3.. Time to event analysis for overall recurrent wheeze in infants hospitalized for bronchiolitis
(A) Kaplan-Meier curves of overall recurrent wheeze for TAG-1 module. Infants were divided into four groups based on quartiles of the TAG-1 module eigenvalues. The lowest (blue) and highest (red) quartiles are shown for comparison in the figure (log-rank P value=0.02). (B) Kaplan-Meier curves of overall recurrent wheeze for Ceramides module. Infants were divided into four groups based on quartiles of the Ceramides module eigenvalues. The lowest (blue) and highest (red) quartiles are shown for comparison in the figure (log-rank P value=0.008) (C) Forest plot displaying the hazard ratios (HRs) and 95% confidence intervals (CIs) for the association between each lipid module and the risk of overall recurrent wheeze. For each lipid module, infants were divided into quartiles based on the lipid module’s eigenvalues, with the lowest quartile used as the reference. The model was adjusted for potential confounders (age, sex, parental history of asthma, previous breathing problems, RSV infection) and accounted for between-hospital difference by including the sites as random effect. Only the highest quartile is displayed in the forest plot. The x-axis represents the HR. The vertical dotted line at HR=1 indicates no effect. Each point represents the HR for a specific lipid module, with horizontal lines indicating the 95% CI. P value and FDR are also displayed for each lipid module. CE, cholesteryl ester; DAG, diacylglycerol; FDR, false discovery rate; IgE, immunoglobulin E; LCER, lactosylceramide; LPC, lysophosphatidylcholine; MAG, monoacylglycerol; PC, phosphatidylcholine; PE, phosphatidylethanolamine; SM, sphingomyelin, TAG, triacylglycerol; WGCNA, Weighted Correlation Network Analysis.
Figure 4.
Figure 4.. Time to event analysis for IgE non-sensitized and IgE sensitized recurrent wheeze in infants hospitalized for bronchiolitis
(A) Kaplan-Meier curve of IgE non-sensitized recurrent wheeze. Infants were divided into four groups based on quartiles of the TAG-1 module eigenvalues. The lowest (blue) and highest (red) quartiles are shown for comparison in the figure (log-rank P value=0.005). (B) Kaplan-Meier curve of IgE sensitized recurrent wheeze. Infants were divided into four groups based on quartiles of the Ceramides module eigenvalues. The lowest (blue) and highest (red) quartiles are shown for comparison in the figure (log-rank P value=0.01). (C) Forest plot for IgE non-sensitized recurrent wheeze. (D) Forest plot for IgE sensitized recurrent wheeze. Forest plots display the hazard ratios (HRs) and 95% confidence intervals (CIs) for the association between each lipid modules and the risk of IgE non-sensitized or IgE sensitized recurrent wheeze. For each lipid module, infants were divided into quartiles based on the lipid module’s eigenvalues, with the lowest quartile used as the reference. The model was adjusted for potential confounders (age, sex, parental history of asthma, previous breathing problems, RSV infection) and accounted for between-hospital difference by including the sites as random effect Only the highest quartile is displayed in the forest plot. The x-axis represents the HR. The vertical dotted line at HR=1 indicates no effect. Each point represents the HR for a specific module, with horizontal lines indicating the 95% CI. P value and FDR are also displayed for each lipid module. CE, cholesteryl ester; DAG, diacylglycerol; FDR, false discovery rate; IgE, immunoglobulin E; LCER, lactosylceramide; LPC, lysophosphatidylcholine; MAG, monoacylglycerol; PC, phosphatidylcholine; PE, phosphatidylethanolamine; SM, sphingomyelin, TAG, triacylglycerol.
Figure 5.
Figure 5.. Association of lipid modules with nasopharyngeal airway transcriptome in infants hospitalized for bronchiolitis
(A, B) Differential gene expression analysis of nasopharyngeal airway transcriptome in infants hospitalized for bronchiolitis regarding selected lipid modules. Volcano plots show difference in the mRNA expression levels between infants with lowest and highest quartiles of (A) TAG-1 module eigenvalues and (B) Ceramides module eigenvalues. The DEmRNAs, marked by colored dots, meet the threshold of both FDR<0.05 (horizontal dotted line) and |log2 FC|≥1 (vertical dotted lines). Red dots indicate upregulated DEmRNAs and blue dots indicate downregulated DEmRNAs. Gene symbols of the top 20 DEmRNAs (according to FDR value) are displayed in each volcano plot. (C, D) GSEA of nasopharyngeal airway transcriptome in infants hospitalized for bronchiolitis using the 50 hallmark gene sets in Molecular Signatures Database (MSigDB). The 20 hallmark pathways with the highest absolute value of normalized enrichment score in the GSEA for (C) TAG-1 module and (D) Ceramides module are shown. Bar colors represent FDR<0.05 (green) or FDR≥0.05 (orange). DEmRNA, differentially expressed mRNA; FC, fold change; FDR, false discovery rate; GSEA, gene set enrichment analysis.

References

    1. Wolters AAB, Kersten ETG, Koppelman GH. Genetics of preschool wheeze and its progression to childhood asthma. Pediatr Allergy Immunol. 2024;35(1):e14067. - PubMed
    1. Fujiogi M, Goto T, Yasunaga H, et al. Trends in Bronchiolitis Hospitalizations in the United States: 2000–2016. Pediatrics. 2019;144(6):e20192614. - PMC - PubMed
    1. Kusel MM, de Klerk NH, Kebadze T, et al. Early-life respiratory viral infections, atopic sensitization, and risk of subsequent development of persistent asthma. J Allergy Clin Immunol. 2007;119(5):1105–1110. - PMC - PubMed
    1. Bacharier LB, Cohen R, Schweiger T, et al. Determinants of asthma after severe respiratory syncytial virus bronchiolitis. J Allergy Clin Immunol. 2012;130(1):91–100 e103. - PMC - PubMed
    1. Marlow R, Finn A, Henderson J. Assessing the association between bronchiolitis in infancy and recurrent wheeze: a whole English birth cohort case-control study. Thorax. 2019;74(5):503–505. - PubMed

Publication types

LinkOut - more resources