. 2024 Nov 20;146(46):31529-31537.
doi: 10.1021/jacs.4c08919. Epub 2024 Nov 6.

Enzyme-Responsive DNA Condensates

Affiliations

Enzyme-Responsive DNA Condensates

Juliette Bucci et al. J Am Chem Soc. .

Abstract

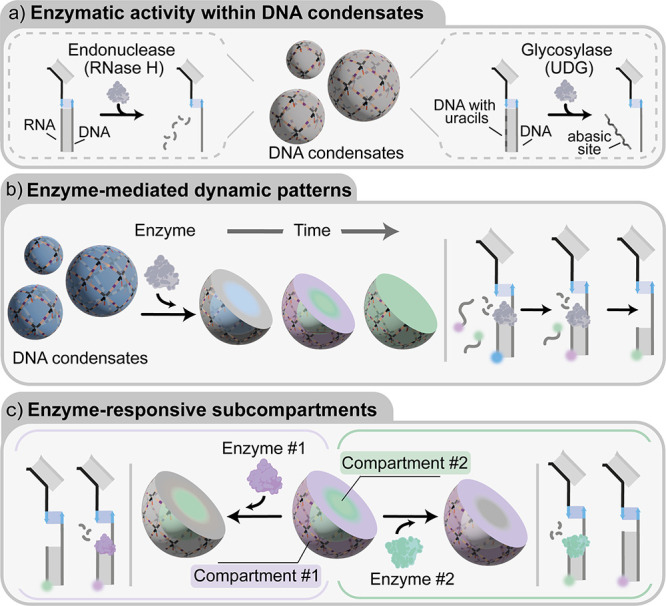
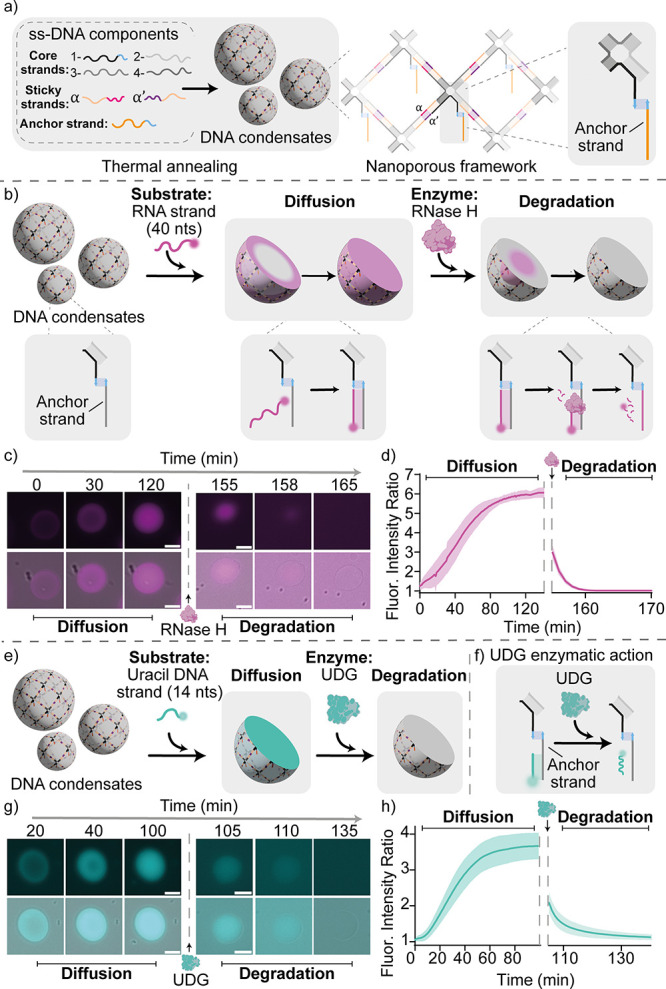
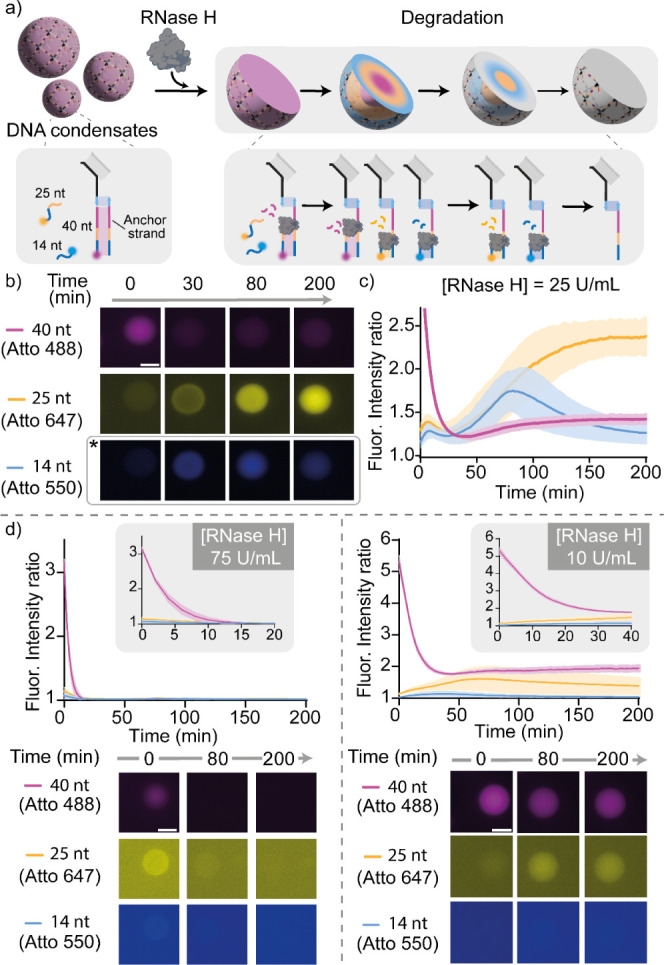
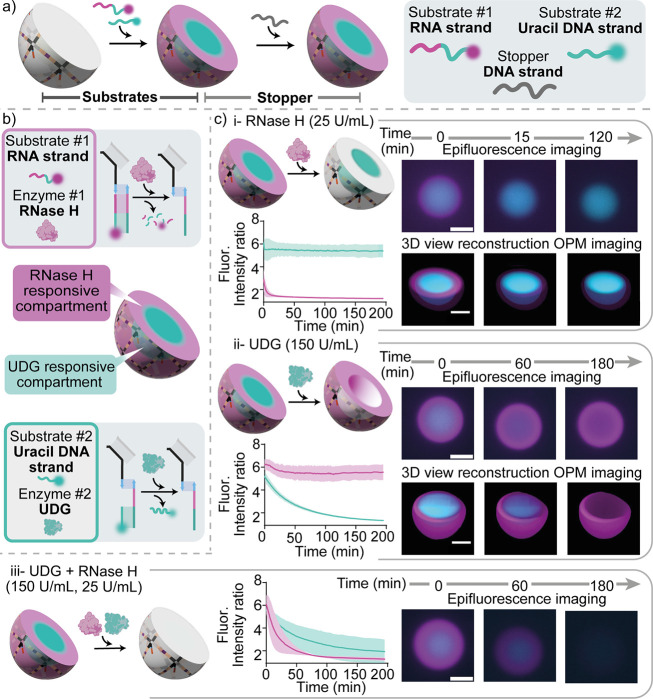
Membrane-less compartments and organelles are widely acknowledged for their role in regulating cellular processes, and there is an urgent need to harness their full potential as both structural and functional elements of synthetic cells. Despite rapid progress, synthetically recapitulating the nonequilibrium, spatially distributed responses of natural membrane-less organelles remains elusive. Here, we demonstrate that the activity of nucleic-acid cleaving enzymes can be localized within DNA-based membrane-less compartments by sequestering the respective DNA or RNA substrates. Reaction-diffusion processes lead to complex nonequilibrium patterns, dependent on enzyme concentration. By arresting similar dynamic patterns, we spatially organize different substrates in concentric subcompartments, which can be then selectively addressed by different enzymes, demonstrating spatial distribution of enzymatic activity. Besides expanding our ability to engineer advanced biomimetic functions in synthetic membrane-less organelles, our results may facilitate the deployment of DNA-based condensates as microbioreactors or platforms for the detection and quantitation of enzymes and nucleic acids.


Conflict of interest statement

The authors declare no competing financial interest.

Figures

Figure 1
Figure 1
Enzyme-responsive DNA condensates. a) Schematic representations exemplifying the endonuclease and glycosylase activity that can be localized in DNA condensates. b) Schematic representation of enzyme-mediated dynamic patterning of DNA condensates. When added, an enzyme digests nucleic acid substrates bound to the condensates. Digested substrates can be replaced by fresh strands present in solution, producing reaction-diffusion patterns dependent on enzymatic activity, the diffusivity and binding strength of multiple, coexisting substrates. c) Schematic representation of DNA condensates with two concentric subcompartments each containing a different enzymatic substrate, allowing enzymatic reactions to occur only within the predetermined subcompartments.
Figure 2
Figure 2
Enzyme-responsive DNA condensates. a) Nanoporous DNA condensates, hosting homogeneously distributed anchor strands, are obtained through slow thermal annealing, from 90 to 20 °C, of the ssDNA components. Full details on nanostructure design and oligonucleotide sequences are reported in the SI (Figure S1). b) Cartoons and reaction schemes illustrating the diffusion and binding of a fluorophore-labeled RNA substrate within a DNA condensate, and its subsequent enzymatic degradation by RNase H. c) Epifluorescence micrographs (top) overlaid with bright-field images (bottom) of the diffusion, binding, and degradation process over time. d) Diffusion/binding and degradation kinetics tracked via the ratio of fluorescent signal samples within the condensates and the surrounding background. Data are shown as mean (solid line) ± standard deviation as obtained analyzing n = 352/219 condensates (diffusion stage/degradation stage, respectively) imaged across 3 technical replicates. e, f) Cartoons and reactions schemes illustrating the diffusion and binding of a fluorophore-labeled uracil DNA substrate and its degradation by UDG. g) Epifluorescence micrographs (top) overlaid with bright-field images (bottom) of the diffusion, binding, and degradation process over time. h) Diffusion/binding and degradation kinetics tracked via fluorescence intensity as for panel d. Data are shown as mean (solid line) ± standard deviation as obtained analyzing n = 807/155 condensates (diffusion stage/degradation stage, respectively) imaged across 12/3 technical replicates (diffusion stage/degradation stage, respectively). Experiments were performed in Tris HCl 20 mM, EDTA 1 mM, MgCl2 10 mM and 0.05 M NaCl; pH 8.0 at T = 30 °C. Sample preparation, annealing process and image analysis details are provided in SI Methods. All scale bars are 10 μm.
Figure 3
Figure 3
RNase H dynamic compartmentalization. a) Cartoons and reaction schemes illustrating an expected degradation pattern induced by RNase H in the presence of three RNA substrate strands of different lengths (each labeled with a different fluorophore) competing for the anchor strand. b) Epifluorescence micrographs demonstrating the time-evolution of a typical condensate in a sample containing RNase H (25 U/mL) and the three RNA substrate strands (each at 200 nM). For the Atto 550 channel, epifluorescence micrographs are reported with enhanced contrast for better visualization (marked with *). c) Ratio between the fluorescence intensity recorded within the condensate and the surrounding background for the three fluorescent constructs in samples corresponding to the experiment in panel b. Data are shown as mean (solid line) ± standard deviation as obtained analyzing n = 195 condensates imaged across 3 technical replicates. d) Top: Ratio between the fluorescence intensity recorded within the condensate and the surrounding background for the three fluorescent constructs. Insets highlight early time scales. Bottom: respective epifluorescence micrographs at different times obtained using a fixed concentration of RNA strands (200 nM) and two different RNase H concentrations: 75 U/ml (left) and 10 U/mL (right). Data are shown as mean (solid line) ± standard deviation as obtained analyzing n = 128/222 condensates (RNase H 75 U/mL and 10 U/mL, respectively) imaged across 3 technical replicates. Experiments were performed in Tris HCl 20 mM, EDTA 1 mM, MgCl2 10 mM and 0.05 M NaCl; pH 8.0 at T = 30 °C. Sample preparation, annealing process and image analysis details are provided in SI methods. All scale bars are 10 μm.
Figure 4
Figure 4
RNase H and UDG responsive compartments in DNA condensates. a) Cartoon illustrating the formation of membrane-less compartments in DNA condensates. The two substrate strands, namely the uracil DNA strand (25 nt, Atto 488 labeled, cyan) and the RNA strand (40nt, Atto 647 labeled, magenta), establish a core–shell pattern within the DNA condensates through a reaction-diffusion process. Adding an excess of the stopper strand arrests pattern propagation by sequestering unbound substrate strands, resulting in the formation of two stable, concentric membrane-less compartments enriched in the two different substrates. b) Cartoons illustrating the two responsive compartments in a DNA condensate: an external one (magenta) hosting the substrate of RNase H and an internal one (cyan) containing the substrate of UDG. c) Epifluorescence micrographs (top right), 3D reconstructions obtained from Oblique Plane Microscopy (bottom right) and fluorescence intensity kinetics (left, as sampled with epifluorescence) demonstrating localized, orthogonal and specific enzymatic activity within the condensates, by adding RNase H only (i), UDG only (ii) or both enzymes (iii). RNase H and UDG concentrations were fixed at 25 U/mL and 150 U/mL, respectively. RNA and uracil DNA substrates were fluorescently labeled with Atto 647 and Atto 488, respectively. Data are shown as mean (solid line) ± standard deviation as obtained analyzing n = 115/93/91 condensates (respectively i, ii, and iii) images across 3 technical replicates. Note that the subcompartments established within the condensates do not change morphology over time, confirming that the condensates are in a solid phase and internal diffusion of the DNA nanostars (and anchor strands connected to them) does not occur over relevant experimental time scales. Experiments were performed in Tris HCl 20 mM, EDTA 1 mM, MgCl2 10 mM and 0.05 M NaCl; pH 8.0 at T = 30 °C. Sample preparation, annealing process and image analysis details are provided in the SI Methods. All scale bars are 10 μm.

References

    1. Yewdall A. N.; Mason A. F.; van Hest J. C. M. The hallmarks of living systems: towards creating artificial cells. Interface Focus 2018, 8, 20180023.10.1098/rsfs.2018.0023. - DOI - PMC - PubMed
    1. Mistriotis A. A universal model describing the structure and functions of living systems. Commun. Integr Biol. 2021, 14, 27–36. 10.1080/19420889.2021.1887549. - DOI - PMC - PubMed
    1. Buddingh B. C.; van Hest J. C. M. Artificial Cells: Synthetic Compartments with Life-like Functionality and Adaptivity. Acc. Chem. Res. 2017, 50, 769–777. 10.1021/acs.accounts.6b00512. - DOI - PMC - PubMed
    1. O’Flynn B. G.; Mittag T. The role of liquid-liquid phase separation in regulating enzyme activity. Curr. Opin. Cell Biol. 2021, 69, 70–79. 10.1016/j.ceb.2020.12.012. - DOI - PMC - PubMed
    1. Bar-Peled L.; Kory N. Principles and functions of metabolic compartmentalization. Nat. Metab. 2022, 4, 1232–1244. 10.1038/s42255-022-00645-2. - DOI - PMC - PubMed

LinkOut - more resources