Multicenter Study
. 2025 Jan;66(1):195-206.
doi: 10.1111/epi.18145. Epub 2024 Nov 6.

Imaging blood-brain barrier dysfunction in drug-resistant epilepsy: A multi-center feasibility study

Affiliations
Multicenter Study

Imaging blood-brain barrier dysfunction in drug-resistant epilepsy: A multi-center feasibility study

Nir Cafri et al. Epilepsia. 2025 Jan.

Abstract

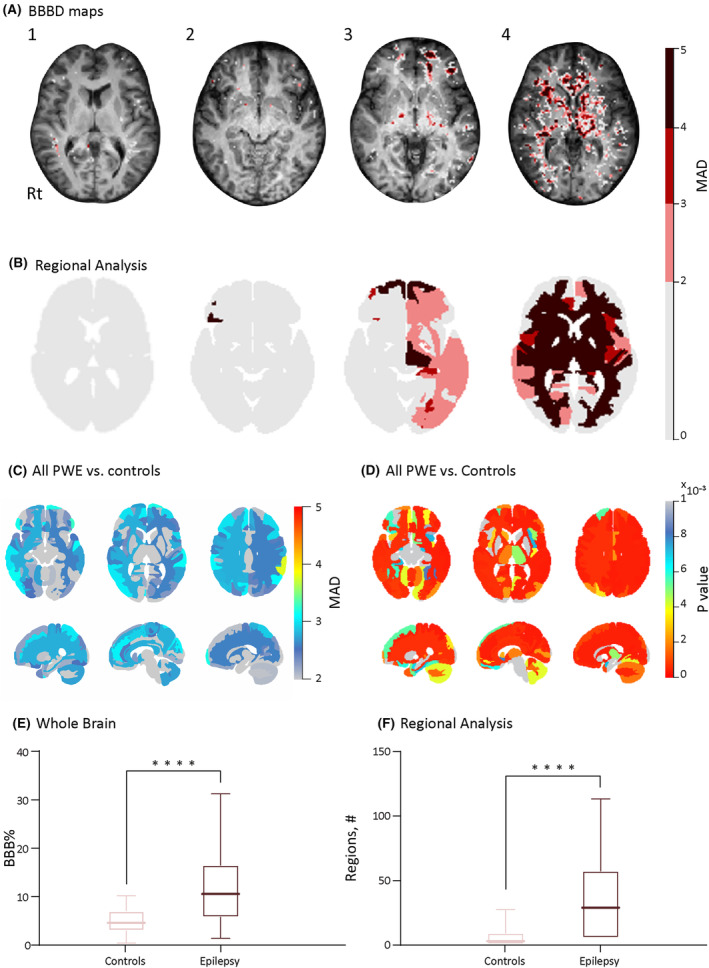
Objective: Blood-brain barrier dysfunction (BBBD) has been linked to various neurological disorders, including epilepsy. This study aims to utilize dynamic contrast-enhanced magnetic resonance imaging (DCE-MRI) to identify and compare brain regions with BBBD in patients with epilepsy (PWE) and healthy individuals.

Methods: We scanned 50 drug-resistant epilepsy (DRE) patients and 58 control participants from four global specialized epilepsy centers using DCE-MRI. The presence and extent of BBBD were analyzed and compared between PWE and healthy controls.

Results: Both greater brain volume and higher number of brain regions with BBBD were significantly present in PWE compared to healthy controls (p < 10-7). No differences in total brain volume with BBBD were observed in patients diagnosed with either focal seizures or generalized epilepsy, despite variations in the affected regions. Overall brain volume with BBBD did not differ in PWE with MRI-visible lesions compared with non-lesional cases. BBBD was observed in brain regions suspected to be related to the onset of seizures in 82% of patients (n = 39) and was typically identified in, adjacent to, and/or in the same hemisphere as the suspected epileptogenic lesion (n = 10).

Significance: These findings are consistent with pre-clinical studies that highlight the role of BBBD in the development of DRE and identify microvascular stabilization as a potential therapeutic strategy.

Keywords: biomarkers; blood–brain barrier; drug resistance; epilepsy; magnetic resonance imaging.


Conflict of interest statement

None of the authors has any conflict of interest to disclose.

Figures

FIGURE 1
FIGURE 1
Epilepsy vs controls. DCE‐MRI reveals persistent BBBD in patients with epilepsy. (A) Examples of patients’ BBBD analysis results. 1, Healthy control. 2, Left temporal lobe epilepsy. 3, Left frontal lobe epilepsy. 4, Generalized epilepsy. (B) Examples of MAD 124 regions BBBD maps. The MAD between 0 and 2 is transparent. (C) Average MAD above controls in regional maps of 124 areas. Left–right lobe comparison was found to be insignificant (p = .13). (D) Significant regions of patients with epilepsy compared to controls with FDR applied (p < .001). (E) Statistics of BBB% between controls and patients with epilepsy (p < 10−7). (F) Statistics of percentage of regions with BBBD between controls and patients with epilepsy (p < 10−8). Error bars indicate standard deviation (SD). BBBD, blood brain barrier dysfunction; DCE‐MRI, dynamic contrast enhanced magnetic resonance imaging; FDR, false discovery rate; MAD, mean absolute deviation; SD, standard deviation.
FIGURE 2
FIGURE 2
Regional analysis. Imaging patients with epilepsy reveals blood–brain barrier dysfunction. (A–D). Upper images: Example of a T1 image (left image) and a regional analysis (right) in a representative patient with: (A) generalized epilepsy (left–right lobe comparison, p < 10−7), (B) focal epilepsy (p = .68), (C) suspected frontal epilepsy (p = .02), and (D) suspected temporal epilepsy (p = .13). Lower images: Average MAD maps per region in PWE, categorized into the same groups as the upper images. (E) Average MAD scores across all patients in each group for all regions (*p = .04). MAD, mean absolute deviation; PWE, patients with epilepsy.
FIGURE 3
FIGURE 3
Lesion and BBBD. Lesions in MR are associated with blood–brain barrier dysfunction (BBBD). BBBD in patients with a “lesional MRI”: (A) A 35‐year‐old man with left hippocampal sclerosis. (B) A 33‐year‐old man with left frontal cortical dysplasia. (C) A 20‐year‐old woman with right occipital cavernoma. Upper row: Representative anatomic images showing the lesion (red circle). Lower row: Regional analysis of BBB leakage. (D) Location of region(s) with highest BBBD in relation to lesion site (p = .49) (see Table S1). (E) Number of brain regions with BBBD (MAD >2) in patients with and without MRI‐positive lesion. (F) Average MAD in patients with and without MRI‐positive lesion (p = .41). BBBD, blood brain barrier dysfunction; MAD, mean absolute deviation; MR, magnetic resonance.

References

    1. Serlin Y, Shelef I, Knyazer B, Friedman A. Anatomy and physiology of the blood‐brain barrier. Semin Cell Dev Biol. 2015;38:2–6. - PMC - PubMed
    1. Heinemann U, Kaufer D, Friedman A. Blood‐brain barrier dysfunction, TGFβ signaling, and astrocyte dysfunction in epilepsy. Glia. 2012;60(8):1251–1257. - PMC - PubMed
    1. Cacheaux LP, Ivens S, David Y, Lakhter AJ, Bar‐Klein G, Shapira M, et al. Transcriptome profiling reveals TGF‐beta signaling involvement in epileptogenesis. J Neurosci. 2009;29(28):8927–8935. - PMC - PubMed
    1. David Y, Cacheaux LP, Ivens S, Lapilover E, Heinemann U, Kaufer D, et al. Astrocytic dysfunction in epileptogenesis: consequence of altered potassium and glutamate homeostasis? J Neurosci. 2009;29(34):10588–10599. - PMC - PubMed
    1. Kim SY, Porter BE, Friedman A, Kaufer D. A potential role for glia‐derived extracellular matrix remodeling in postinjury epilepsy. J Neurosci Res. 2016;94(9):794–803. - PubMed

Publication types

LinkOut - more resources