. 2024 Nov 19;121(47):e2414187121.
doi: 10.1073/pnas.2414187121. Epub 2024 Nov 6.

Cytosolic N6AMT1- dependent translation supports mitochondrial RNA processing

Affiliations

Cytosolic N6AMT1- dependent translation supports mitochondrial RNA processing

Mads M Foged et al. Proc Natl Acad Sci U S A. .

Abstract

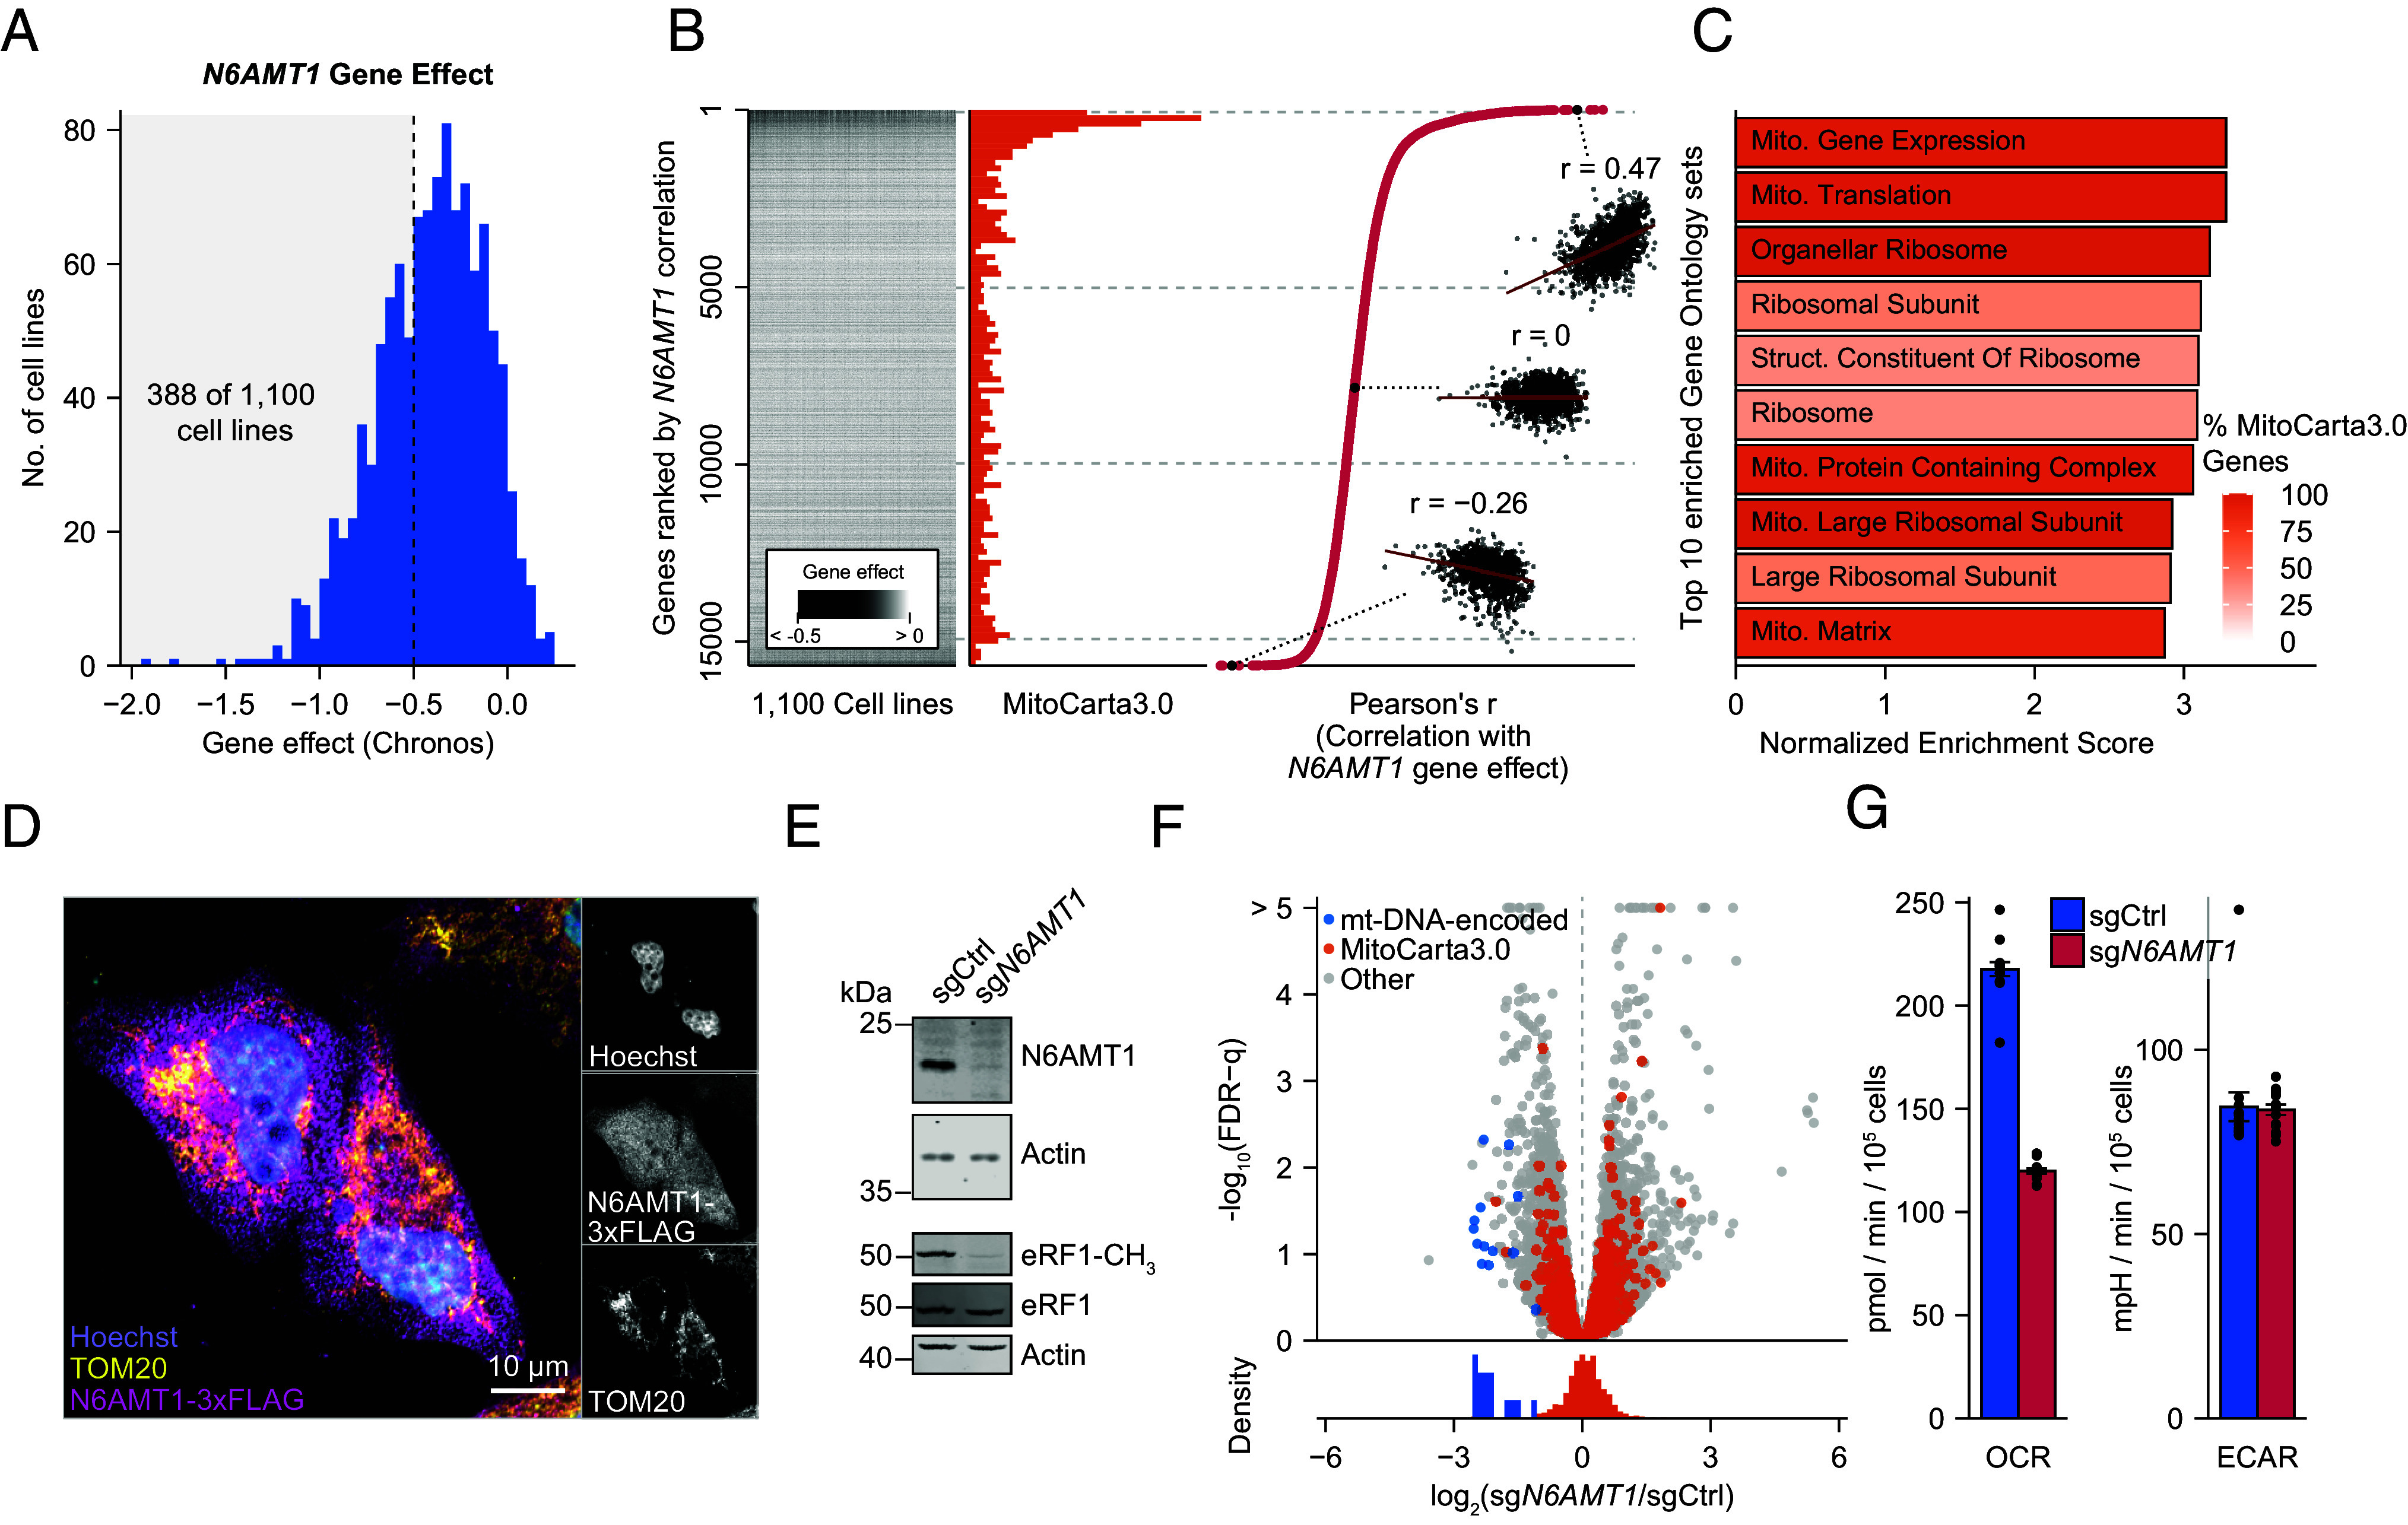
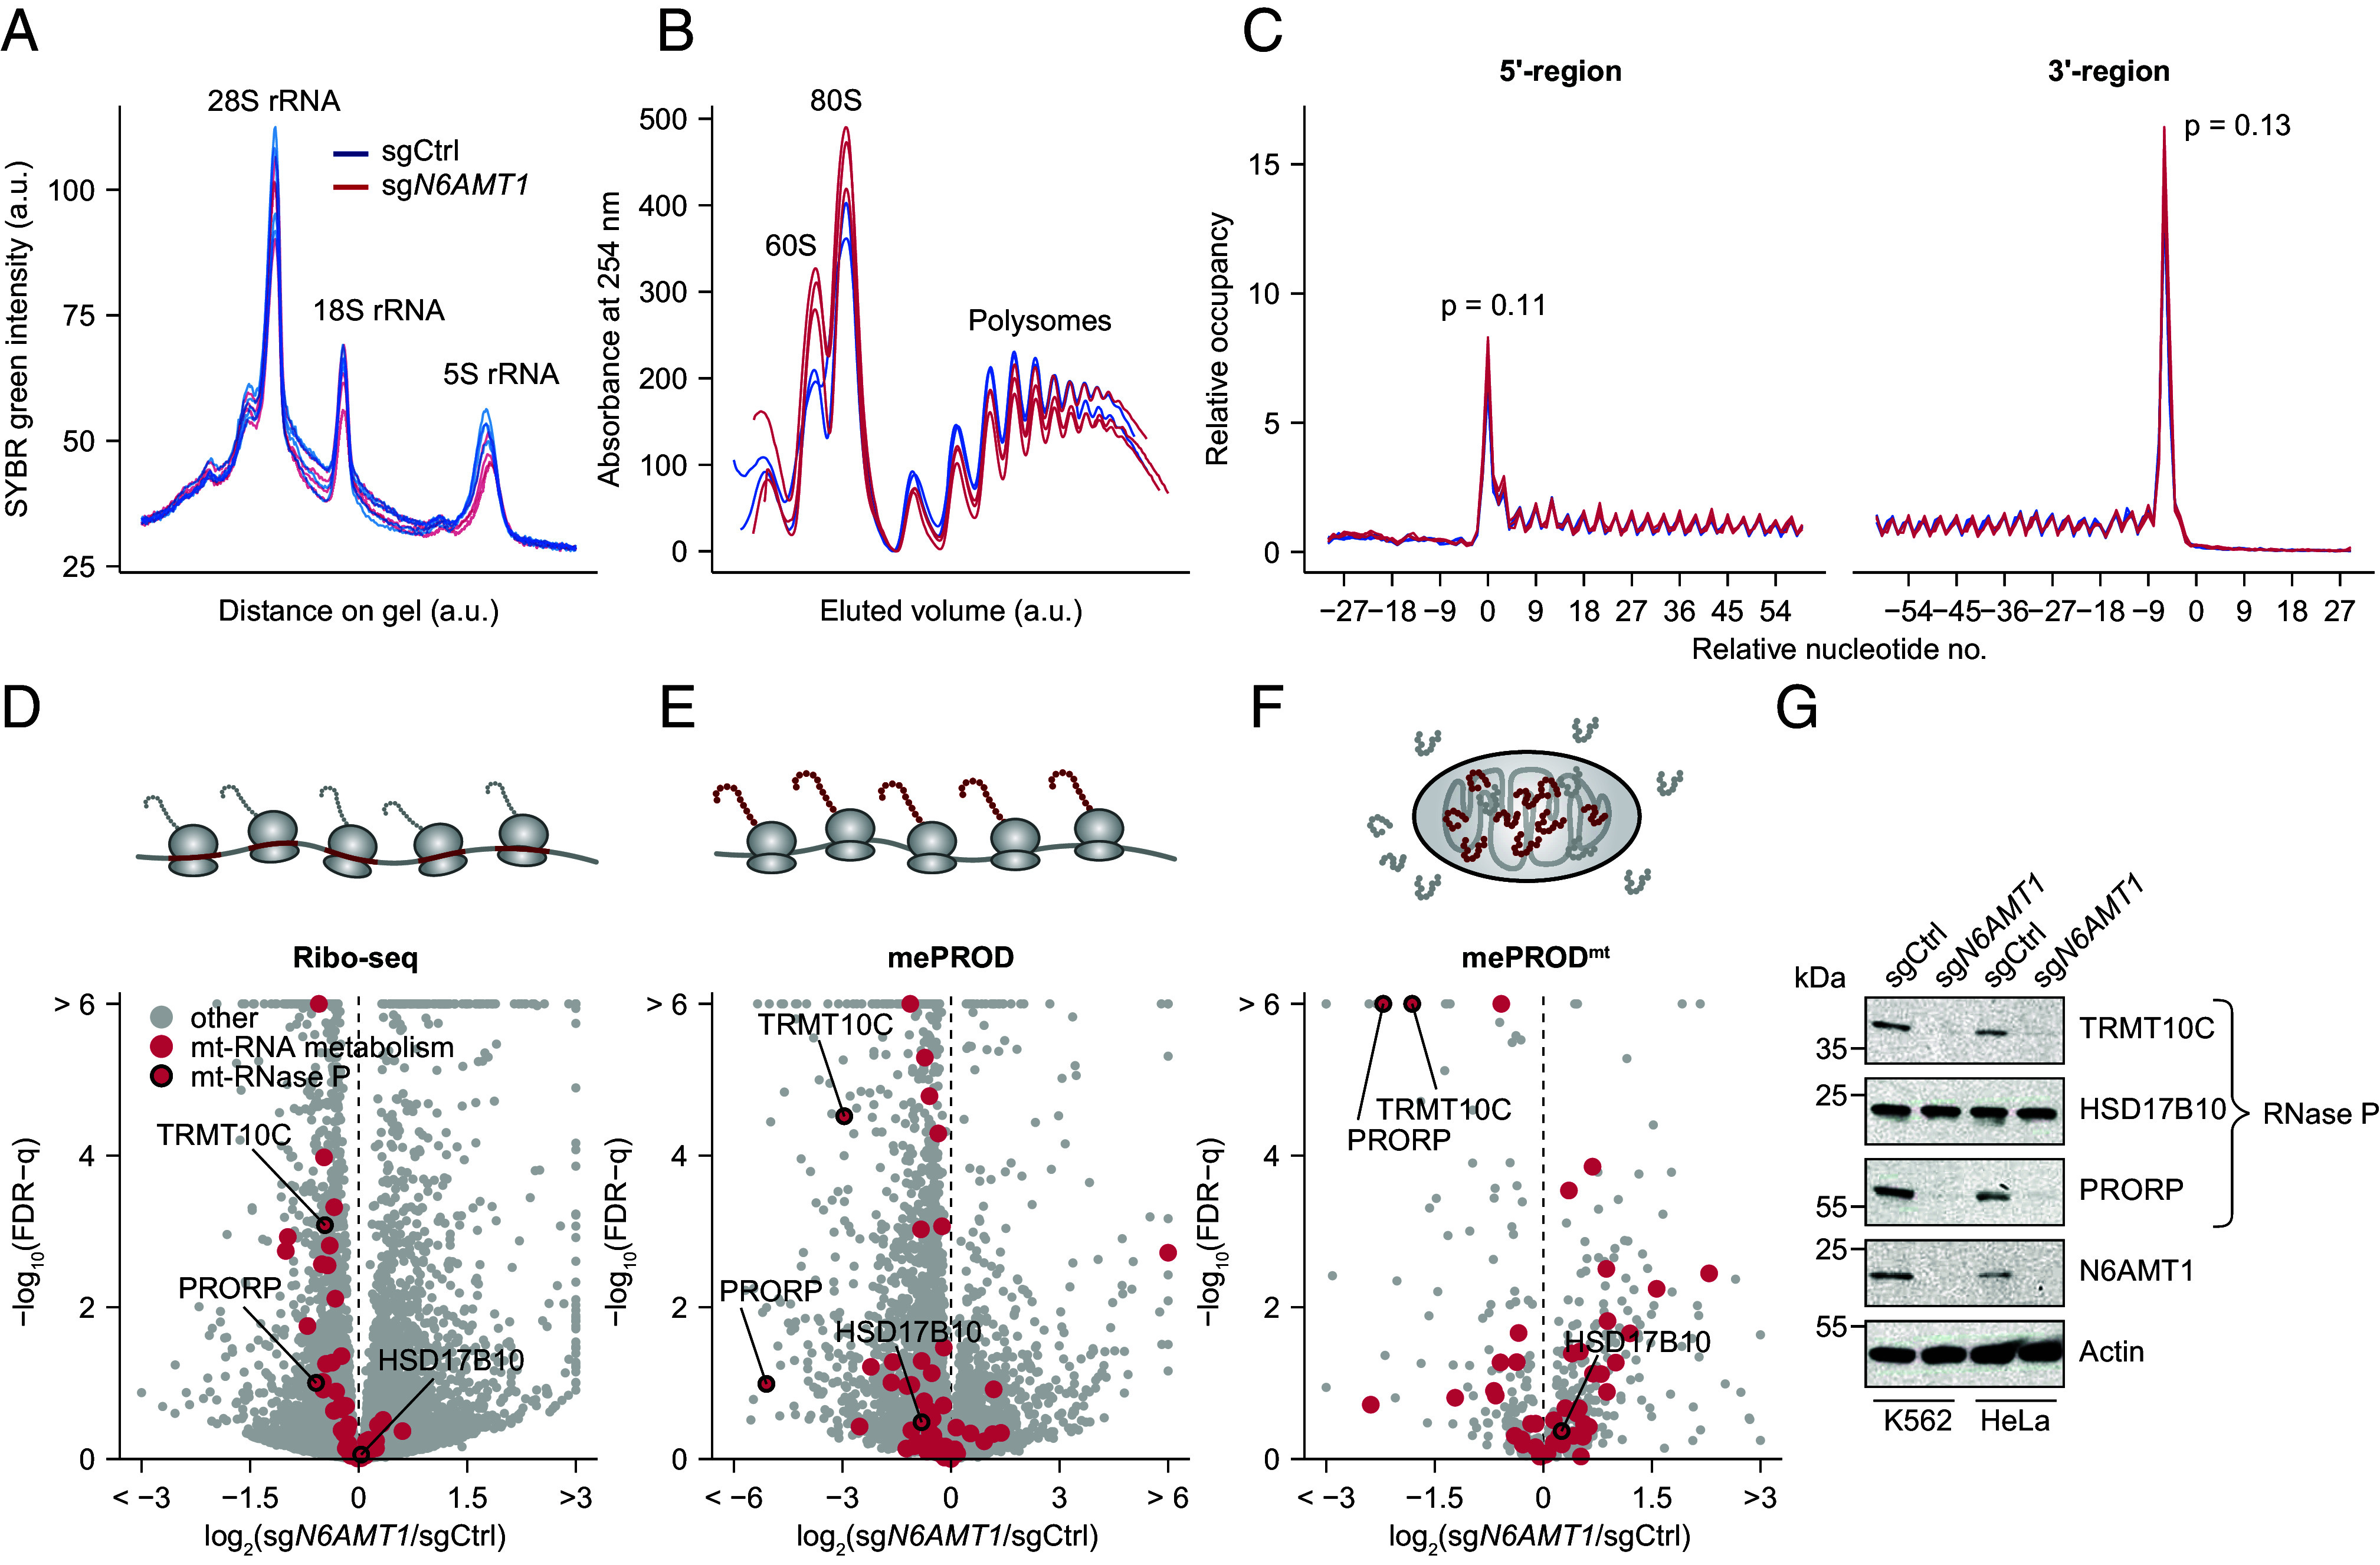
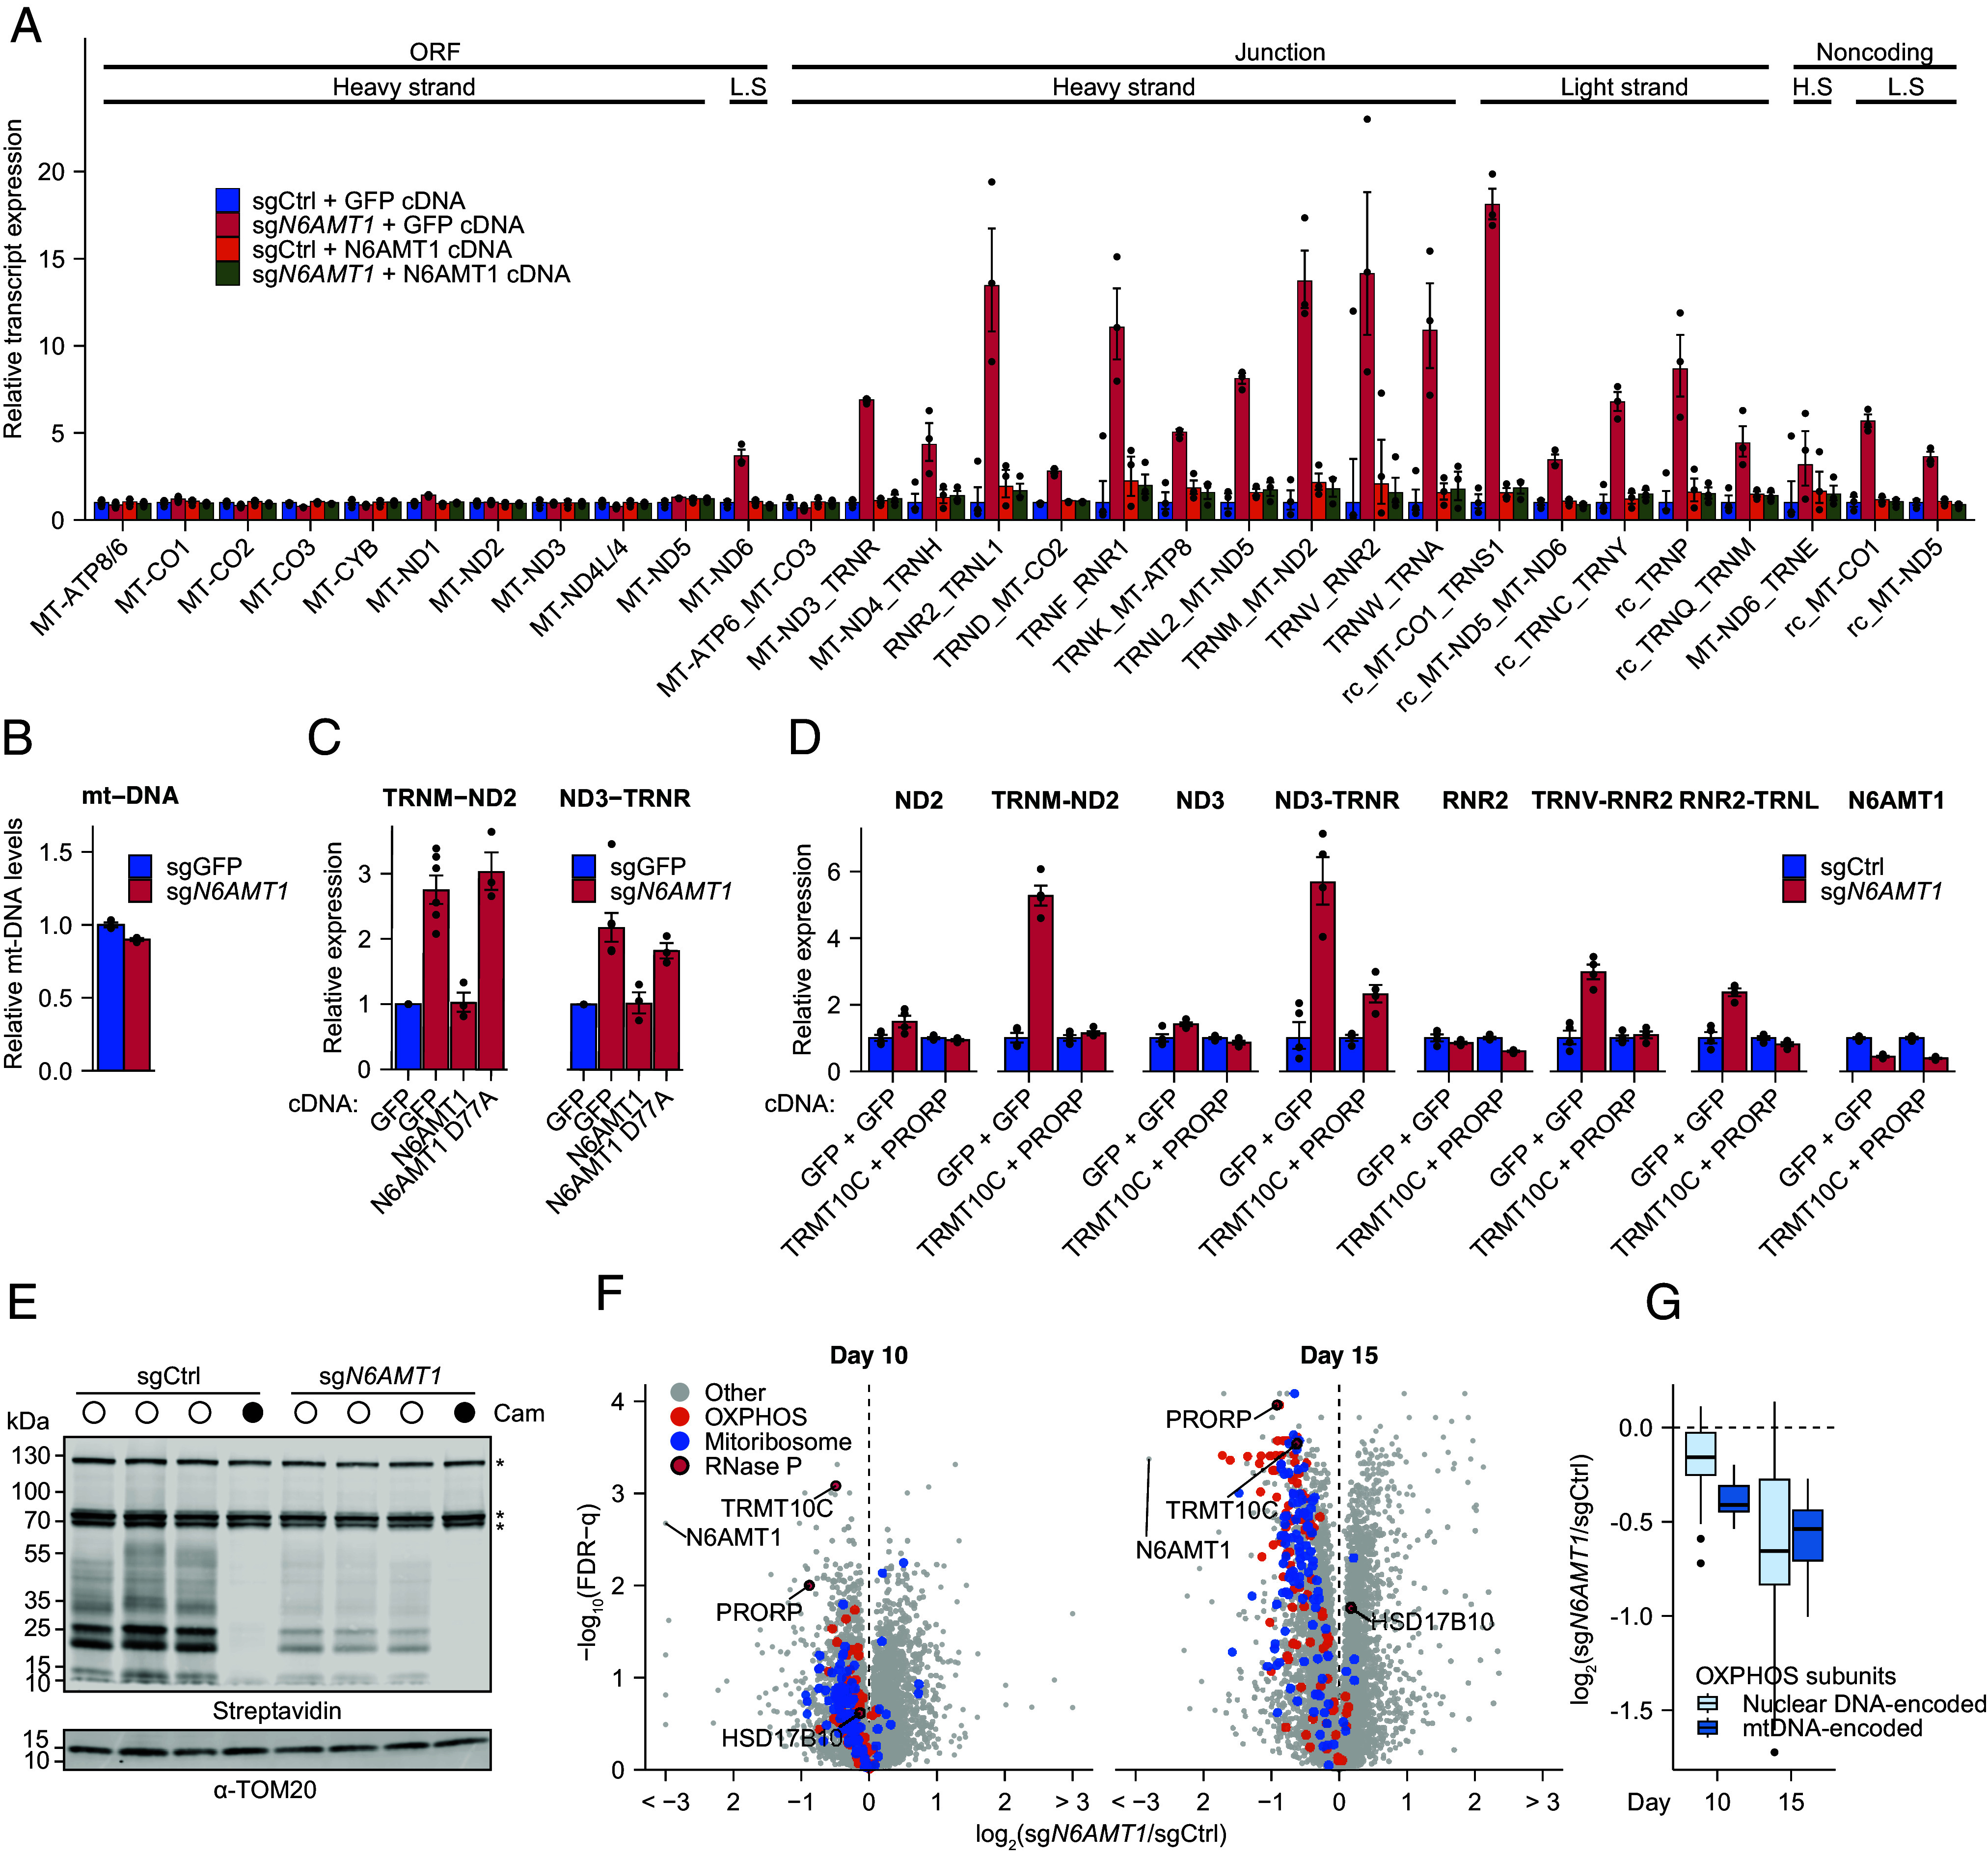
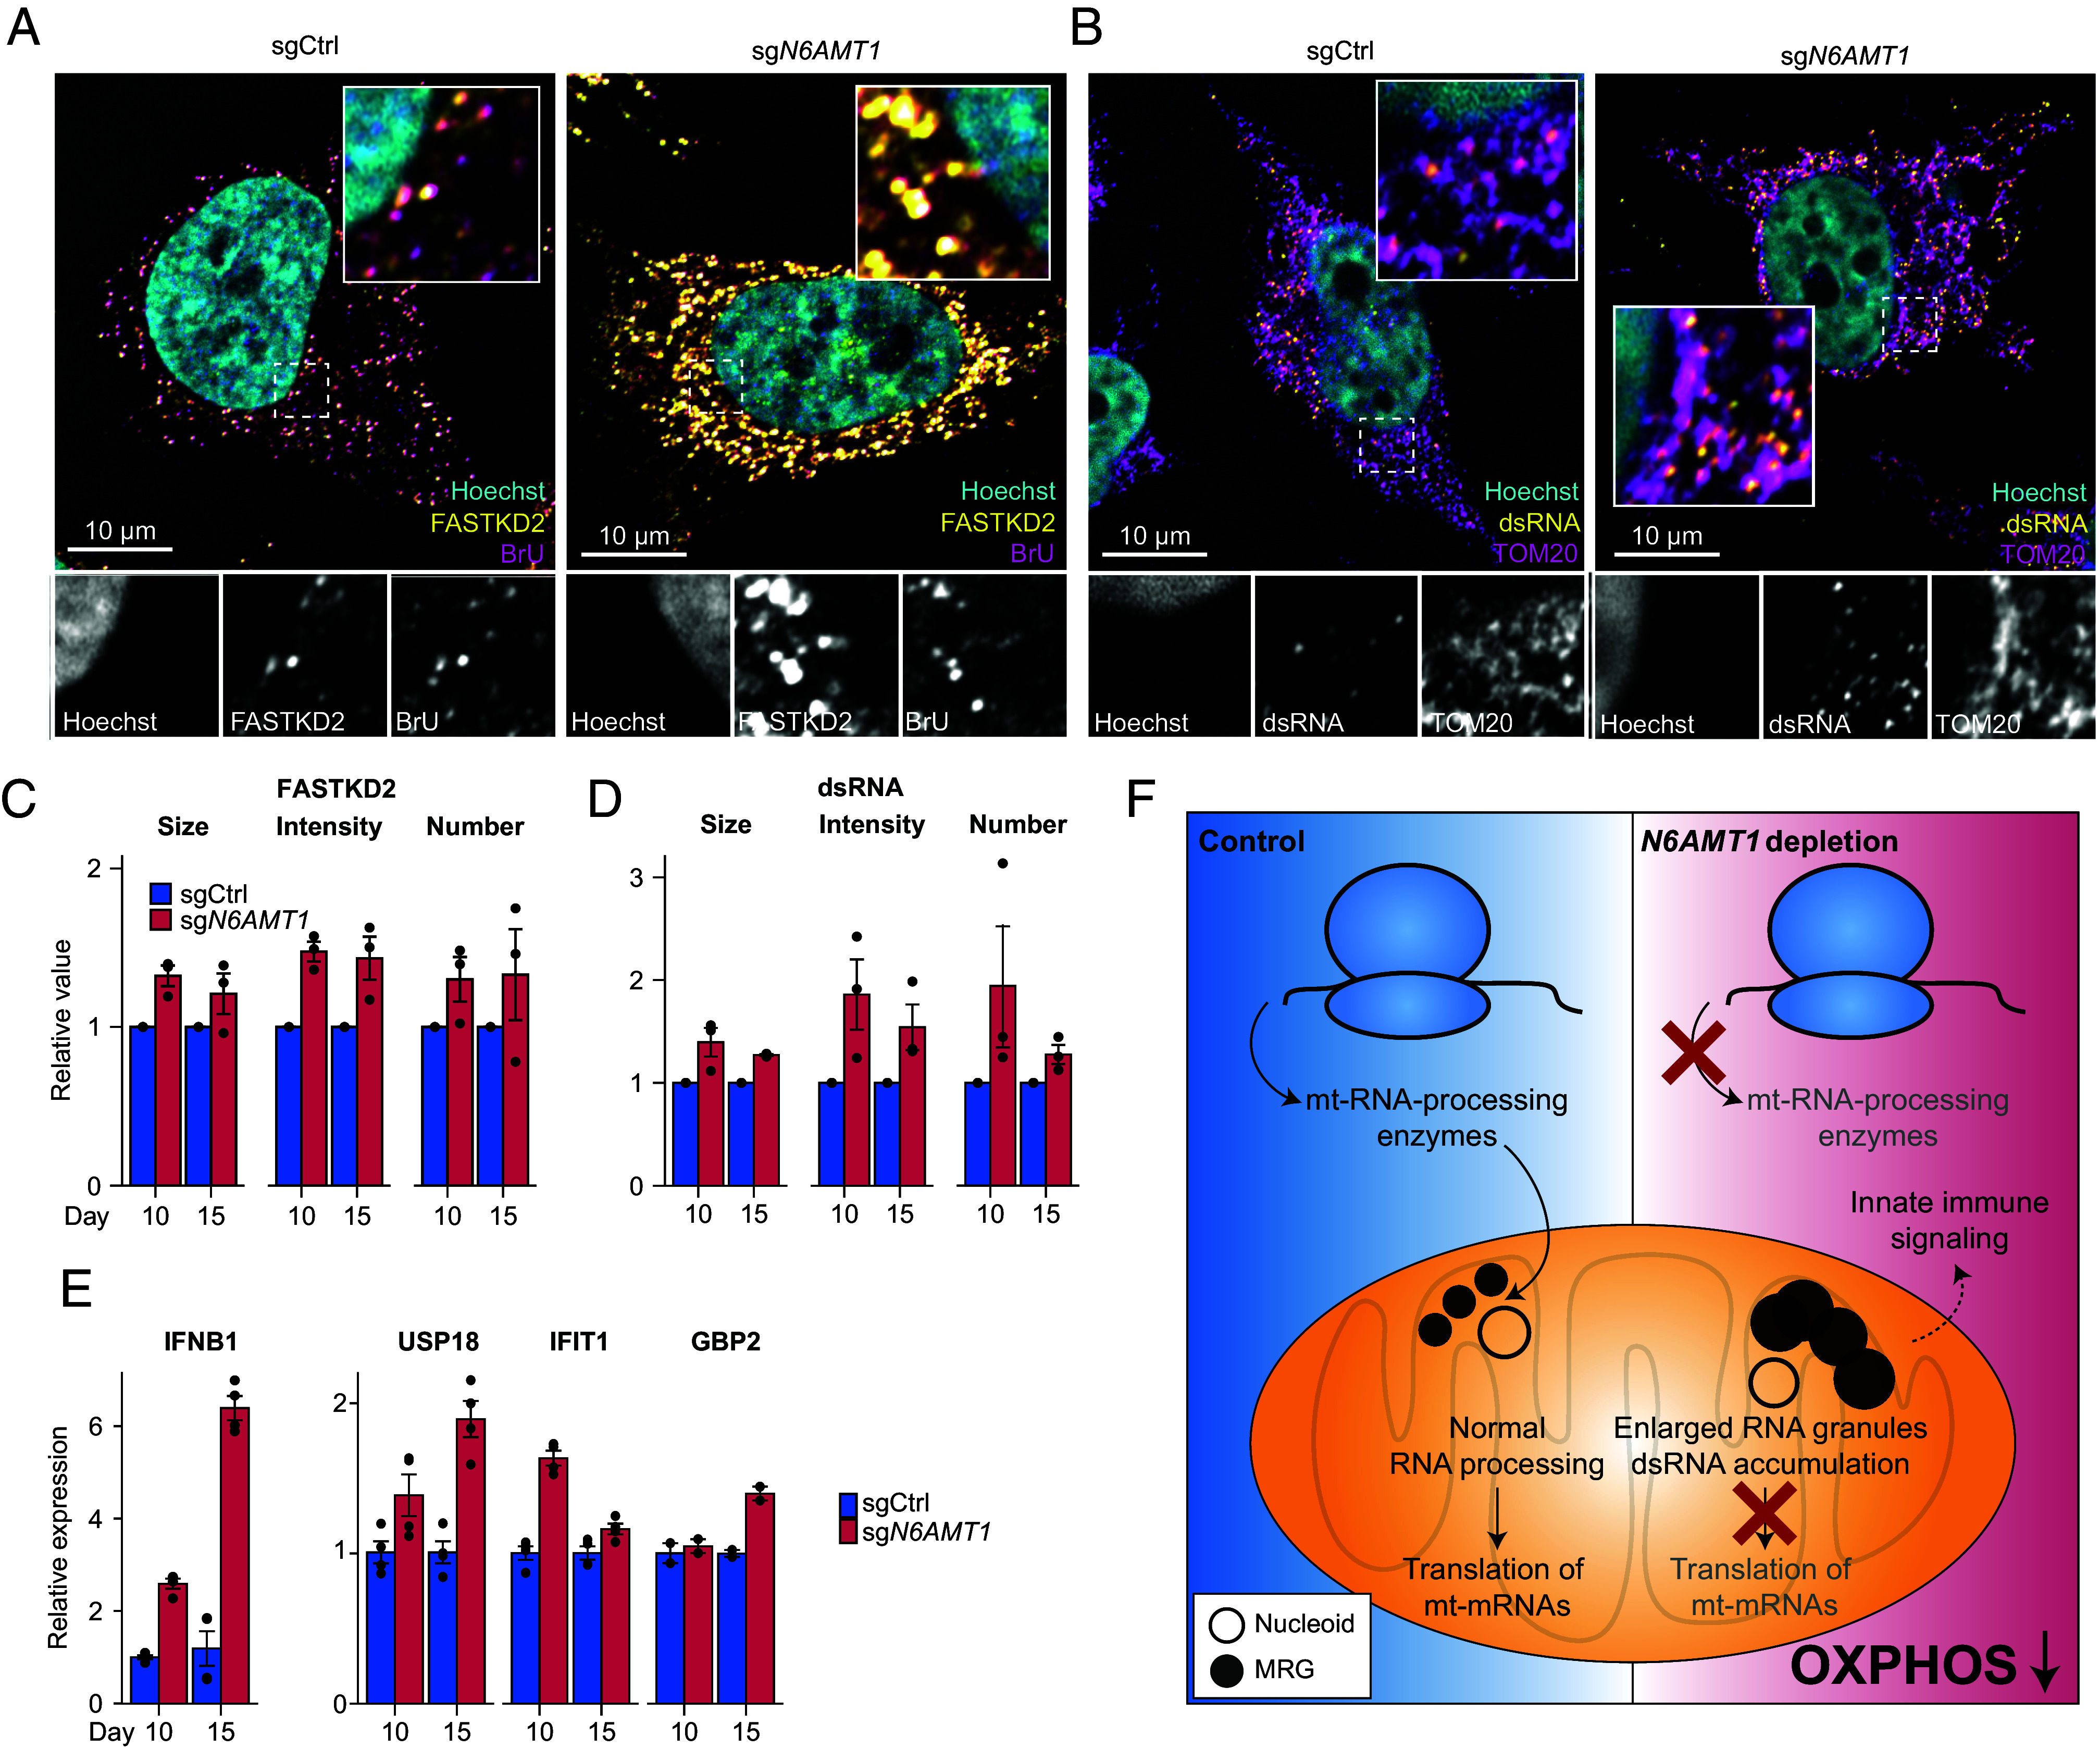
Mitochondrial biogenesis relies on both the nuclear and mitochondrial genomes, and imbalance in their expression can lead to inborn errors of metabolism, inflammation, and aging. Here, we investigate N6AMT1, a nucleo-cytosolic methyltransferase that exhibits genetic codependency with mitochondria. We determine transcriptional and translational profiles of N6AMT1 and report that it is required for the cytosolic translation of TRMT10C (MRPP1) and PRORP (MRPP3), two subunits of the mitochondrial RNAse P enzyme. In the absence of N6AMT1, or when its catalytic activity is abolished, RNA processing within mitochondria is impaired, leading to the accumulation of unprocessed and double-stranded RNA, thus preventing mitochondrial protein synthesis and oxidative phosphorylation, and leading to an immune response. Our work sheds light on the function of N6AMT1 in protein synthesis and highlights a cytosolic program required for proper mitochondrial biogenesis.

Keywords: OXPHOS; RNA processing; mitochondria; mitochondrial RNA granules; translation.


Conflict of interest statement

Competing interests statement:The authors declare no competing interest.

Figures

Fig. 1.
Fig. 1.
The mitochondrial impact of N6AMT1 is independent of nuclear transcription. (A) Cell line distribution of N6AMT1 Chronos scores across 1,100 cell lines of the CCLE. Density represents the relative number of cell lines with an N6AMT1-gene effect score within the range of each bin. The shaded area represents highly N6AMT1-dependent cell lines (388 of 1,100 cell lines with Chronos score <−0.5). (B) Analysis of N6AMT1 gene effect correlations. Gene-effect scores (Chronos scores; Left) of 15,677 nonessential genes in 1,100 cell lines from the CCLE were correlated with N6AMT1 gene effects and ranked according to Pearson correlation coefficients (Right). The distribution of MitoCarta3.0 genes is indicated in the Middle panel. Inserts show example correlations between N6AMT1 and three arbitrarily selected genes. Pearson correlation coefficients are listed in Dataset S1. (C) Top 10 enriched gene sets from Gene Ontology term-based GSEA of correlation coefficients shown in (B). Color shade indicates the percentage of MitoCarta3.0 genes in each gene set. (D) Immunofluorescence analysis of N6AMT1 localization. HeLa cells were transduced with N6AMT1-3xFLAG cDNA and immunolabeled with anti-FLAG and anti-TOM20 (a mitochondrial marker). Nuclei were visualized by Hoechst staining. (E) Immunoblot analysis of N6AMT1, methylated eRF1 (eRF1-CH3), and total eRF1 protein levels in control (sgCtrl) and N6AMT1-depleted (sgN6AMT1) K562 cells. (F) Transcriptomic analysis of 11,285 transcripts in N6AMT1-depleted K562 cells highlighting MitoCarta3.0 (orange) and mitochondrial DNA (mtDNA)-encoded ORFs (blue). False discovery rate (FDR) was calculated according to the method of Benjamini and Hochberg. n = 3 independent lentiviral transductions per condition. (G) Representative basal oxygen consumption rate (OCR) and ECAR per 10,000 cells in N6AMT1-depleted K562 cells. Bars represent mean values (n = 15 replicate wells, representative of ≥3 independent experiments), and error bars represent SEM.
Fig. 2.
Fig. 2.
Cytosolic translation of the mt-RNA processing machinery is reduced in N6AMT1-depleted cells. (A) Quantification of RNA agarose gel (shown in SI Appendix, Fig. S2A) comparing control (sgCtrl) to N6AMT1-depleted (sgN6AMT1) K562 cells 10 d post-sgRNA transduction (n = 4 independent lentiviral infections per condition). Each curve represents the SYBR-green intensity across one lane, with the major rRNA peaks indicated. (B) Polysome analysis of control and N6AMT1-depleted K562 cells (n = 2-3 lentiviral infections) 10 d post-sgRNA transduction. Elution volumes are normalized to the 80S peak and the maximal polysome peak to allow direct comparisons between replicates. (C) Metagene analysis of control and N6AMT1-depleted K562 cells 10 d post-sgRNA transduction detected by ribosome profiling (Ribo-Seq). Curves represent ribosome-protected fragments at the indicated nucleotide positions relative to the total number of ribosome-protected fragments (n = 3 independent lentiviral infections per condition, based on 9,600 transcripts). P-values were obtained by Student’s t tests of the 5′ and 3′ peaks, respectively. (D) Transcript ribosome occupancy of 10,793 transcripts detected by ribosome profiling (Ribo-Seq) in N6AMT1-depleted K562 as compared to control cells. n = 3 independent lentiviral transduction per condition. (E and F) Translatome analysis using multiplexed enhanced protein dynamics (mePROD; 4,079 proteins) proteomics (E) and global mitochondrial protein import proteomics (mePRODmt; 495 proteins) (F) in N6AMT1-depleted K562 as compared to control cells. n = 4 independent lentiviral transduction per condition. (G) Protein immunoblot showing mitochondrial RNase P subunit protein levels in control and N6AMT1-depleted K562 and HeLa cells, with antibodies targeting TRMT10C (MRPP1), HSD17B10 (MRPP2), and PRORP (MRPP3).
Fig. 3.
Fig. 3.
N6AMT1 depletion leads to impaired mt-RNA processing and prevents mitochondrial translation and OXPHOS. (A) MitoString analysis of mitochondrial RNA processing in control (sgCtrl) and N6AMT1-depleted (sgN6AMT1) K562 cells where a control cDNA (coding for GFP) or an sgRNA-resistant cDNA of N6AMT1 was introduced. Bars represent geometric mean values and error bars indicate corresponding SEM (n = 3 independent transduction). L.S.: light strand; H.S.: heavy strand. rc: reverse complement. “ORF,” “Junction,” and “Noncoding” correspond to the regions of the mitochondrial transcriptome targeted by our probes. MitoString probes are described in more detail in SI Appendix, Fig. S3. (B) Relative mt-DNA quantification as determined by qPCR in control or N6AMT1-depleted K562 cells. Relative mt-DNA levels were calculated as the ratio between the expression of the mt-DNA-encoded MT-ND2 gene and the nuclear DNA-encoded 18S rRNA gene. (C) qPCR analysis of unprocessed mt-RNA in control, N6AMT1-depleted cells, and N6AMT1-depleted cells with an sgRNA-resistant N6AMT1 cDNA introduced (wild type or catalytically active mutant D77A) (n = 3 to 6 independent lentiviral infections). (D) qPCR analysis of unprocessed and total mt-mRNA and mt-rRNA in control or N6AMT1-depleted K562 with the introduction of either 2 different GFP cDNAs or TRMT10C + PRORP cDNA (n = 3 independent lentiviral infections). (E) Translation of mitochondrially encoded proteins in control or N6AMT1-depleted K562 cells after labeling with L-Homopropargylglycine in the presence of cycloheximide (a cytosolic translation inhibitor). Chloramphenicol (Cam, a mitochondrial translation inhibitor) is used as control. Asterisks indicate endogenously biotinylated mitochondrial proteins. All mt-DNA-encoded proteins migrate below the 70 kDa marker. (F) Proteome changes of 7,364 quantified proteins in N6AMT1-depleted K562 cells as compared to control, 10 d (Left) or 15 d (Right) following sgRNA transduction (n = 3 independent transduction per condition per day). (G) Proteomics protein abundance of OXPHOS subunits according to the genome (nuclear or mitochondrial (mt-DNA)) that encodes them.
Fig. 4.
Fig. 4.
Mitochondrial preRNA and dsRNA accumulate and trigger an interferon response in N6AMT1-depleted cells. (A) Representative images from immunofluorescence analysis of FASTKD2- and bromouridine (BrU)-immunolabeled MRGs in control (sgCtrl) or N6AMT1-depleted (sgN6AMT1) HeLa cells 15 d post transduction. (B) Representative images from immunofluorescence analysis of mitochondria (labeled with antibodies against TOM20) and mitochondrial dsRNA (labeled with J2 dsRNA antibody) in sgCtrl or sgN6AMT1 HeLa cells 15 d post transduction. (C and D) Quantification of FASTKD2 foci (C) and dsRNA foci (D), 10 or 15 d post transduction of HeLa cells with sgCtrl or sgN6AMT1. n = 3 independent experiments, with signal from at least 25 cells per condition. “Number” refers to average number of foci per cell area, “Size” refers to the average foci area, and “Intensity” refers to the average foci intensity. (E) qPCR determination of transcripts of interferon beta (IFNB1) and interferon-inducible USP18, IFIT1, and GBP2 in N6AMT1-depleted HeLa cell lines as compared to controls 10 or 15 d post transduction. n = 4 independent transductions. (F) Proposed role of N6AMT1 in mitochondrial biogenesis. In N6AMT1-depleted cells, translation of mt-RNA-processing enzymes is reduced, leading to accumulation of unprocessed RNA in MRGs. This prevents translation of essential genes involved in mitochondrial gene expression and OXPHOS. In addition, impaired RNA processing leads to the accumulation of double-stranded mt-RNA that activates immune signaling pathways.

References

    1. Wu Z., et al. , Mechanisms controlling mitochondrial biogenesis and respiration through the thermogenic coactivator PGC-1. Cell 98, 115–124 (1999). - PubMed
    1. Virbasius J. V., Scarpulla R. C., Activation of the human mitochondrial transcription factor A gene by nuclear respiratory factors: A potential regulatory link between nuclear and mitochondrial gene expression in organelle biogenesis. Proc. Natl. Acad. Sci. U.S.A. 91, 1309–1313 (1994). - PMC - PubMed
    1. Schatton D., et al. , CLUH regulates mitochondrial metabolism by controlling translation and decay of target mRNAs. J. Cell Biol. 216, 675–693 (2017). - PMC - PubMed
    1. Zid B. M., et al. , 4E-BP extends lifespan upon dietary restriction by enhancing mitochondrial activity in Drosophila. Cell 139, 149–160 (2009). - PMC - PubMed
    1. Jourdain A. A., et al. , GRSF1 regulates RNA processing in mitochondrial RNA granules. Cell Metab. 17, 399–410 (2013). - PMC - PubMed

Grants and funding