. 2024 Nov 6;40(1):94.
doi: 10.1007/s10565-024-09930-0.

Triptolide induces hepatotoxicity by promoting ferroptosis through Nrf2 degradation

Affiliations

Triptolide induces hepatotoxicity by promoting ferroptosis through Nrf2 degradation

Lin Guo et al. Cell Biol Toxicol. .

Abstract

Background: Triptolide (TP), a principal active substance from Tripterygium wilfordii, exhibits various pharmacological effects. However, its potential hepatotoxicity has always been a significant concern in clinical applications.

Purpose: This research aimed to explore the involvement of ferroptosis in TP-mediated hepatic injury and the underlying mechanisms.

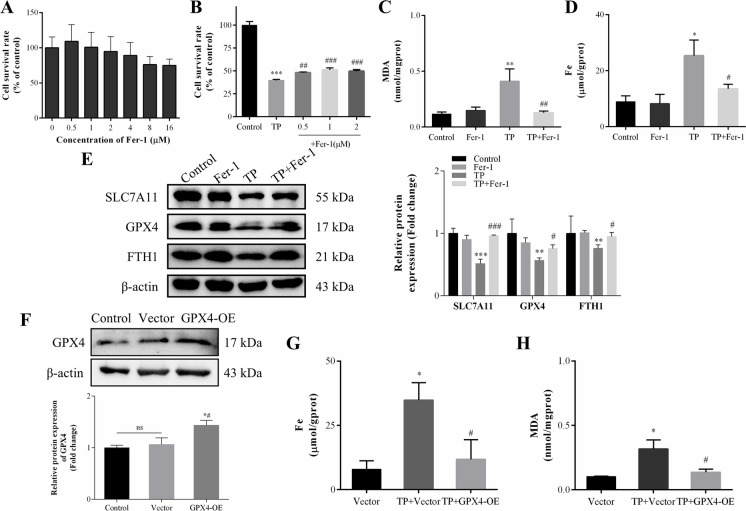
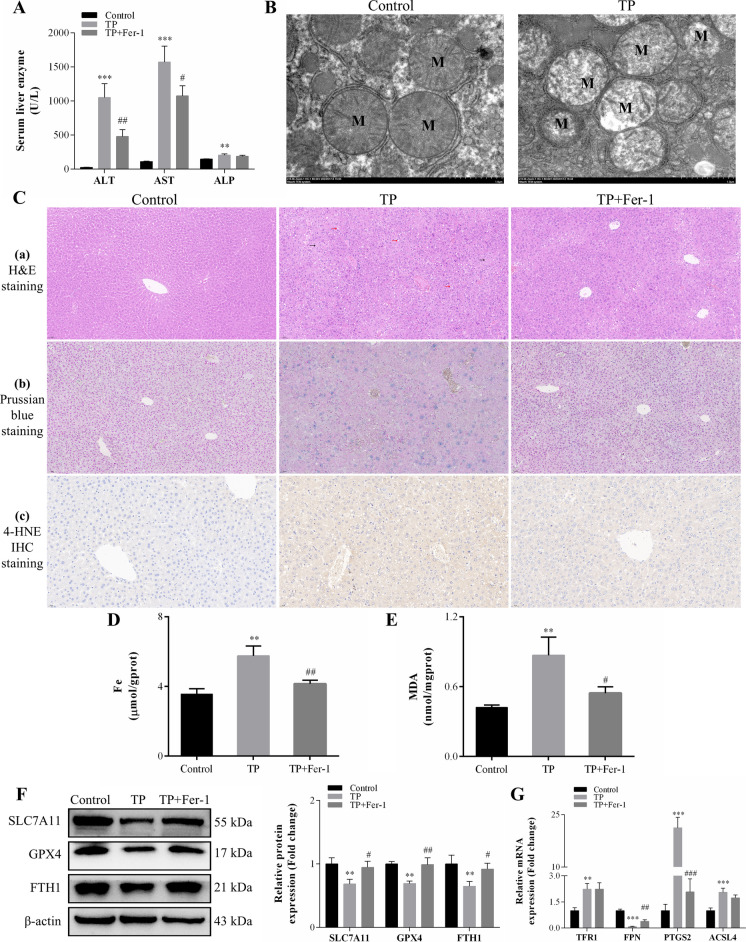
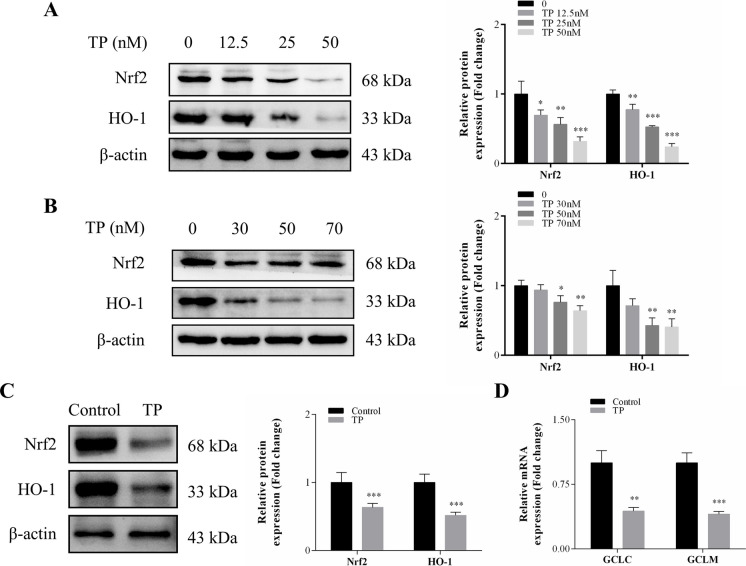
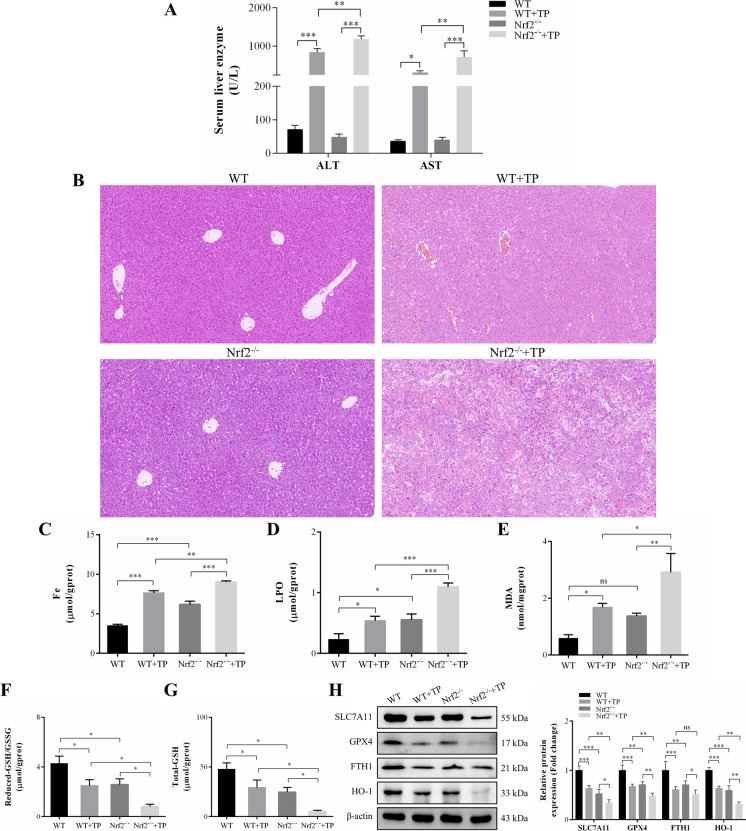
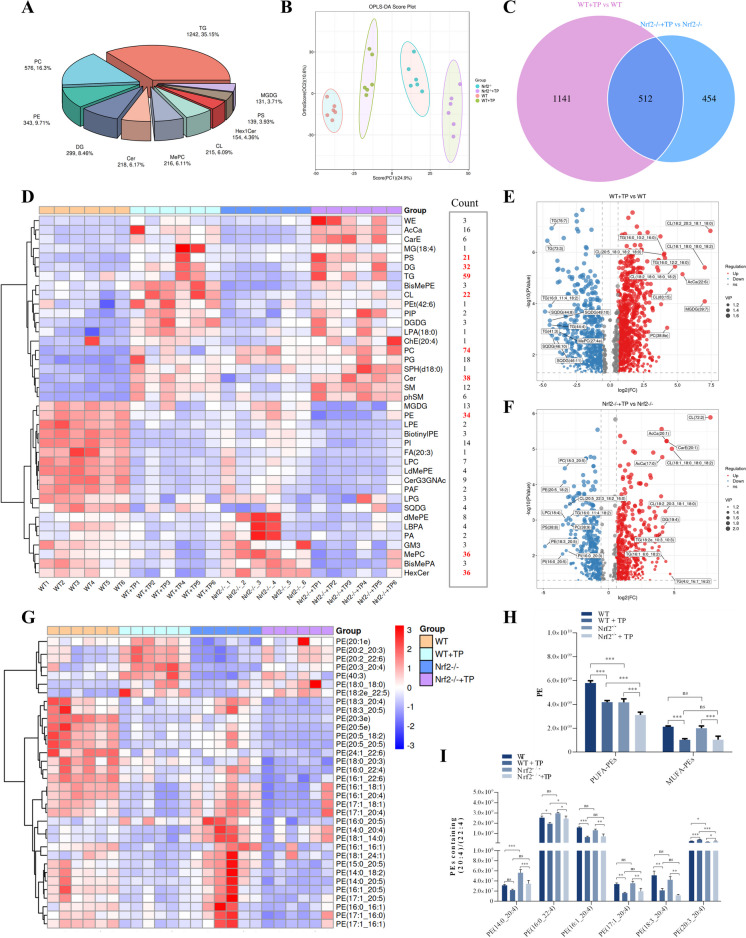
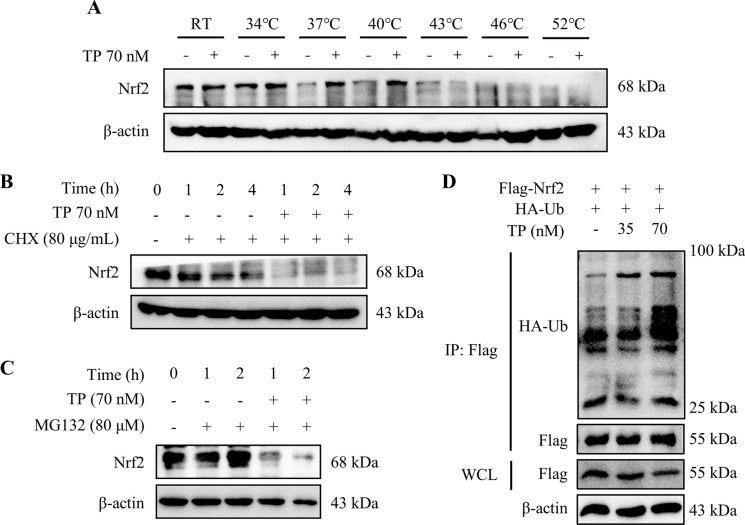
Methods: In this study, in vitro and in vivo experiments were involved. Hepatocyte damage caused by TP was evaluated using MTT assays, liver enzyme measurement and H&E staining technique. Ferroptosis was assessed by measuring iron level, lipid peroxide, glutathione (GSH), mitochondrial morphology and the key protein/mRNA expression implicated in ferroptosis. To verify the contribution of ferroptosis to TP-induced liver damage, the ferroptosis inhibitor Ferrostatin-1 (Fer-1) and a plasmid for overexpressing glutathione peroxidase 4 (GPX4) were employed. Subsequently, nuclear factor erythroid 2-related factor 2 (Nrf2) knockout mice and Nrf2 overexpression plasmid were utilized to investigate the underlying mechanisms. Nontargeted lipidomics was used to analyze lipid metabolism in mouse liver. Moreover, the cellular thermal shift assay (CETSA), cycloheximide (CHX) and MG132 treatments, and immunoprecipitation (IP) assays were applied to validate the binding of TP to Nrf2 and their interactions.

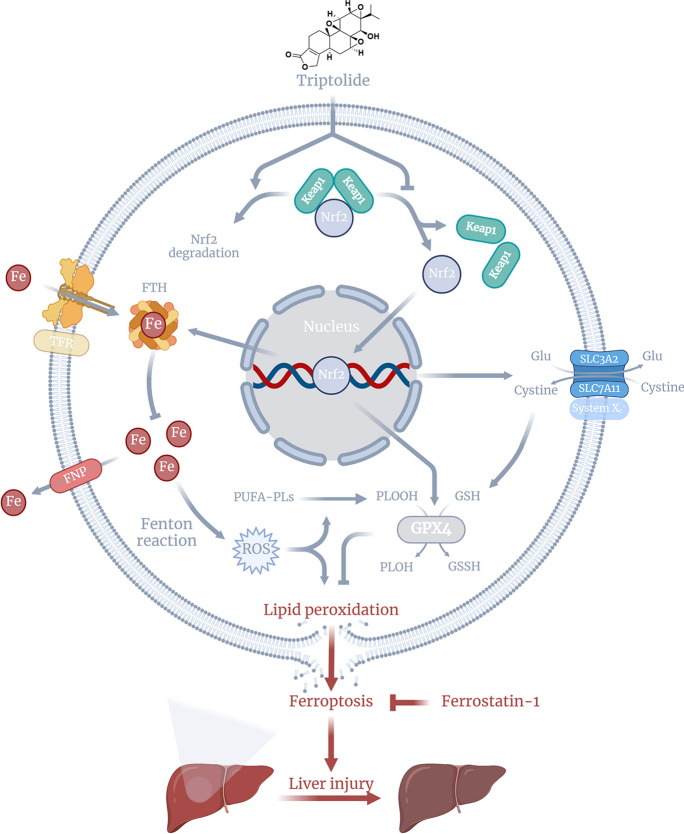
Results: TP triggered ferroptosis in hepatocytes, as indicated by iron accumulation and lipid peroxidation. Ferroptosis was responsible for TP-induced hepatic injury. During the process of TP-induced liver damage, the Nrf2 signaling pathway was significantly suppressed. Notably, the deletion of Nrf2 in mice aggravated the extent of liver injury and ferroptosis associated with TP, whereas enhancing Nrf2 expression in cells significantly reduced TP-induced ferroptosis. Additionally, dysregulation of lipid metabolism was associated with TP-induced liver injury. TP may directly bind to Nrf2 and enhance its degradation through the ubiquitin-proteasome pathway, thereby inhibiting or reducing Nrf2 expression.

Conclusion: In summary, the suppression of Nrf2 by TP facilitated the occurrence of ferroptosis, resulting in liver damage.

Keywords: Ferroptosis; Liver injury; Nrf2; Triptolide.


Conflict of interest statement

The authors declare no competing interests.

Figures

Fig. 1
Fig. 1
TP induced ferroptosis in hepatocytes in vitro. (A, B) Cell survival rates of (A) L02 cells and (B) AML12 cells after treatment with TP at multiple concentrations (0, 10, 20, 40, 80 nM) for 48 h (n = 6). (C, D) Iron content after 48 h of TP treatment at 0, 12.5, 25, and 50 nM for (C) L02 cells, and at  0, 30, 50, and 70 nM for (D) AML12 cells (n = 3). (E, F) MDA levels of (E) L02 cells and (F) AML12 cells after TP treatment for 48 h (n = 3). (G, H) Protein expression levels of ferroptosis markers (SLC7A11, GPX4, and FTH1) in (G) L02 cells and (H) AML12 cells after TP treatment for 48 h (n = 3). (I, J) mRNA expression levels of ferroptosis markers (PTGS2, NOX1, and TFR1) in (I) L02 cells and (J) AML12 cells after TP treatment for 48 h (n = 3). *P < 0.05, **P < 0.01 and ***P < 0.001 vs. Control group
Fig. 2
Fig. 2
Ferroptosis was involved in TP-induced hepatocyte death. (A) Cell survival rate after Fer-1 treatment (0, 0.5, 1, 2, 4, 8, 16 μM) for 49 h. (B-E) After AML12 cells were pretreated with 1 μM Fer-1 for 1 h and then co-treated with TP (70 nM) and Fer-1 for 48 h, we measured (B) the cell survival rate, (C) MDA levels, (D) iron content, and (E) SLC7A11, GPX4, and FTH1 protein levels. n = 3, *P < 0.05, **P < 0.01 and ***P < 0.001 vs. Control group. #P < 0.05, ##P < 0.01 and ###P < 0.001 vs. TP group. (F) AML12 cells were transfected with 2 μg empty vector or GPX4 overexpression plasmid. The transfection efficiency of the GPX4 overexpression plasmid was validated via western blot analysis. n = 3, *P < 0.05 vs. Control group. #P < 0.05 vs. Vector group. ns means no statistical difference. (G-H) AML12 cells were transfected with 2 μg vector or GPX4 overexpression plasmid before treatment with 70 nM TP for 48 h. Then, (G) iron content and (H) MDA levels were measured. n = 3, *P < 0.05 vs. Vector group. #P < 0.05 vs. TP + Vector group
Fig. 3
Fig. 3
Ferroptosis was involved in TP-induced liver injury. (A) Serum liver enzyme (ALT, AST, and ALP) levels (n = 8). (B) The mitochondrial structure of hepatocytes in mouse liver were observed under an electron microscope (scale bar = 1 μm; M, mitochondria). (C) a. H&E-stained liver sections (20×, scale bar = 50 μm). The red arrow indicates swollen hepatocytes. The black arrow indicates vacuoles. b. Prussian blue iron staining of liver tissues (20×, scale bar = 50 μm). Under acidic conditions, cyanide can combine with iron ions to form a blue precipitate. c. Immunohistochemical staining of liver tissues for 4-HNE (40×, scale bar = 20 μm). (D) Iron content in mouse liver tissue (n = 8). (E) MDA levels in mouse liver tissue (n = 8). (F) Protein expression levels of ferroptosis markers (SLC7A11, GPX4 and FTH1) in mouse liver were determined by western blot analysis (n = 6). (G) Liver tissue mRNA expression levels of ferroptosis markers (TFR1, FPN, PTGS2 and ACSL4) were determined by RT-qPCR (n = 6). **P < 0.01, ***P < 0.001 vs. Control group. #P < 0.05, ##P < 0.01, and ###P < 0.001 vs. TP group
Fig. 4
Fig. 4
Nrf2 signaling pathway was suppressed in TP-induced in vitro hepatocyte damage model and in vivo liver injury model. (A) Protein expression of Nrf2 and HO-1 in L02 cells after TP treatment for 48 h (n = 3). (B) Protein expression of Nrf2 and HO-1 in AML12 cells after TP treatment for 48 h (n = 3). (C) Protein expression of Nrf2 and HO-1 in mouse liver (n = 6). (D) mRNA expression of GCLC and GCLM in mouse liver (n = 6). *P < 0.05, **P < 0.01 and ***P < 0.001 vs. Control group
Fig. 5
Fig. 5
Nrf2 knock-out aggravated TP-induced liver injury and ferroptosis. (A) Serum ALT and AST levels (n = 4–6). (B) H&E staining of liver tissue (20×, scale bar = 50 μm). (C) Iron content (n = 4). (D) LPO content (n = 4). (E) MDA levels (n = 4). (F) Ratio of reduced GSH to GSSG (n = 4). (G) Content of total GSH (n = 4). (H) Protein expression of SLC7A11, GPX4, FTH1, and HO-1 (n = 5). *P < 0.05, **P < 0.01 and ***P < 0.001 between any two groups. ns means no statistical difference
Fig. 6
Fig. 6
Lipidomics analysis revealed the effects of TP intervention and Nrf2 gene deletion on hepatic lipid metabolism. (A) Lipid Class pie chart: percentage of lipid subclasses in the WT group (The lipid composition in terms of types and proportions is similar among the different groups, so only the WT group was shown). (B) Multivariate statistical analysis: OPLS-DA (Orthogonal Projections to Latent Structures Discriminant Analysis) score plot. (C) Venn diagram showing the intersection of (WT + TP vs WT) and (Nrf2−/− + TP vs Nrf2−/−). (D) Differential lipid class classification heatmap. Quantitative value in the figure is shown by different color. The redder the color, the higher the expression level, and the bluer the lower expression level. The column on the right represents the number of shared lipids. (E) Volcano Plot about WT + TP vs WT. The top 10 lipids with the most significant upregulation or downregulation are labeled. (F) Volcano Plot about Nrf2−/− + TP vs Nrf2−/−. The top 10 lipids with the most significant upregulation or downregulation are labeled. (G) Cluster heat map of PEs. (H) Abundance of PUFA-PEs and MUFA-PEs. (I) Abundance of PEs containing (20:4) or (22:4). *P < 0.05, **P < 0.01 and ***P < 0.001 between any two groups. ns means no statistical difference. Abbreviation: Wax Ester (WE); Acylcarnitine (AcCa); Carboxylic Ester (CarE); Monoglyceride (MG); Phosphatidylserine (PS); Diacylglycerol (DG); Triacylglycerol (TG); Bis(methyl)phosphatidylethanolamine (BisMePE); Cardiolipin (CL); Phosphatidylethanol (PEt); Phosphatidylinositol phosphate (PIP); Digalactosyldiacylglycerol (DGDG); Lysophosphatidic Acid (LPA); Cholesterol Ester (ChE); Phosphatidylcholine (PC); Phosphatidylglycerol (PG); Sphingosine (SPH); Ceramide (Cer); Sphingomyelin (SM); Phosphocholine Sphingomyelin (phSM); Monogalactosyldiacylglycerol (MGDG); Phosphatidylethanolamine (PE); Lysophosphatidylethanolamine (LPE); Biotinylated Phosphatidylethanolamine (BiotinylPE); Phosphatidylinositol (PI); Fatty Acid (FA); Lysophosphatidylcholine (LPC); Lysolipid Dimethyl Phosphatidylethanolamine (LdMePE); Ceramide Glycan 3-N-acetylglucosamine (CerG3GNAc); Platelet-Activating Factor (PAF); Lysophosphatidylglycerol (LPG); Sulfoquinovosyl Diacylglycerol (SQDG); Dimethyl Phosphatidylethanolamine (dMePE); Lysobisphosphatidic Acid (LBPA); Phosphatidic Acid (PA); Ganglioside (GM3); Methyl phosphatidylcholine (MePC); Bis(monoacyl)phosphatidic Acid (BisMePA); Hexosylceramide (HexCer)
Fig. 7
Fig. 7
Nrf2 overexpression alleviated TP-induced ferroptosis. (A) The transfection efficiency of the Nrf2 overexpression plasmid was validated via western blot analysis. n = 3, ***P < 0.001 vs. Control group. ###P < 0.001 vs. Vector group. (B) Determination of iron content. (C) MDA levels. (D) Protein expression levels of SLC7A11, GPX4, FTH1, HO-1 and Nrf2 in AML12 cells. (E) Protein expression levels of ACSL4 and LPCAT3 in AML12 cells. (F) mRNA expression levels of ALOX15, ALOX12, ALOX8, ALOX5, LPCAT1and LPCAT3 in AML12 cells. n = 3, *P < 0.05, **P < 0.01 and ***P < 0.001 vs. Vector group. #P < 0.05, ##P < 0.01 and ###P < 0.001 vs. TP + Vector group
Fig. 8
Fig. 8
The interaction between TP and Nrf2 protein. (A) CESTA was used to assess the thermal stability of Nrf2 protein upon the presence of TP. (B) AML12 cells were treated with TP for 24 h and CHX were added for the indicated time period before harvest. Nrf2 protein level was detected by western blot. (C) AML12 cells were treated with TP for 24 h and MG132 were added for the indicated time period before harvest. Nrf2 protein level was detected by western blot. (D) IP was performed to assess the effect of TP on the ubiquitination of Nrf2
Fig. 9
Fig. 9
Diagram of possible molecular mechanisms of triptolide-induced liver injury triggered by ferroptosis

References

    1. Aldosary BM, Sutter ME, Schwartz M, Morgan BW. Case series of selenium toxicity from a nutritional supplement. Clin Toxicol (Phila). 2012;50:57–64. - PubMed
    1. Anandhan A, Dodson M, Schmidlin CJ, Liu P, Zhang DD. Breakdown of an ironclad defense system: the critical role of NRF2 in mediating ferroptosis. Cell Chem Biol. 2020;27:436–47. - PMC - PubMed
    1. Andrade RJ, Chalasani N, Bjornsson ES, Suzuki A, Kullak-Ublick GA, Watkins PB, Devarbhavi H, Merz M, Lucena MI, Kaplowitz N, Aithal GP. Drug-induced liver injury. Nat Rev Dis Primers. 2019;5:58. - PubMed
    1. Baird L, Swift S, Lleres D, Dinkova-Kostova AT. Monitoring Keap1-Nrf2 interactions in single live cells. Biotechnol Adv. 2014;32:1133–44. - PMC - PubMed
    1. Bao WD, Pang P, Zhou XT, Hu F, Xiong W, Chen K, Wang J, Wang F, Xie D, Hu YZ, Han ZT, Zhang HH, Wang WX, Nelson PT, Chen JG, Lu Y, Man HY, Liu D, Zhu LQ. Loss of ferroportin induces memory impairment by promoting ferroptosis in Alzheimer’s disease. Cell Death Differ. 2021;28:1548–62. - PMC - PubMed

Publication types

MeSH terms

LinkOut - more resources