. 2024 Nov 12;121(46):e2405020121.
doi: 10.1073/pnas.2405020121. Epub 2024 Nov 6.

Dilated cardiomyopathy-associated skeletal muscle actin (ACTA1) mutation R256H disrupts actin structure and function and causes cardiomyocyte hypocontractility

Affiliations

Dilated cardiomyopathy-associated skeletal muscle actin (ACTA1) mutation R256H disrupts actin structure and function and causes cardiomyocyte hypocontractility

Ankit Garg et al. Proc Natl Acad Sci U S A. .

Abstract

Skeletal muscle actin (ACTA1) mutations are a prevalent cause of skeletal myopathies consistent with ACTA1's high expression in skeletal muscle. Rare de novo mutations in ACTA1 associated with combined cardiac and skeletal myopathies have been reported, but ACTA1 represents only ~20% of the total actin pool in cardiomyocytes, making its role in cardiomyopathy controversial. Here we demonstrate how a mutation in an actin isoform expressed at low levels in cardiomyocytes can cause cardiomyopathy by focusing on a unique ACTA1 variant, R256H. We previously identified this variant in a family with dilated cardiomyopathy, who had reduced systolic function without clinical skeletal myopathy. Using a battery of multiscale biophysical tools, we show that R256H has potent effects on ACTA1 function at the molecular scale and in human cardiomyocytes. Importantly, we demonstrate that R256H acts in a dominant manner, where the incorporation of small amounts of mutant protein into thin filaments is sufficient to disrupt molecular contractility, and that this effect is dependent on the presence of troponin and tropomyosin. To understand the structural basis of this change in regulation, we resolved a structure of R256H filaments using cryoelectron microscopy, and we see alterations in actin's structure that have the potential to disrupt interactions with tropomyosin. Finally, we show that ACTA1R256H/+ human-induced pluripotent stem cell cardiomyocytes demonstrate reduced contractility and sarcomeric organization. Taken together, we demonstrate that R256H has multiple effects on ACTA1 function that are sufficient to cause reduced contractility and establish a likely causative relationship between ACTA1 R256H and clinical cardiomyopathy.

Keywords: actin; cardiomyopathy; contractility; muscle.


Conflict of interest statement

Competing interests statement:The authors declare no competing interest.

Figures
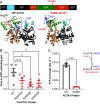
Fig. 1.
Fig. 1.
Simulations of G-ACTA1 R256H predict decreased nucleotide binding stability which is corroborated by decreased nucleotide exchange rates. (A) (Top) Cartoon representing the domain architecture of ACTA1 with individual subdomains (“SD”) colored to correspond to colors seen throughout the figure. The position of the R256H mutation is indicated in red. (Bottom) Representative single frame captures from molecular dynamics simulations of the ACTA1 1J6Z starting structure in the WT (Left) and R256H mutated (Right) states. Shown in the red dashed box is the 256 residue and in the blue dashed box is the ADP nucleotide. Note the loss of ADP from the binding pocket in R256H. (B) R256H ACTA1 binding time to ADP is shorter than WT ACTA1. Binding time is defined as the amount of time that the ADP molecule lies within 20 Å of the center of mass of ACTA1. Data are obtained from five 1 μs simulations. *P < 0.05 as calculated by ANOVA with multiple comparison testing followed by Dunnett correction. (C) R256H ACTA1 exchanges ATP slower than WT ACTA1. (Top) Outline of ATP exchange assay. Fluorescent signal increases as ADP is displaced and ATP binds to G-ACTA1. (Bottom) ATP exchange rates that were calculated from the slopes of three separate replicates per condition found in SI Appendix, Fig. S3. For WT, k = 0.014 s−1 and for R256H k = 0.0013 s−1. ***P < 0.001 as calculated by a two-tailed t test. All error bars represent SEM.
Fig. 2.
Fig. 2.
R256H ACTA1 has decreased thermal stability and disrupted polymerization. (A) (Left graph) Normalized fluorescence generated from melting WT and R256H proteins using Thermo Fisher Scientific Protein Thermal Shift™ assay. As protein denatures, the dye binds previously inaccessible hydrophobic regions resulting in increased fluorescence signal. Six traces are present for each sample, but not all six traces are visible due to high similarity between data. (Right graph) Calculated melting temperature. The experiment was performed in triplicate from two independently purified sets of ACTA1 WT and R256H protein (n = 6 for each sample). ****P < 0.0001 by the two-tailed t test. Note that error bars are present but not visible due to small size. (B) Representative traces of pyrene polymerization assays performed at various actin monomer concentrations for WT and R256H ACTA1 (each number above each curve denotes concentration in μM). Fluorescence signal increases as actin polymerizes. Note the substantial difference in the kinetics of polymerization between WT and R256H. These are quantified in the proceeding panels as differences in (C) observed linear growth rate and time to half maximum intensity. These values were derived from the regions shown in cyan shown in “B.” N = 4-7 and the individual traces used to derive the data in “C” are shown in SI Appendix, Fig. S4. *P < 0.05, **P < 0.01, ***P < 0.001, and ****P < 0.0001 as calculated by the two-tailed t test with Welch’s correction for unequal variance. (D) R256H ACTA1 has decreased nucleation and filament growth rate at 2 μM G-actin. (Left graph) Number of filaments detected per unit time was used to calculate the nucleation rate using the Fiji plugin, FilamentDetector. Data obtained from 10 to 15 different focal fields from 2 to 3 replicates per condition. R2 for WT is 0.9853 and for R256H is 0.9924. (Middle images) R256H ACTA1 filaments are fewer in number and shorter in length. Image Insets are examples of fluorescent filaments at 1,000 s. Note that images were postprocessed for visualization purposes and used for manual filament measurements but not for automated tracking of number of filaments for calculating nucleation rate. (Right graph) Filament length measured by line segment analysis for 100 filaments per protein condition in ImageJ. Length converted to subunits based on approximately 370 actin subunits in 1 µm (23). R2 for WT is 0.9970 and for R256H is 0.8741. For both graph slopes, ****P < 0.0001 by simple linear regression analysis in GraphPad Prism. Full focal field can be found in SI Appendix, Fig. S5. Scale bar represents 5 μm. All error bars represent SEM.
Fig. 3.
Fig. 3.
ACTA1 R256H filaments have inhibited translocation by myosin only in the presence of Tn/Tm without affecting calcium sensitivity. (A) In vitro motility of either 100% WT or 100% R256H ACTA1 filaments with porcine cardiac myosin. Cartoons to the Right of graphs are shown for conceptual visualization of the experiment. (Left column pair) In the absence of Tn/Tm, myosin freely translocates actin. There is no difference in speed between WT and R256H ACTA1 filaments. (Middle column pair) In the presence of Tn/Tm and under low calcium conditions, both WT and R256H ACTA1 filament speeds are arrested. This means that R256H ACTA1 filaments are capable of regulation by Tn/Tm. (Right column pair) In the presence of Tn/Tm and high calcium conditions, WT ACTA1 filament speeds are restored, but R256H ACTA1 filament speeds remain inhibited. N = 9 for all conditions representing the average speed of all filaments in three focal fields quantified from three separate motility experiments. (B) Regulated in vitro motility experiments at pCa 4 (high calcium) of filaments containing various concentrations of ACTA1 R256H. As the concentration of ACTA1 R256H increases, the speed of filament translocation decreases. Note that 100% R256H data is reproduced from Fig. 3A. 100% WT from Fig. 3A is also reproduced but combined with additional replicates. N = 18 for WT and 50% R256H while N = 9 for all other conditions from 3 to 6 motility experiments. *P < 0.05, **P < 0.01, ***P < 0.001, and ****P < 0.0001 as calculated by one-way ANOVA followed by multiple comparisons of every condition with either Šidák correction (A) or Tukey correction (B) as recommended by GraphPad Prism. Normalized speed means min/max normalization across all conditions. (C) pCa-speed response curves for 100% WT, 12.5% R256H ACTA1, and 25% R256H ACTA1 filaments. Data were fit with the Hill equation. Each point represents N = 6 from two motility experiments. Absolute speeds are shown to demonstrate differences in maximum speed which are calculated as WT 567 nm/s (95% CI 437 to 698 nm/s), 12.5% R256H 501 nm/s (95% CI 408 to 595 nm/s), 25% R256H 287 nm/s (95% CI 408 to 595 nm/s). These differences are better demonstrated in the experiment in Fig. 3B. (D) Calcium sensitivity is unchanged for mutant-containing filaments. WT, 12.5% R256H, and 25% R256H pCa50 are 5.3 (95% CI 5.1 to 5.5), 5.3 (95% 5.1 to 5.5), and 5.3 (95% CI 5.1 to 5.5). Cooperativity has similarly overlapping 95% CI: WT cooperativity is 5.0 (95% CI 1.2 to 8.9), 12.5% R256H cooperativity is 7.2 (95% CI −0.2 to 14.6), and 25% R256H cooperativity is 12.1 (95% CI −7.1 to 31.5). Lines fit to the Hill equation have adjusted R2 of 0.89 for WT, 0.93 for 12.5% R256H, and 0.93 for 25% R256H. “Normalized*” indicates min-max normalization within each condition as opposed to across all datasets as for other normalized data in figure.
Fig. 4.
Fig. 4.
R256H ACTA1 alters position of ACTA1 K240 which may disrupt interaction with Tpm E117. (A) WT and R256H ACTA1 have similar structures. Shown are cryo-EM densities at the 3σ contour level and superimposed atomic models rendered as cartoons for WT and R256H ACTA1. The cryo-EM densities of WT and R256H ACTA1 have substantial overlap as seen in the “Combined” figure. (B) Focused view of WT and R256H ACTA1 256 residue and K240 residue which are rendered as sticks while the remainder of the peptide backbone is rendered as a cartoon. The wire mesh represents the 5σ contour level of electron density surrounding each respective residue. Note how R256H ACTA1 K240 moves closer in proximity to His256 such that there is overlapping electron density between the two residues (green arrow) which is not present in WT ACTA1. (C) The change in Lys240 in R256H ACTA1 is predicted to cause an increase in distance between ACTA1 K240 and Tpm E117. Shown is the approximate position of tropomyosin E117 after aligning our atomic model to 8EFI which contains a high-resolution structure of F-actin bound by myosin in rigor in the presence of Tpm. We show only the Tpm strand that interacts with ACTA1 K240 for clarity.
Fig. 5.
Fig. 5.
ACTA1R256H/+ hPSC-CMs exhibit reduced force without a change in calcium flux but have disordered sarcomeres. (A) Representative force trace of a single paced WT and ACTA1R256H/+ hPSC-CM (referred to as “R256H”) demonstrating reduced force produced by mutant cells as determined by traction force microscopy. (B) Summary of quantified force (WT mean force 155.2 nN vs. R256H mean force 82.3 nN) and (C) area (WT mean 1,280 μm2 vs. R256H mean area 1,310 μm2) for individual hPSC-CMs. ****P < 0.0001 as calculated by the two-tailed nonparametric Mann–Whitney t test. WT N = 139 and R256H N = 149 from at least three separate differentiations. (D) Representative Ca2+ traces using FLUOFORTE from cells paced at 1 Hz. Dashed lines denote the time values quantified for (E) the total time of calcium transient (Ttot) with WT mean of 750 ms and R256H mean of 777 ms. (F) Calcium flux (integral of ΔF/F0 signal) is not different. WT N = 120 and R256H N = 226 from at least two separate differentiations. ****P < 0.0001 as calculated by nonparametric Mann–Whitney and parametric t tests for “E” and “F” respectively. “GP-value calculated by the parametric t test. Note that points for “E” and “G” are spread horizontally to try to minimize overlap. (G) Examples of patterned hiPSC-CMs stained for different structures. ACTA1-specific antibody is validated in SI Appendix, Fig. S2C. Phalloidin binds all polymerized actin (F-actin). (Scale bar, 25 μm.) (H) Sarcomere alignment scores processed from phalloidin images using SotaTool. WT mean alignment score of 0.080 and R256H mean alignment score 0.032. A higher score corresponds to more alignment of Z-discs within the cell. WT N = 99 and R256H N = 258 from at least two separate differentiations. ****P < 0.0001 calculated by the nonparametric Mann–Whitney t test. All error bars represent SEM though some are not visible due to the high density of points. Mutant cell data obtained from two separate clones, and the separated data can be found in SI Appendix, Fig. S8.

Update of

Similar articles

Cited by

References

    1. Hsich E. M., et al. , Heart transplantation: An in-depth survival analysis. JACC Heart Fail 8, 557–568 (2020). - PMC - PubMed
    1. McNally E. M., Mestroni L., Dilated cardiomyopathy: Genetic determinants and mechanisms. Circ. Res. 121, 731–748 (2017). - PMC - PubMed
    1. Escobar-Lopez L., et al. , Association of genetic variants with outcomes in patients with nonischemic dilated cardiomyopathy. J. Am. Coll. Cardiol. 78, 1682–1699 (2021). - PubMed
    1. Garg A., Lavine K. J., Greenberg M. J., Assessing cardiac contractility from single molecules to whole hearts. JACC: Basic Transl. Sci. 9, 414–439 (2023). - PMC - PubMed
    1. Burke M. A., Cook S. A., Seidman J. G., Seidman C. E., Clinical and mechanistic insights into the genetics of cardiomyopathy. J. Am. Coll. Cardiol. 68, 2871–2886 (2016). - PMC - PubMed

LinkOut - more resources