. 2024 Nov 12;121(46):e2321501121.
doi: 10.1073/pnas.2321501121. Epub 2024 Nov 6.

Cholinergic regulation of dendritic Ca2+ spikes controls firing mode of hippocampal CA3 pyramidal neurons

Affiliations

Cholinergic regulation of dendritic Ca2+ spikes controls firing mode of hippocampal CA3 pyramidal neurons

Noémi Kis et al. Proc Natl Acad Sci U S A. .

Abstract

Active dendritic integrative mechanisms such as regenerative dendritic spikes enrich the information processing abilities of neurons and fundamentally contribute to behaviorally relevant computations. Dendritic Ca2+ spikes are generally thought to produce plateau-like dendritic depolarization and somatic complex spike burst (CSB) firing, which can initiate rapid changes in spatial coding properties of hippocampal pyramidal cells (PCs). However, here we reveal that a morpho-topographically distinguishable subpopulation of rat and mouse hippocampal CA3PCs exhibits compound apical dendritic Ca2+ spikes with unusually short duration that do not support the firing of sustained CSBs. These Ca2+ spikes are mediated by L-type Ca2+ channels and their time course is restricted by A- and M-type K+ channels. Cholinergic activation powerfully converts short Ca2+ spikes to long-duration forms, and facilitates and prolongs CSB firing. We propose that cholinergic neuromodulation controls the ability of a CA3PC subtype to generate sustained plateau potentials, providing a state-dependent dendritic mechanism for memory encoding and retrieval.

Keywords: CA3 pyramidal neurons; cholinergic regulation; dendritic Ca2+ spike; hippocampus.


Conflict of interest statement

Competing interests statement:The authors declare no competing interest.

Figures
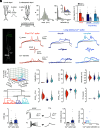
Fig. 1.
Fig. 1.
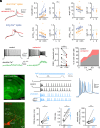
Heterogeneity of compound dendritic Ca2+ spikes in CA3PCs (A) Schematic illustration of the two types of dendritic Ca2+ spikes activated in individual branches (Left) and the experimental approach to assess their combined activation (Right). (B) 2P collapsed z-stack of a CA3PC loaded with 50 μM Alexa Fluor 594 and 100 μM OGB-1. Position of the Ca2+ imaging line is indicated in green. (C) Experimental protocol to evoke compound Ca2+ spikes: 1-s-long somatic current injections (Iinj) with variable amplitudes were applied in the presence of 1 μM TTX (see also SI Appendix Fig. 1). (D) Examples of compound Ca2+ spike types evoked by somatic Iinj in three different CA3PCs. Top: somatic voltage response to subthreshold and two different levels of suprathreshold Iinj; Middle, dV/dt of the color-matched Ca2+ spike enlarged; Bottom, Ca2+ signals corresponding to the voltage traces measured on a distal dendrite with OGB-1. (E) Distribution of the amplitude (Left) and the halfwidth (Right) of compound Ca2+ spikes (n = 317 cells). The inset shows the log10 (halfwidth) values that segregate to two distinct groups. (F) Summary of Ca2+ spike-associated dendritic Ca2+ signal amplitudes measured >300 μm from the soma. Data are shown separately for cells loaded with the high-affinity dye OGB-1 (empty bars) or the low-affinity dye OGB-6F (striped bars). Dots represent individual data points, bar graphs show mean ± SEM (OGB-1 short: n = 59, simple long-lasting: n = 26, complex long-lasting: n = 35, P = 0.097; OGB-6F short: n = 33, simple long-lasting: n = 16, complex long-lasting: n = 15, P = 0.792, Kruskal–Wallis tests). Distal dendritic Ca2+ signals were detected even with OGB-6F. (G) Hierarchical cluster analysis. Top, individual data points along the three main z-scored parameters; Bottom, dendrogram of n = 317 cells (152 short, 76 simple long-lasting, 89 complex long-lasting). (H) Distribution of kinetic parameters of Ca2+ spikes in all three groups. Statistical analysis showed significant differences between short (n = 152 cells) and long (simple and complex pooled, n = 165 cells) Ca2+ spikes (dV/dtmax: P < 0.001; dV/dtmin: P < 0.001; amplitude: P < 0.001; halfwidth: P < 0.001; threshold: P = 0.004; N of peaks: P < 0.001; Mann–Whitney test). Note the small effect size for threshold comparison (1.84 mV difference). (I) CSB rate (at 600 pA Iinj) in cells with short (n = 62) and long-lasting (n = 75) Ca2+ spikes (P = 0.002, Mann–Whitney test). Gray open circles: individual cells; box: interquartile interval; line: median; black filled circle: mean; whiskers: 10 to 90%. (J) Left, examples of CSBs with different kinetics in ACSF and the corresponding Ca2+ spike types after TTX application (segments cut from 1-s-long Iinj steps). Middle, CSB duration in cells with short (n = 11) and long-lasting (n = 52) Ca2+ spikes (P < 0.001, Mann–Whitney test). Box plot as in I. Right, relationship between CSB duration and Ca2+ spike halfwidth (n = 63, Spearman R = 0.564, P < 0.001).
Fig. 2.
Fig. 2.
Morpho-topographic correlates of Ca2+ spike heterogeneity (A) Schematic showing the measurement of proximodistal position (Top) and primary apical trunk length (Bottom). (B) Correlation of average primary apical trunk length and soma depth from the border of str. lucidum in distal (red, relative proximodistal position: 0.4 to 1; Spearman R = 0.748, P < 0.001, n = 94) and proximal (green, relative proximodistal position ≤0.3; Spearman R = 0.556, P < 0.001, n = 68) CA3PCs. Note that the deepest distal CA3PCs often have particularly long primary trunks due to late bifurcation in str. lucidum. (C) Distribution of the Ca2+ spike clusters with relative proximodistal position along CA3 and with mean primary apical dendrite length. Dots represent individual cells (n = 298) color-coded for clusters (orange: short; deep blue: simple long-lasting; light blue: complex long-lasting). (D) Difference in primary apical dendrite length between CA3PCs with short and long-lasting Ca2+ spikes in the distal CA3 subregion. Kruskal–Wallis test: P < 0.001; post hoc multiple comparisons test: short vs simple long: P < 0.001, short vs complex long: P < 0.001, simple long vs complex long: P = 1. (E) Fraction of cells with 1 or more than 1 primary dendrites. Data are shown separately for cells with different Ca2+ spike types. (short (s): n = 148, long simple (ls): n = 70, long complex (lc): n = 80). (F) Number of apical dendritic intersections at different distances from the soma (Sholl analysis, n = 211 cells). Mixed ANOVA: P < 0.001 for distance, P < 0.001 for cluster, P < 0.001 for interaction. Post hoc Tukey’s test indicates difference between short vs long simple and short vs long complex cells (***P < 0.001) at 100, 150, and 200 μm distances, but no significant difference at any distance between the two long clusters (P > 0.890 for all comparisons). (G) Number of apical dendritic intersections at 150 μm from the soma as a function of the relative proximodistal position along CA3. Colors indicate the Ca2+ spike cluster label of the neurons (n = 211 cells, color code as in C). (H) Classification accuracy (mean and SD across 10-fold cross validation groups; SI Appendix) for predicting Ca2+ spike type (short- or long-duration) based on topographic position (proximodistal position along CA3 and radial depth from str. lucidum), neuronal morphology (number and length of trunk, Sholl intersections), or both (n = 132 cells). There is no significant difference between the groups (Friedman test, P = 0.52). The red dashed line represents chance level. (I) 2P z-stack of a long-shafted deep distal CA3PCs filled with Alexa Fluor 594 and biocytin. (J) Confocal maximum intensity projection images of the cell in I. White box on the Left indicates the location of the enlarged apical dendritic area on the Right. Note the thorny excrescences along the trunk. Boxed areas are shown at higher magnification in K. (K) STED microscopy images of thorny excrescences of the cell in I and J. (LN) Same as IK for another long-shafted deep distal CA3PCs filled with Alexa Fluor 594 and biocytin. (O) 2P z-stack of a short-shafted proximal CA3PCs filled with Alexa Fluor 594 and biocytin. (P) Confocal image of the apical trunk of the cell in O. Note the clusters of TEs on the primary and secondary apical trunks. Boxed areas are shown at higher magnification in Q. (Q) STED microscopy image sections of thorny excrescence clusters of the cell in O and P.
Fig. 3.
Fig. 3.
Ion channels underlying diverse Ca2+ spike forms (A) Example recordings of short (Left) and long-lasting (Right) Ca2+ spikes in TTX before (black control) and 10 to 20 min after (red) bath application of the L-type VGCC inhibitor nimodipine (20 μM, Top) or nifedipine (10 μM, Bottom). Segments are cut from 1-s-long Iinj steps. (B) Summary of the effect of various VGCC-type inhibitors on the amplitude (Top) and dV/dtmax (Bottom) of short (orange) and long-lasting (blue) Ca2+ spikes. Thin lines represent individual experiments before (ctr) and after (inh) application of VGCC inhibitors; connected symbols show mean ± SEM. Abolished spikes are represented by values of 0. TTA-P2: n = 6 short, n = 6 long spike; SNX-482: n = 5 short, n = 8 long; ω-CTX MVIIC: n = 5 short, n = 6 long; nimodipine: n = 12 short, n = 19 long; nifedipine: n = 5 short, n = 8 long. (C) Example recordings of short (Left) and long-lasting (Middle) Ca2+ spikes in TTX, before (black control) and 10 to 20 min after (red) bath application of the A-type VGKC inhibitor AmmTx3 (2 μM, Top) or the M-type VGKC inhibitor XE991 (10 μM, Bottom). Right, combined inhibition of A- and M-type VGKCs in a cell with short Ca2+ spike. (D) Summary of the effect of various VGKC-type inhibitors on the amplitude (Top) and halfwidth (Bottom) of short (orange) and long-lasting (blue) Ca2+ spikes. Combined iberiotoxin and apamin: n = 6 short, n = 4 long; DTX: n = 4 short; GxTx: n = 8 short, n = 5 long; AmmTx3: n = 7 short, n = 5 long; XE991: n = 11 short, n = 6 long; combined AmmTx3 and XE991: n = 8 short.
Fig. 4.
Fig. 4.
Cholinergic regulation of Ca2+ spike kinetics (A) Example short (Top) and long (Bottom) Ca2+ spikes in TTX (control, black) and after application of the cholinergic agonist carbachol (CCh; red, 2 μM). (B) Effect of carbachol on short (orange, n = 9) and long-lasting (blue, n = 6) Ca2+ spike properties. *P < 0.05, **P < 0.01, Wilcoxon test. (C) Example recording in ACSF showing firing properties of a CA3PC (Top) and distal apical dendritic Ca2+ signal (Bottom) before (Left) and after (Right) application of 2 μM carbachol. Note the prolonged CSB (arrow) in the presence of carbachol, also accompanied by distal dendritic Ca2+ signal. (D) Summary of the effect of carbachol on CSB rate at different levels of Iinj. Left, Iinj threshold evoking CSB under control conditions and in carbachol (P < 0.01, Wilcoxon test). Symbols connected with lines represent individual experiments. Filled symbols, CSB was evoked at the given Iinj; open symbols, CSB was not evoked at 1.2 nA Iinj. Right, ratio of CA3PCs (total n = 10 cells) expressing CSB at different Iinj levels in control (gray) and in carbachol (red). (E) Top, widefield fluorescent image of ChR2-eYFP expression in the CA3 area in ChAT-Cre/Ai32 mice. Bottom, 2P z-stack of eYFP-ChR2 positive axons (green) surrounding a patched CA3PC loaded with Alexa Fluor 594 (red). (F) Left and Top, protocol of combined photostimulation and Iinj. Bottom, representative voltage responses to somatic Iinj in a CA3PC without (black) and with (blue) photostimulation of ChR2. Two traces for CSB comparison are shown overlaid on the Right. (G) Summary of the effect of photostimulation on CSB duration (Left, n = 7 cells with CSB, P < 0.05, Wilcoxon test), CSB rate (Middle, n = 11, P < 0.05, Wilcoxon test), and AP frequency measured at steady-state firing during the 400 to 600 ms segment of the depolarization step (Right, n = 10 cells exhibiting regular steady-state AP firing, P < 0.01, Wilcoxon test).

Similar articles

References

    1. Gasparini S., Migliore M., Magee J. C., On the initiation and propagation of dendritic spikes in CA1 pyramidal neurons. J. Neurosci. 24, 11046–11056 (2004). - PMC - PubMed
    1. Major G., Polsky A., Denk W., Schiller J., Tank D. W., Spatiotemporally graded NMDA spike/plateau potentials in basal dendrites of neocortical pyramidal neurons. J. Neurophysiol. 99, 2584–2601 (2008). - PubMed
    1. Makara J. K., Magee J. C., Variable dendritic integration in hippocampal CA3 pyramidal neurons. Neuron 80, 1438–1450 (2013). - PMC - PubMed
    1. Schiller J., Schiller Y., Stuart G., Sakmann B., Calcium action potentials restricted to distal apical dendrites of rat neocortical pyramidal neurons. J. Physiol. 505, 605–616 (1997). - PMC - PubMed
    1. Golding N. L., Jung H. Y., Mickus T., Spruston N., Dendritic calcium spike initiation and repolarization are controlled by distinct potassium channel subtypes in CA1 pyramidal neurons. J. Neurosci. 19, 8789–8798 (1999). - PMC - PubMed

LinkOut - more resources