. 2024 Nov 4;65(13):8.
doi: 10.1167/iovs.65.13.8.

Single-Cell Multiomics Profiling Reveals Heterogeneity of Müller Cells in the Oxygen-Induced Retinopathy Model

Affiliations

Single-Cell Multiomics Profiling Reveals Heterogeneity of Müller Cells in the Oxygen-Induced Retinopathy Model

Xueming Yao et al. Invest Ophthalmol Vis Sci. .

Abstract

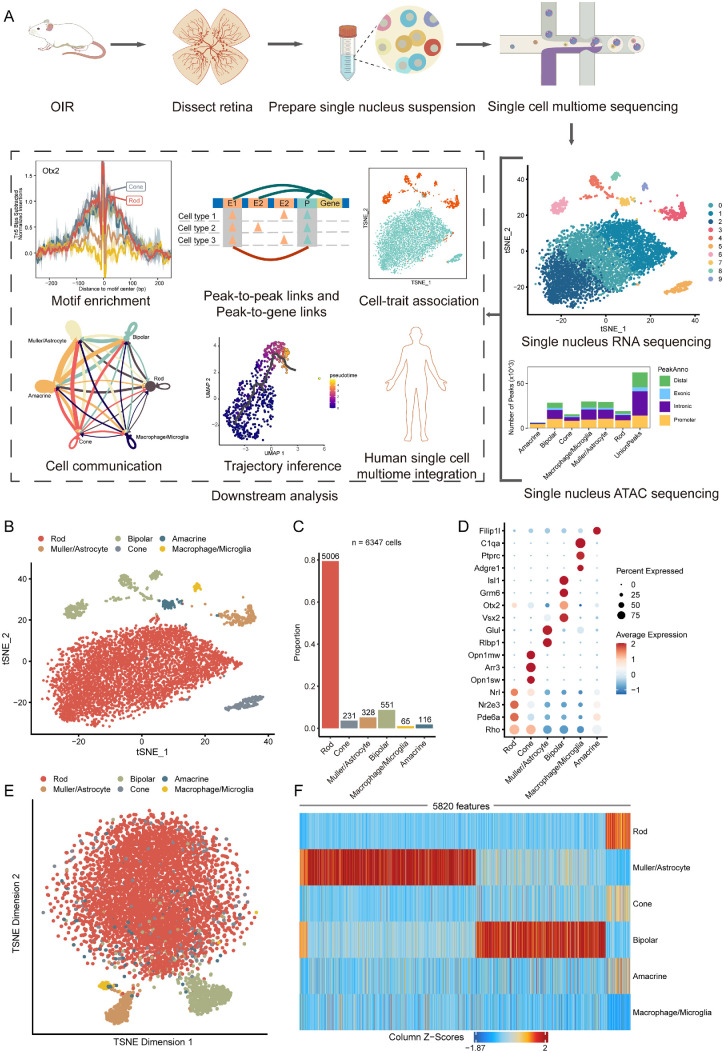
Purpose: Retinal neovascularization poses heightened risks of vision loss and blindness. Despite its clinical significance, the molecular mechanisms underlying the pathogenesis of retinal neovascularization remain elusive. This study utilized single-cell multiomics profiling in an oxygen-induced retinopathy (OIR) model to comprehensively investigate the intricate molecular landscape of retinal neovascularization.

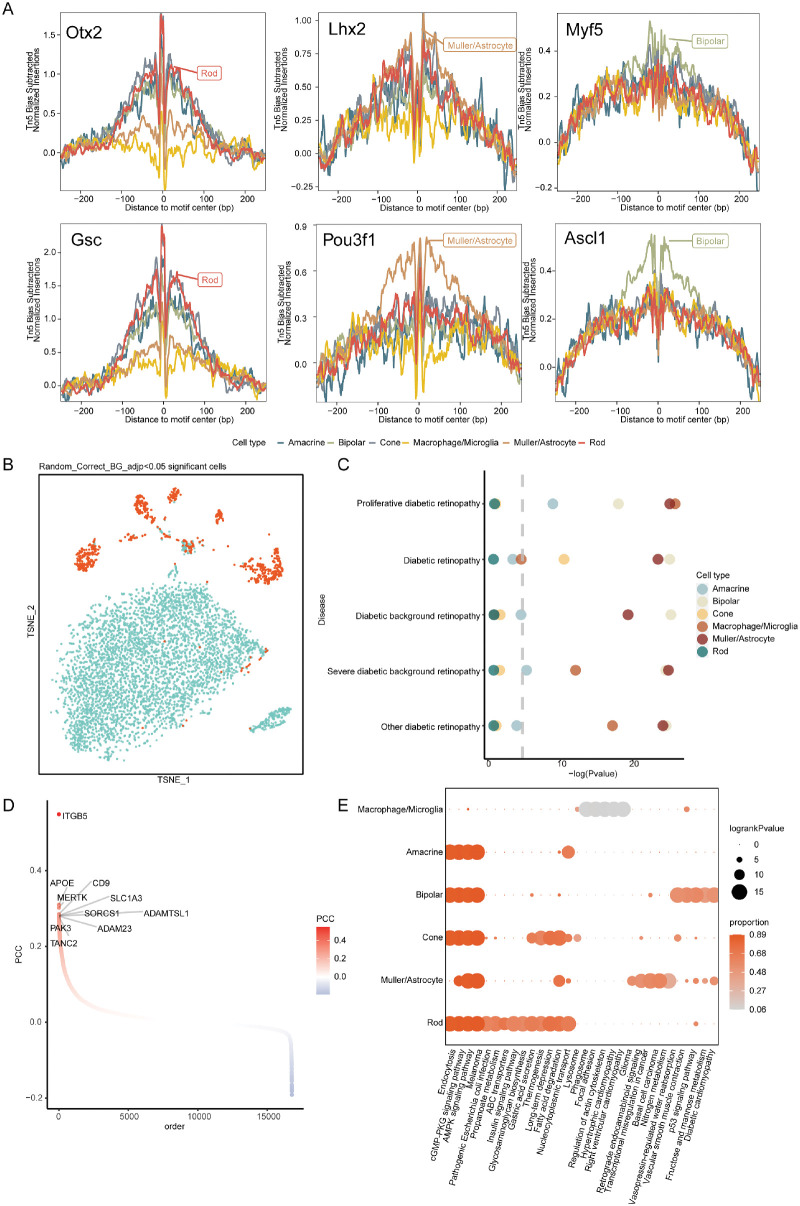
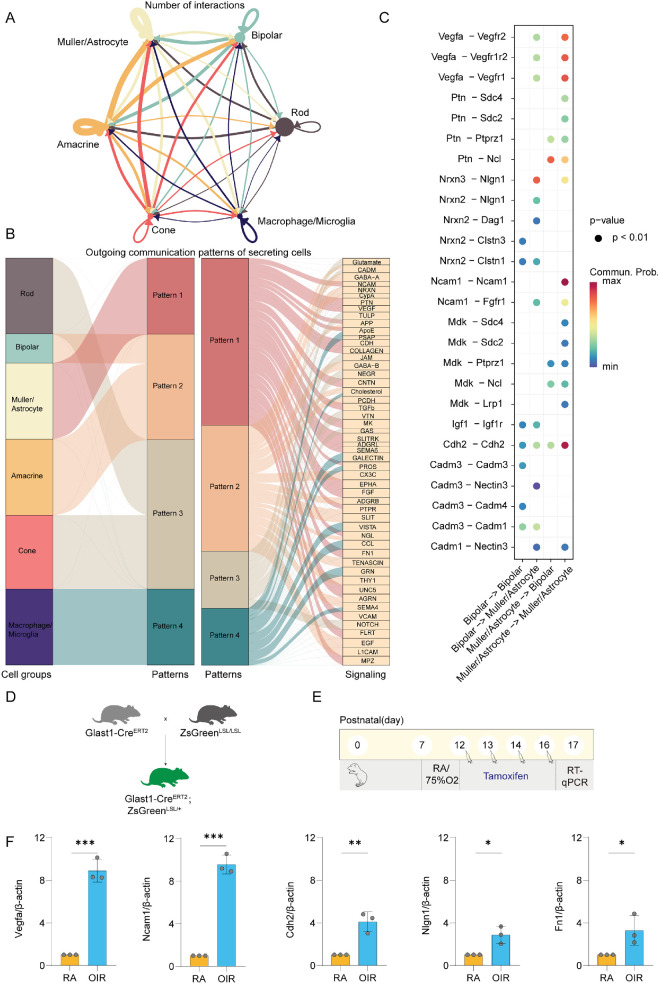
Methods: Mice were exposed to hyperoxia to induce the OIR model, and retinas were isolated for nucleus isolation. The cellular landscape of the single-nucleus suspensions was extensively characterized through single-cell multiomics sequencing. Single-cell data were integrated with genome-wide association study (GWAS) data to identify correlations between ocular cell types and diabetic retinopathy. Cell communication analysis among cells was conducted to unravel crucial ligand-receptor signals. Trajectory analysis and dynamic characterization of Müller cells were performed, followed by integration with human retinal data for pathway analysis.

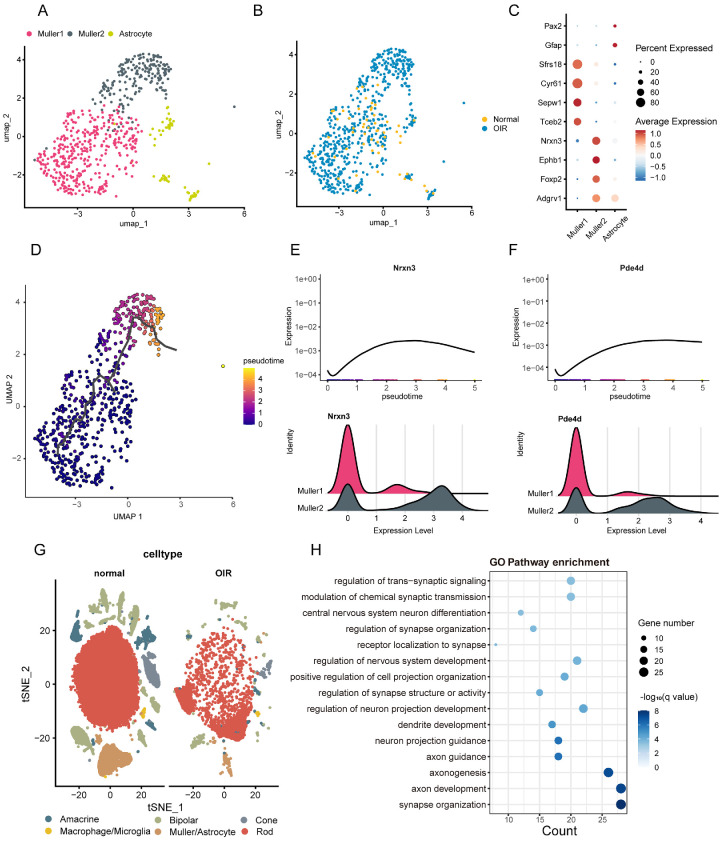
Results: The multiomics dataset revealed six major ocular cell classes, with Müller cells/astrocytes showing significant associations with proliferative diabetic retinopathy (PDR). Cell communication analysis highlighted pathways that are associated with vascular proliferation and neurodevelopment, such as Vegfa-Vegfr2, Igf1-Igf1r, Nrxn3-Nlgn1, and Efna5-Epha4. Trajectory analysis identified a subset of Müller cells expressing genes linked to photoreceptor degeneration. Multiomics data integration further unveiled positively regulated genes in OIR Müller cells/astrocytes associated with axon development and neurotransmitter transmission.

Conclusions: This study significantly advances our understanding of the intricate cellular and molecular mechanisms underlying retinal neovascularization, emphasizing the pivotal role of Müller cells. The identified pathways provide valuable insights into potential therapeutic targets for PDR, offering promising directions for further research and clinical interventions.


Conflict of interest statement

Disclosure: X. Yao, None; Z. Li, None; Y. Lei, None; Q. Liu, None; S. Chen, None; H. Zhang, None; X. Dong, None; K. He, None; J. Guo, None; M.J. Li, None; X. Wang, None; H. Yan, None

Figures

Figure 1.
Figure 1.
Overview of single-cell multiomic profiling in OIR model retinal cells. (A) Comprehensive workflow schematic from the OIR model to multiomic data analysis. It begins with the dissection of retinas, followed by preparation of single nucleus suspensions, and then continues through single-cell multiome sequencing. The subsequent analyses are depicted, including motif enrichment analysis to identify regulatory DNA motifs, peak-to-peak and peak-to-gene linkage to connect regulatory elements with their target genes, cell communication networks to illustrate interactions between cell types, trajectory inference for understanding cellular differentiation paths, and the integration of human single-cell multiome data to draw comparisons and validate findings. (B) A t-Distributed Stochastic Neighbor Embedding (t-SNE) visualization of snRNA-seq clusters. Each point represents a cell, and colors denote cell types. (C) Bar plot illustrating cell composition. Different colors represent distinct cell types, with numbers above bars indicating cell counts. (D) Dot plot showing expression levels and proportions of marker genes for major cell types. Dot colors indicate expression levels, and sizes represent the proportion of cells expressing the respective marker gene. (E) t-SNE plot utilizing snATAC-seq data for dimensionality reduction, with cell annotations derived from snRNA-seq. Each point represents a cell, and colors denote cell types. (F) Heatmap of 5820 snATAC-seq marker peaks across all retinal cell clusters. Color reflects the column Z score of normalized accessibility, with red indicating higher accessibility and blue indicating lower accessibility.
Figure 2.
Figure 2.
Footprinting analysis and cell trait association analysis. (A) Footprinting analysis of selected TFs across different cell types. Footprints were adjusted for Tn5 insertion bias by subtracting the Tn5 insertion signal from the footprinting signal. (B) t-SNE visualization of cell trait association results, displaying adjusted P values after background correction for trait-relevant scores of each cell. Cells with an adjusted P < 0.05 are depicted in red, and those with an adjusted P > 0.05 are shown in cyan. The PDR GWAS summary statistics used were sourced from FinnGen. (C) Dot plot illustrating the correlation between DR GWAS traits from FinnGen and various cell types identified in snRNA-seq. The dashed line represents the Bonferroni-corrected P value threshold (P = 0.05/6). Colors correspond to different cell types. (D) Ranking of trait-relevant genes based on Pearson correlation coefficients (PCC) across all individual cells. Colors represent the PCC values, with red indicating higher positive correlations and blue indicating lower or negative correlations. (E) Dot plot presenting trait-relevant pathways across six ocular cell types. Dot size indicates the log-ranked P value for each pathway, and color intensity reflects the proportion of cells within each cell type genetically influenced by a given pathway.
Figure 3.
Figure 3.
Cell communication network in the OIR model retinal cells. (A) Quantification of significant ligand–receptor pairs between any two cell populations. The width of the edges is proportionate to the number of indicated ligand–receptor pairs. (B) Visualization of inferred outgoing communication patterns from secreting cells. This Sankey diagram illustrates the associations among inferred latent patterns, cell groups, and signaling pathways. The thickness of the flow indicates the contribution of the cell group or signaling pathway to each latent pattern. (C) Highlighted significant ligand–receptor pairs specifically between Müller cells/astrocytes and bipolar cells or among themselves. The color and size of the dots denote the calculated communication probability and P values. (D) Schematic representation of the genetic mouse model used in this study. Glast1-CreERT2 mice were crossed with ZsGreenLSL/LSL mice to generate Glast1-CreERT2;ZsGreenLSL/+ offspring, which express ZsGreen specifically in Müller cells upon tamoxifen induction. (E) Experimental timeline for the OIR model and RT-qPCR analysis. (F) RT-qPCR analysis of gene expression in retinal Müller cells isolated from room air (RA) and OIR mice. The bar graphs display the relative mRNA expression levels of Vegfa, Ncam1, Cdh2, Ngfr, and Flt1, normalized to β-actin. Results are presented as mean ± SEM (n = 3 per group). Statistical significance is indicated as follows: *P < 0.05, **P < 0.01, ***P < 0.001, compared to the RA group.
Figure 4.
Figure 4.
Directional trajectories and positive genes of Müller cells in OIR models. (A) UMAP visualization illustrating subclusters of Müller cells/astrocytes. Each point represents a cell, and colors denote cell types. (B) UMAP visualization illustrating Müller cells/astrocytes in normal and OIR mouse retinas. Cells from normal retinas are shown in yellow, and those from OIR retinas are in blue. (C) Dot plot showing expression levels and proportions of marker genes for major cell types. Dot colors indicate expression levels, and sizes represent the proportion of cells expressing the respective marker gene. (D) Single-cell inferred pseudotime trajectory graph represented in a UMAP-based embedding. Cells are ordered along pseudotime, depicted with colors ranging from purple to yellow. (E, F) Phase portraits of genes Nrxn3 and Pde4d. The upper curve plots illustrate gene expression dynamics across various pseudotime points. The lower ridge plots display gene expression levels within Müller subtypes. (G) t-SNE plot of integrated cell groups from OIR model snRNA-seq and human snRNA-seq data. Cells are colored by their cell types. (H) Dot plot illustrating Gene Ontology (GO) enriched pathways of positive genes in the OIR model. Dot size and color correspond to gene number and –log(q value), respectively.

Similar articles

Cited by

References

    1. Wang Z, Liu CH, Huang S, Chen J.. Wnt Signaling in vascular eye diseases. Prog Retin Eye Res. 2019; 70: 110–133. - PMC - PubMed
    1. Mazzoli V, Zhong LH, Dang VT, Shi Y, Werstuck GH.. Characterization of retinal microvascular complications and the effects of endoplasmic reticulum stress in mouse models of diabetic atherosclerosis. Invest Ophthalmol Vis Sci. 2020; 61: 49. - PMC - PubMed
    1. Hartnett ME, Penn JS.. Mechanisms and management of retinopathy of prematurity. N Engl J Med. 2012; 367: 2515–2526. - PMC - PubMed
    1. Priya RR, Chew EY, Swaroop A.. Genetic studies of age-related macular degeneration: lessons, challenges, and opportunities for disease management. Ophthalmology. 2012; 119: 2526–2536. - PMC - PubMed
    1. Zhang SX, Ma JH, Bhatta M, Fliesler SJ, Wang JJ.. The unfolded protein response in retinal vascular diseases: implications and therapeutic potential beyond protein folding. Prog Retin Eye Res. 2015; 45: 111–131. - PMC - PubMed

MeSH terms