. 2024 Nov 4;65(13):12.
doi: 10.1167/iovs.65.13.12.

PINK1/Parkin-Mediated Mitophagy Ameliorates Mitochondrial Dysfunction in Lacrimal Gland Acinar Cells During Aging

Affiliations

PINK1/Parkin-Mediated Mitophagy Ameliorates Mitochondrial Dysfunction in Lacrimal Gland Acinar Cells During Aging

Han Zhao et al. Invest Ophthalmol Vis Sci. .

Abstract

Purpose: Aging alters the function of the lacrimal gland and disrupts the balance of the microenvironment on the ocular surface, eventually leading to aqueous-tear-deficient dry eye. Mitophagy has been reported to play an important role in aging, but the underlying mechanism remains unclear.

Methods: The young (6 weeks) and middle-aged (12 months) male C57BL/6J mice were used in this study, and mitophagy agonist rapamycin and inhibitor Mdivi-1 were used in in vivo experiments. Hematoxylin and eosin, Masson, Oil Red O, and reactive oxygen species (ROS) staining were used to detect histological changes and lipids in lacrimal gland. Changes in the expression of proteins were identified by Western blotting of lacrimal gland lysates. Transmission electron microscopy and immunofluorescence staining were used to assess mitophagy. The single-cell RNA sequencing (scRNA-seq) and bioinformatics analyses were used to detect transcription signature changes during aging.

Results: In this study, we discovered that aging increased oxidative stress, which increased apoptosis, and generated ROS in acinar epithelial cells. Furthermore, activation of PINK1/Parkin-mediated mitophagy by rapamycin reduced lacrimal gland ROS concentrations and prevented aging-induced apoptosis of acinar cells, thereby causing histological alterations, microstructural degradation, and increasing tear secretion associated with ROS accumulation. By contrast, Mdivi-1 aggregates mitochondrial function and thereafter leads to lacrimal gland function impairment by inhibiting mitochondrial fission and giving rise to mitophagy.

Conclusions: Overall, our findings suggested that aging could impair mitochondrial function of acinar cells, and age-related alterations may be treated with therapeutic approaches that enhance mitophagy while maintaining mitochondrial function.


Conflict of interest statement

Disclosure: H. Zhao, None; Y. Zhang, None; Y.J. Ren, None; W.P. Wan, None

Figures

Figure 1.
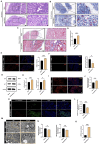
Figure 1.
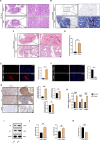
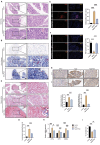
Morphological and histological assessment of control and middle-aged lacrimal gland. (A) Representative images of hematoxylin and eosin (H&E) staining in the lacrimal gland of control and middle-aged mice. (B) Representative macroscopic images of Masson staining in the lacrimal gland of control and middle-aged mice. (C) Oil Red O staining shows the lipid droplets in the lacrimal gland of control and middle-aged mice. (D) Quantitative analysis of the lacrimal gland interstitial fibrosis. (E) Immunofluorescent staining and quantifications of CD45 show immune cell infiltration in the lacrimal gland in control and middle-aged mice. (F) Immunofluorescent staining and quantifications of Ki67 show proliferative cell infiltration in the lacrimal gland in control and middle-aged mice. (G) Representative microscopic images of immunohistochemistry (IHC) of IL-1β, IL-6, and PPARγ expressions in the lacrimal gland of control and middle-aged mice. (H) The relative mRNA expression of CPT1a, CPT2, and C/EBPα in the lacrimal gland in control and middle-aged mice. (I) Western blot analysis showed the expression of p16 and p21 in lacrimal gland tissues. (J) Quantitative analysis of the levels of p16 and p21. (K) Tear secretion of each group of mice via phenol red thread test. Scale bar = 50 µm (magnified 20 µm) (A, B, C), 20 µm (E, F, G), N = 4, **P < 0.01, ***P < 0.001.
Figure 2.
Figure 2.
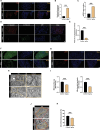
Reactive oxygen species (ROS) accumulation and mitochondrial dysfunction of the lacrimal gland in middle-aged mice. (A) Immunofluorescence staining of ROS using ROS probe (red) and DAPI (blue) in lacrimal gland tissues of control and middle-aged mice. (B) Assessment of relative fluorescence intensity of ROS staining. (C) Mitochondrial DNA (mtDNA) leakage in the lacrimal gland tissues in the different groups. (D) Immunofluorescence staining of mitochondrial membrane potential using JC-1 in lacrimal gland tissues of control and middle-aged mice. (E) Measurement of relative fluorescence intensity of JC-1 staining. (F) Representative immunofluorescence images for detecting TOMM20 (green) and DAPI (blue) of the lacrimal gland. (G) Representative immunofluorescence images for detecting LAMP-1 (red) and DAPI (blue) of the lacrimal gland. (H) Transmission electron microscopy (TEM) images of the ultrastructure of the acinar cells of the lacrimal gland in each group of mice. N, nucleus, Mt, mitochondria. (I) Measurement of mitochondrial area and perimeter on the TEM images. (J) TEM images of the ultrastructure of the secretory granules in the acinar cells of the lacrimal gland in control and middle-aged lacrimal glands. (K) Measurement of secretory granules (marked yellow) of acinar cells (marked red) on the TEM images. Scale bar = 20 µm (A, D, F, G), 1 µm (magnified 500 nm) (H, J), N = 4, ***P < 0.001.
Figure 3.
Figure 3.
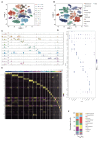
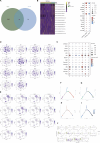
Single-cell transcriptomes atlas of the lacrimal gland of control and middle-aged mice. (A) The t-SNE plot showed individual cells colored by 25 cellular clusters. (B) The t-SNE plot showed the 12 cell types by identified by different cell markers. (C) The bar plot showed the cell proportions of the 12 cell clusters. (D) Violin plots of the expression of the marker gene in the 12 cell clusters. (E) Bubble plots of the expression of marker gene in the 12 cell clusters. (F) The heatmap showed the expression signatures of the top 100 DEGs that are expressed differently across each kind of cell. DEGs, differentially expressed genes.
Figure 4.
Figure 4.
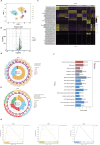
Analysis of mice lacrimal gland acinar epithelial cell subclusters. (A) The t-SNE plot showed reclustered epithelial cells, colored by clusters. (B) Volcanic map for DEGs of lacrimal gland acinar epithelial cell between control and aged group. (C) The heatmap showed the expression signatures of the top 50 DEGs that are expressed differently across each kind of subcluster. (D) GO analysis of DEGs. (E) KEGG analysis of DEGs. (F) The bar plot for 15 pathways is based on transcriptome sequencing results. DEGs, differentially expressed genes. (G) GSEA analysis of mitophagy pathway, mTOR pathway, and apoptosis pathway between control and aged group. DEGs, differentially expressed genes; GSEA, Gene Set Enrichment Analysis.
Figure 5.
Figure 5.
The mitophagy pathway during aging in mice lacrimal gland acinar epithelial cell subclusters. (A) The Venn plot displayed the overlapping genes between DEGs of lacrimal gland acinar epithelial cells between the control and aged group and MRGs. (B) The heatmap and bubble plots showed the distribution of DE-MRGs between the control and aged groups. (C) The bubble plots showed the distribution of DE-MRGs across the lacrimal gland acinar cell subclusters. (D) The t-SNE plot showed the DE-MRGs in lacrimal gland clusters. (E) The t-SNE plot showed the DE-MRGs in each lacrimal gland acinar epithelial cell subcluster. Differentiation trajectory of lacrimal gland acinar epithelial cell, colored for state (F), cell types (G), age distribution (H), and pseudo-time (I). (J) The differentiation pseudo-time trajectory of 14 DE-MRGs and their respective expression patterns. MRGs, mitophagy-related genes; DE-MRGs, differentially expressed mitophagy-related genes.
Figure 6.
Figure 6.
Rapamycin ameliorates morphological and histological damage of lacrimal gland acinar cells of middle-aged mice. (A) Representative images of hematoxylin and eosin (H&E) staining in the lacrimal gland of each group of mice. (B) Representative macroscopic images of Oil Red O staining in the lacrimal gland of each group of mice. (C) Masson staining shows the lipid droplets in the lacrimal gland of each group of mice. (D) Quantitative analysis of the lacrimal gland interstitial fibrosis. (E) Immunofluorescent staining and quantifications of CD45 show CD45+ cell infiltration in the lacrimal gland of each group of mice. (F) Immunofluorescent staining and quantifications of Ki67 show Ki67+ cells infiltration in the lacrimal gland of each group of mice. (G) Representative microscopic images of immunohistochemistry (IHC) of IL-1β and IL-6 expressions in mice control and middle-aged lacrimal gland. (H) The relative mRNA expression of CPT1a, CPT2, and C/EBPα in the lacrimal gland of each group of mice. (I) Tear secretion of each group of mice. Scale bar = 50 µm (magnified 20 µm) (A, B, C), 20 µm (E, F, G), N = 4, **P < 0.01, ***P < 0.001. Rapa, rapamycin.
Figure 7.
Figure 7.
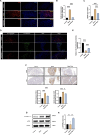
Rapamycin reverses aging-induced reduction in ROS production mitochondrial membrane potential and mitochondrial dysfunction. (A) Immunofluorescence staining of ROS using ROS probe (red) and DAPI (blue) in lacrimal gland tissues of each group of mice. (B) Assessment of relative fluorescence intensity of ROS staining. (C) Mitochondrial DNA (mtDNA) leakage in the lacrimal gland tissues in the different groups. (D) Immunofluorescence staining of mitochondrial membrane potential using JC-1 in lacrimal gland tissues of each group of mice. (E) Measurement of relative fluorescence intensity of JC-1 staining. (F) Representative microscopic images of immunohistochemistry (IHC) of NOX4 and 3-NT expressions in mice control and middle-aged lacrimal gland. (G) Western blot analysis showed the expression of p-mTOR(Ser2448) in lacrimal gland tissues. (H) Quantitative analysis of the levels of p-mTOR(Ser2448). Scale bar = 20 µm (A, D, F), N = 4, ns: not significant, *P < 0.05, ***P < 0.001. Rapa, rapamycin.
Figure 8.
Figure 8.
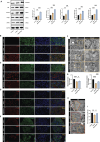
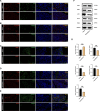
Rapamycin suppresses mitochondrial dysfunction via activating PINK1/Parkin-mediated mitophagy. (A) Western blot analysis showed the expression of p62, Beclin-1, LC3B, PINK1, and Parkin in lacrimal gland tissues. (B) Immunofluorescence analysis showing the co-localization between LC3B (red) and p62 (green) in the lacrimal gland, and DAPI (blue). (C) Immunofluorescence analysis showing the co-localization between LC3B (red) and TOMM20 (green) in the lacrimal gland, and DAPI (blue). (D) Immunofluorescence analysis showing the co-localization between LC3B (red) and Parkin (green) in the lacrimal gland, and DAPI (blue). (E) Immunofluorescence analysis showing the co-localization between LAMP-1 (red) and TOMM20 (green) in the lacrimal gland, and DAPI (blue). (F) Transmission electron microscopy (TEM) images of the ultrastructure of the acinar cells of the lacrimal gland in each group of mice. N, nucleus, Mt, mitochondria. (G) Measurement of mitochondrial area and perimeter on the TEM images. (H) TEM images of the ultrastructure of the secretory granules in the acinar cells of the lacrimal gland in control and middle-aged lacrimal glands. (I) Measurement of secretory granules (marked yellow) of acinar cells (marked red) on the TEM images. Scale bar = 20 µm (B, C, D, E), 1 µm (magnified 500 nm) (F, H), N = 4, *P < 0.05, **P < 0.01, ***P < 0.001. Rapa, rapamycin.
Figure 9.
Figure 9.
Inhibiting mitophagy aggravated aging-induced lacrimal gland apoptosis and mitochondrial dysfunction. (A) Representative images of hematoxylin and eosin (H&E) staining in the lacrimal gland of middle-aged and Mdivi-1 treated middle-aged mice. (B) Representative macroscopic images of Oil Red O staining in the lacrimal gland of middle-aged and Mdivi-1 treated middle-aged mice. (C) Masson staining shows the lipid droplets in the lacrimal gland of middle-aged and Mdivi-1-treated middle-aged mice. (D) Quantitative analysis of the lacrimal gland interstitial fibrosis. (E) TUNEL fluorescence staining and quantification results of the lacrimal gland in each group. (F) Immunofluorescent staining of Ki67 shows Ki67+ cell infiltration in the lacrimal gland of each group of mice. (G) Representative Western blot images of p16 and p21 in the lacrimal gland. (H) Quantitative analysis of the levels of p16 and p21. (I) Immunofluorescence staining of ROS using ROS probe (red) and DAPI (blue) in lacrimal gland tissues of control and middle-aged mice. (J) Assessment of relative fluorescence intensity of ROS staining. (K) Immunofluorescence staining of mitochondrial membrane potential using JC-1 in lacrimal gland tissues of control and middle-aged mice. (L) Measurement of relative fluorescence intensity of JC-1 staining. (M) Transmission electron microscopy (TEM) images of the ultrastructure of the acinar cells of the lacrimal gland in each group of mice. (N) Measurement of mitochondrial area and perimeter on the TEM images. (O) Mitochondrial DNA (mtDNA) leakage in the lacrimal gland tissues in the different groups. Scale bar = 50 µm (magnified 20 µm) (A, B, C), 20 µm (E, F, I, K), and 1 µm (magnified 500 nm) (M), N = 4, *P < 0.05, **P < 0.01, ***P < 0.001. Rapa, rapamycin.
Figure 10.
Figure 10.
Mdivi-1 inhibits mitophagy-associated PINK1/Parkin activation. (A) Immunofluorescence analysis showing the co-localization between LC3B (red) and p62 (green) in the lacrimal gland, and DAPI (blue). (B) Immunofluorescence analysis showing the co-localization between LC3B (red) and TOMM20 (green) in the lacrimal gland, and DAPI (blue). (C) Immunofluorescence analysis showing the co-localization between LAMP-1 (red) and TOMM20 (green) in the lacrimal gland, and DAPI (blue). (D) Immunofluorescence analysis showing the co-localization between LC3B (red) and Parkin (green) in the lacrimal gland, and DAPI (blue). (E) Immunofluorescence analysis showing the co-localization between Parkin (red) and LAMP-1 (green) in the lacrimal gland, and DAPI (blue). (F) Western blot analysis showed the expression of OPA1, DRP1, MFF, PINK1, and Parkin in lacrimal gland tissues. (G) Quantitative analysis of the levels of OPA1, DRP1, MFF, PINK1, and Parkin. Scale bar = 20 µm (A, B, C, D, E), N = 4, **P < 0.01, ***P < 0.001.

References

    1. Dzau VJ, Inouye SK, Rowe JW, Finkelman E, Yamada T.. Enabling healthful aging for all - the National Academy of Medicine Grand Challenge in Healthy Longevity. N Engl J Med. 2019; 381: 1699–1701. - PubMed
    1. Gipson IK. Age-related changes and diseases of the ocular surface and cornea. Invest Ophthalmol Vis Sci. 2013; 54: Orsf48–Orsf53. - PubMed
    1. Campisi J, Kapahi P, Lithgow GJ, Melov S, Newman JC, Verdin E.. From discoveries in ageing research to therapeutics for healthy ageing. Nature. 2019; 571: 183–192. - PMC - PubMed
    1. Ding J, Sullivan DA.. Aging and dry eye disease. Exp Gerontol. 2012; 47: 483–490. - PMC - PubMed
    1. Gogola A, Jan NJ, Brazile B, et al. .. Spatial patterns and age-related changes of the collagen crimp in the human cornea and sclera. Invest Ophthalmol Vis Sci. 2018; 59: 2987–2998. - PMC - PubMed

MeSH terms