. 2024 Nov 26;43(11):114913.
doi: 10.1016/j.celrep.2024.114913. Epub 2024 Nov 5.

Metabolite signatures of chronological age, aging, survival, and longevity

Affiliations

Metabolite signatures of chronological age, aging, survival, and longevity

Paola Sebastiani et al. Cell Rep. .

Abstract

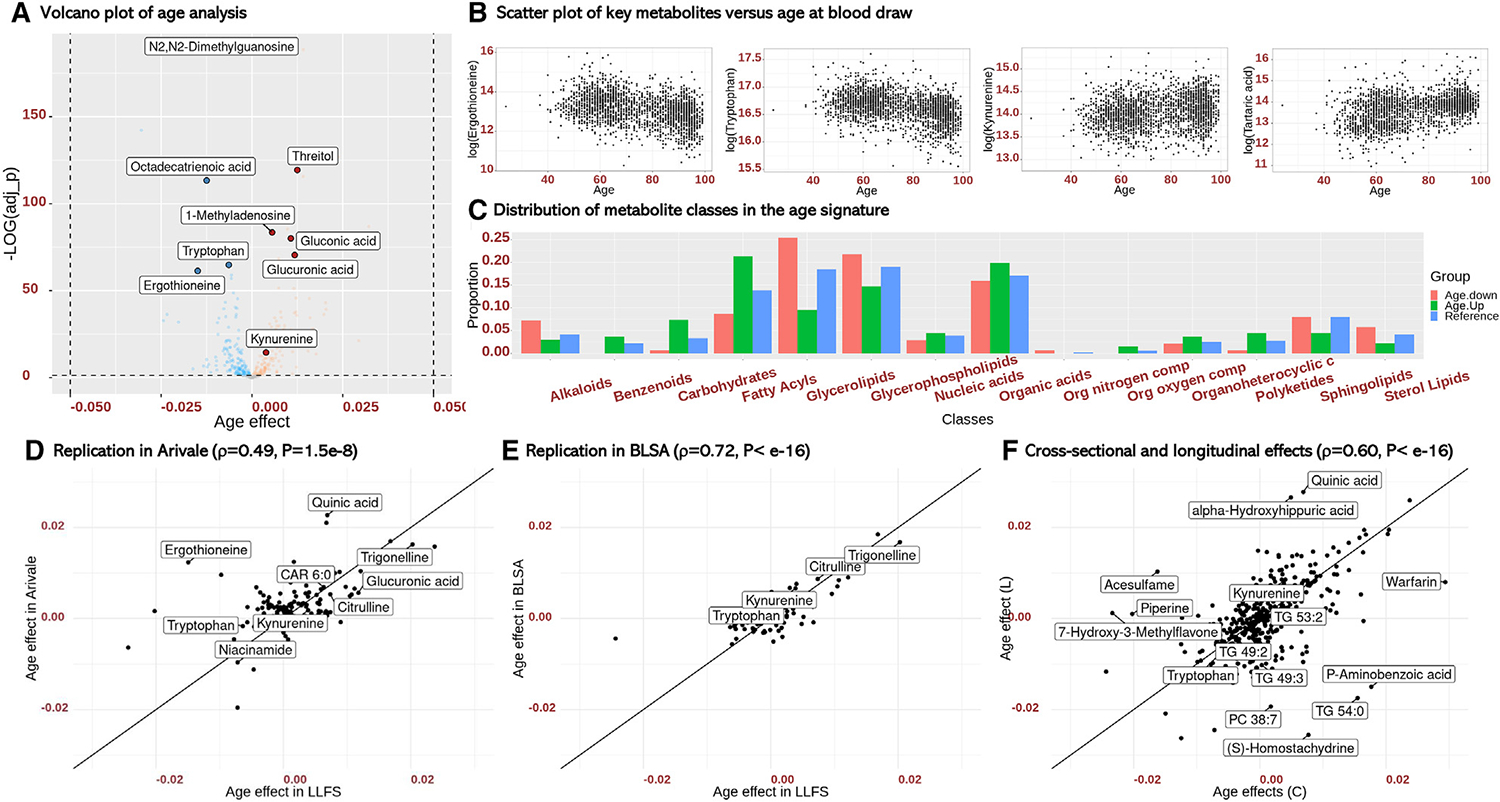
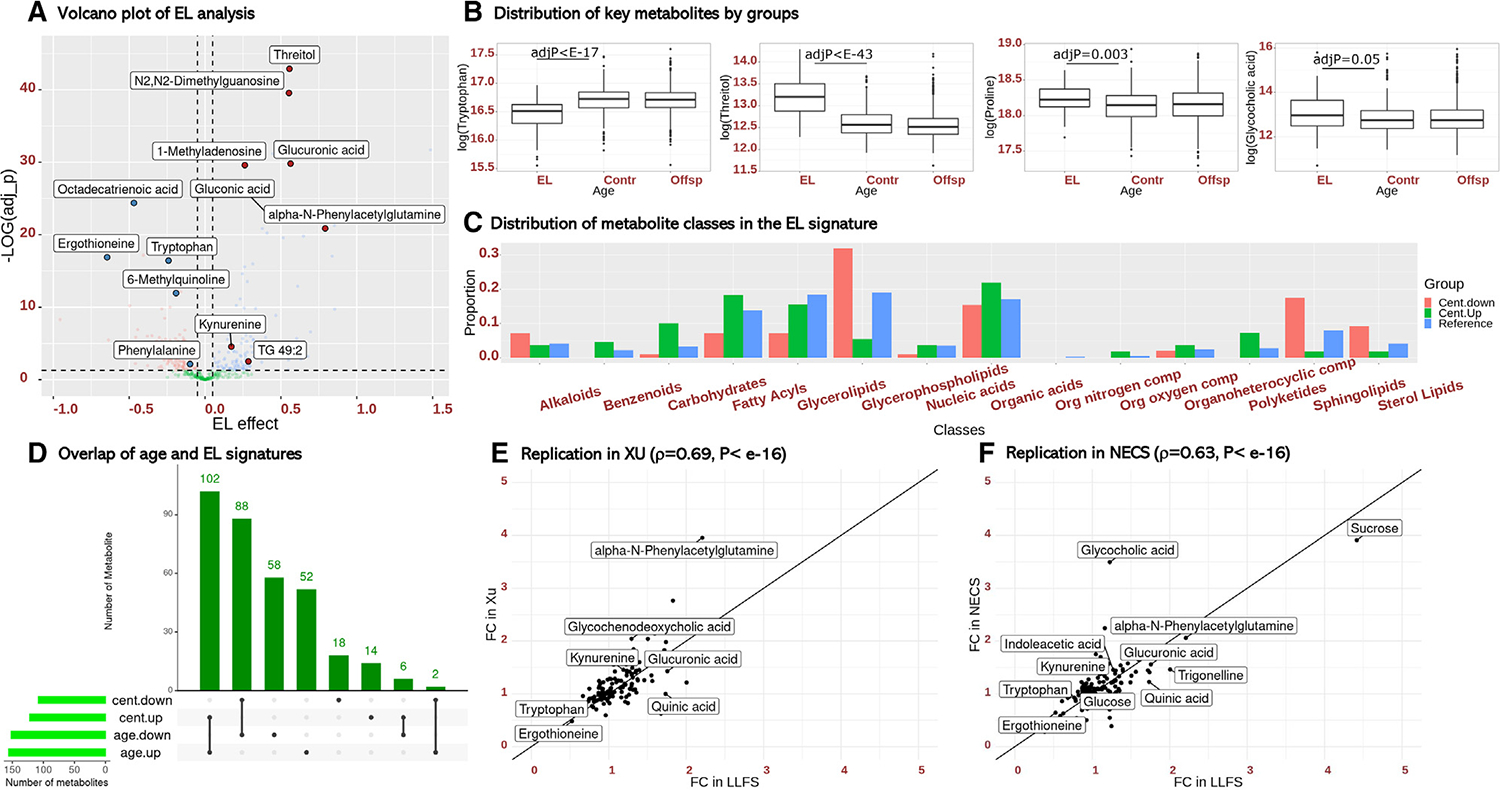
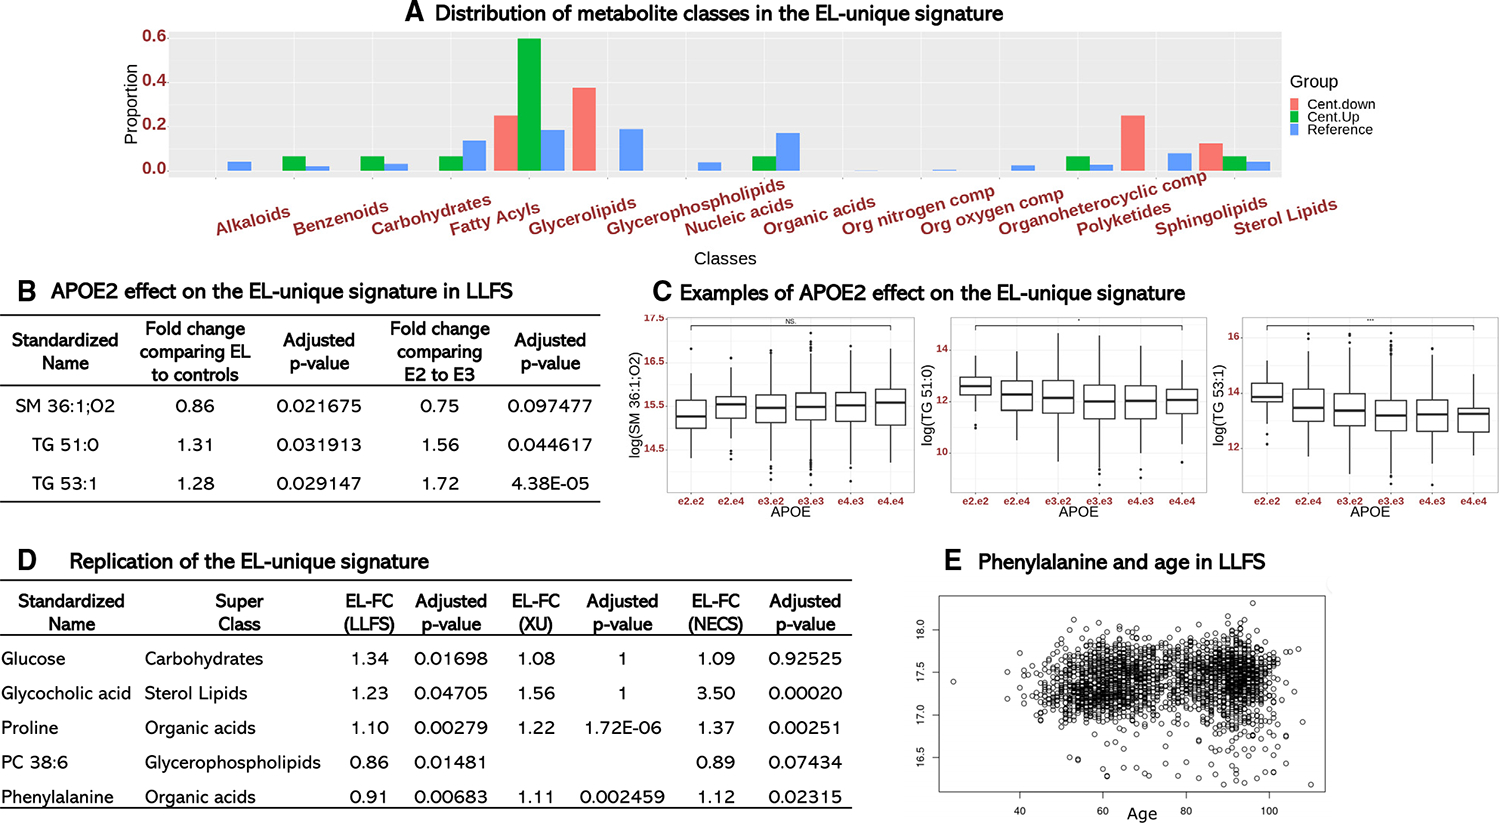
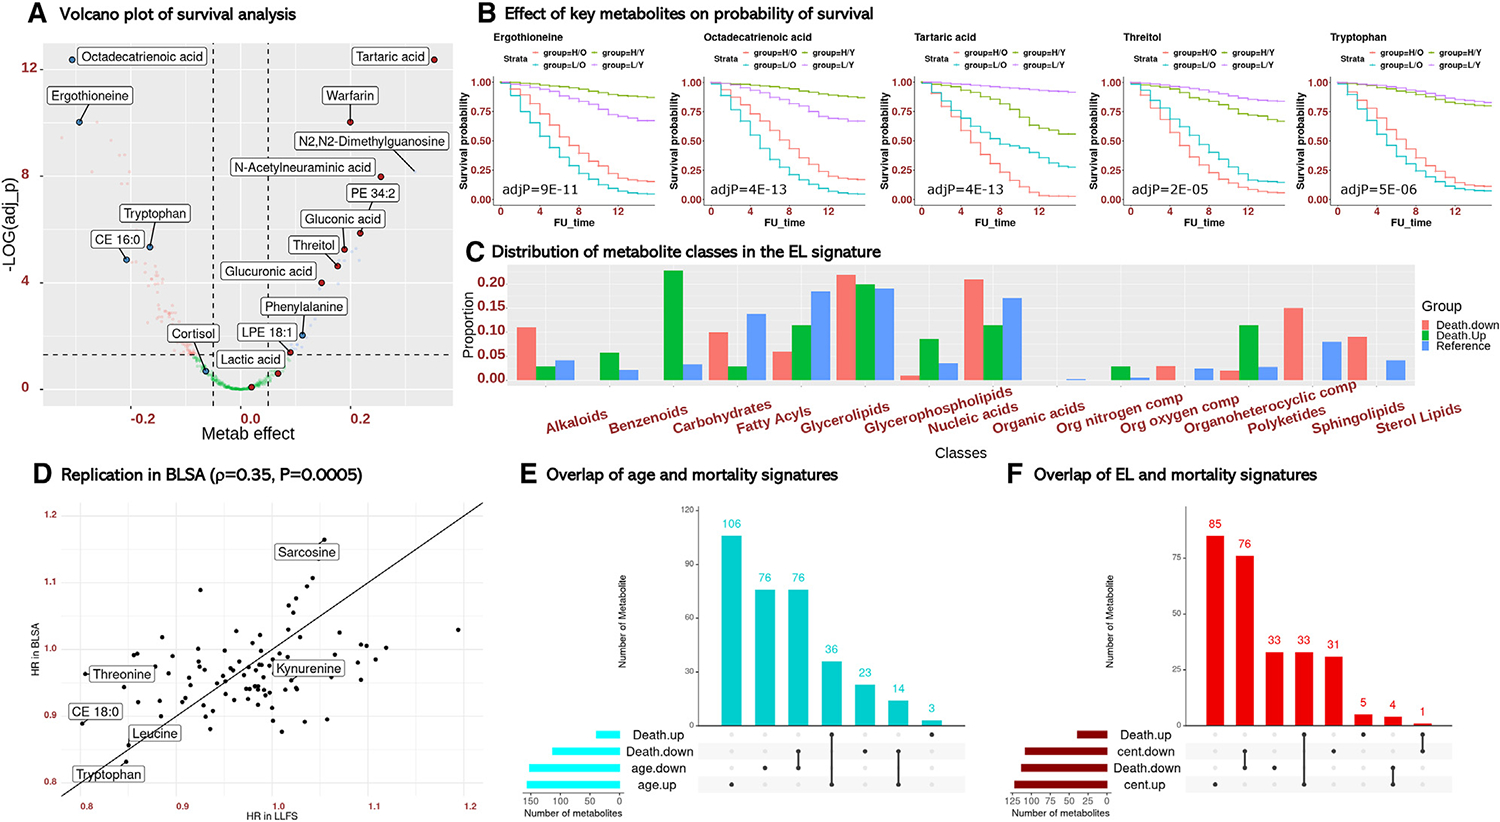
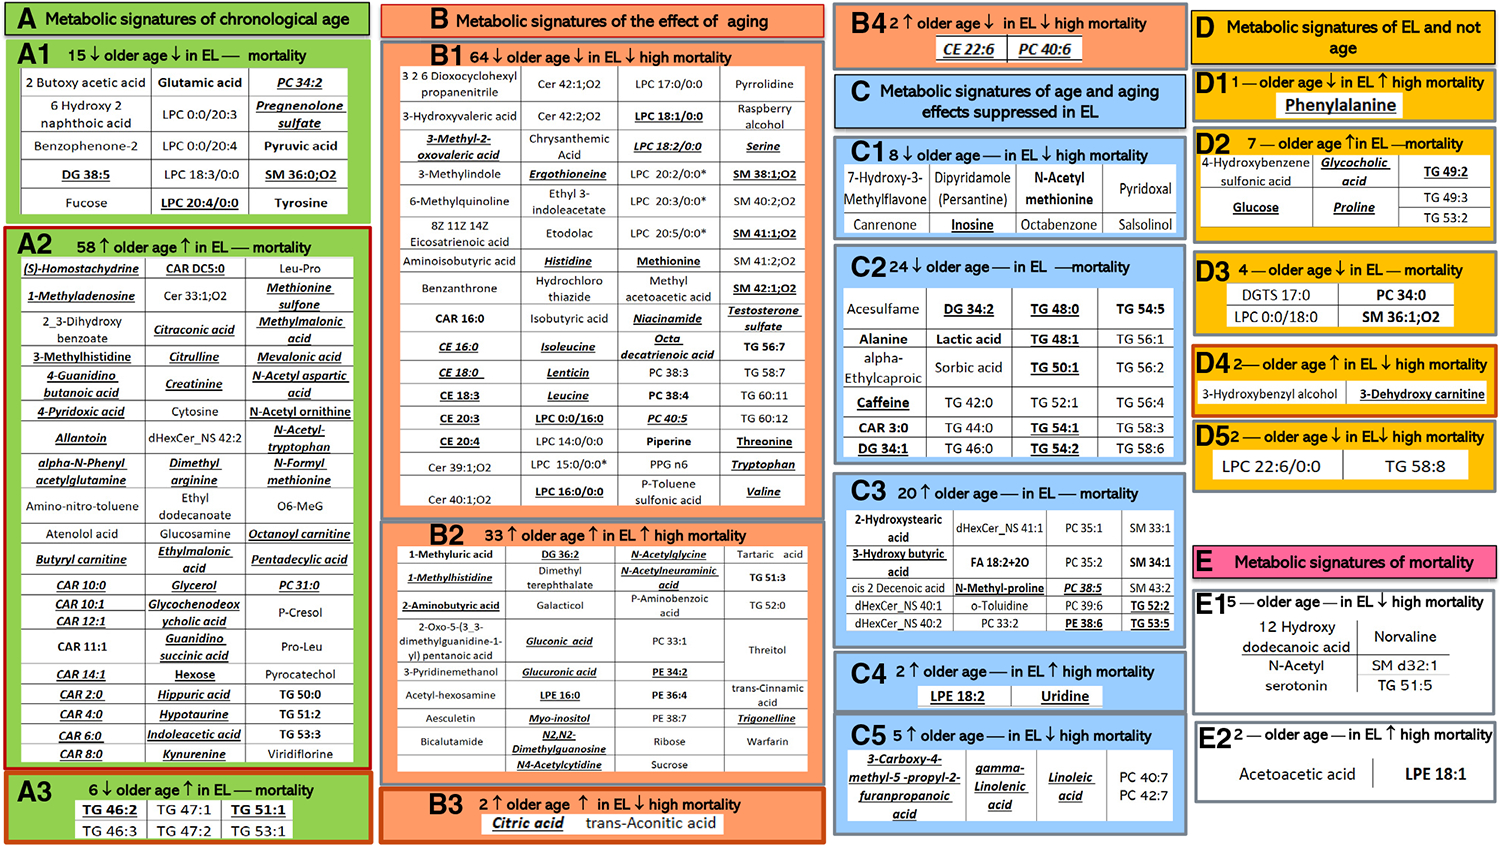
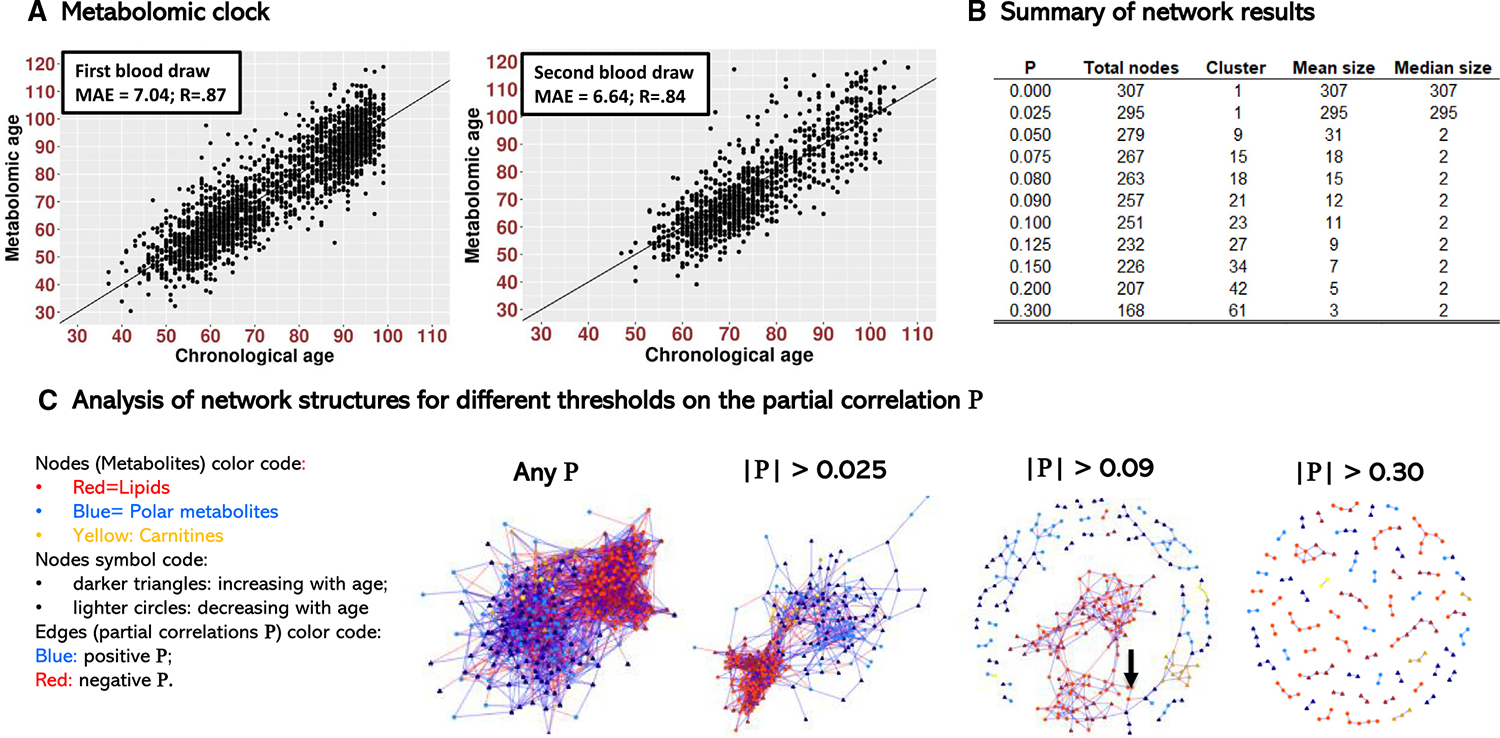
Metabolites that mark aging are not fully known. We analyze 408 plasma metabolites in Long Life Family Study participants to characterize markers of age, aging, extreme longevity, and mortality. We identify 308 metabolites associated with age, 258 metabolites that change over time, 230 metabolites associated with extreme longevity, and 152 metabolites associated with mortality risk. We replicate many associations in independent studies. By summarizing the results into 19 signatures, we differentiate between metabolites that may mark aging-associated compensatory mechanisms from metabolites that mark cumulative damage of aging and from metabolites that characterize extreme longevity. We generate and validate a metabolomic clock that predicts biological age. Network analysis of the age-associated metabolites reveals a critical role of essential fatty acids to connect lipids with other metabolic processes. These results characterize many metabolites involved in aging and point to nutrition as a source of intervention for healthy aging therapeutics.

Keywords: CP: Metabolism; aging; centenarians; longevity; metabolomics.


Conflict of interest statement

Declaration of interests M.E.M. receives research funding unrelated to this work from Regeneron Pharmaceutical Inc.

Figures

Figure 1.
Figure 1.. Metabolites correlate with age
(A) Volcano plot of age effect on 408 log-transformed metabolites (x axis) and −log10 Adj_ values (y axes). Age effect: log FC of metabolites for a year older age. (B) Scatterplots of log-transformed metabolites (y axis) versus age at blood draw (x axis). (C) Proportion of metabolite main classes (blue) and of metabolites positively correlated (green) and negatively correlated (red) with age. (D) Age effects on 120 metabolites in the LLFS (x axis) and Arivale (y axis). ρ, Pearson correlation. P, p value. (E) Age effects on 99 metabolites in the LLFS (x axis) and BLSA (y axis). (F) Cross-sectional (x axis) and longitudinal (y axis) age effects.
Figure 2.
Figure 2.. Metabolites correlate with EL
(A) Volcano plot of EL effect on 408 log-transformed metabolites (x axis) and −log10 Adj_p values (y axes). EL effect, log FC of metabolite comparing EL to controls. (B) Boxplots of log-transformed metabolites (y axis) in EL, controls (Contr), and Offspring (Offsp). AdjP, p value adjusted for multiple testing. (C) Proportion of metabolite main classes (blue) and of metabolites higher (green) and lower in EL (red) compared to controls. (D) UpSet plot of associations with age and EL. Age_up/Age_down, metabolites positively/negatively associated with age; Cent_up/Cent_down, metabolites higher/lower in EL. (E) EL effects on 121 overlapping metabolites in the LLFS (x axis) and XU (y axis). FC, fold change of metabolites comparing EL to younger controls. ρ, Pearson correlation. P, p value. (F) EL effects on 150 overlapping metabolites in the LLFS (x axis) and NECS (y axis).
Figure 3.
Figure 3.. Metabolomic signature of EL independent of age
(A) Proportions of main classes of 24 metabolites (blue): 16 higher (green) and 8 lower in EL (red). (B) APOE effect on EL-associated lipids. E2, e2e2 or e2e3; E3, e3e3. (C) Distribution of EL-associated lipids by APOE genotype groups. *Adj_p < 0.05, **Adj_p < E–04. (D) EL-FC, FC for EL versus control. (E) Scatterplot of log-transformed phenylalanine (y axis) and age at blood draw (x axis) in the LLFS.
Figure 4.
Figure 4.. Metabolites predict mortality risk
(A) Volcano plot of effects of 408 log-transformed metabolites on hazard for mortality (x axis) and −log10 Adj_p values (y axis). Metab effect, effect of 1 standard deviation from the mean of the log-transformed metabolite on hazard for mortality. (B) Generation-stratified Kaplan-Meier survival curves. H/O, above-the-mean metabolite in individuals born before 1935. H/Y, above-the-mean metabolite in individuals born in 1935 or later; L/O, below-the-mean mean metabolite in individuals born before 1935; L/Y, below-the-mean mean metabolite in individuals born in 1935 or later; FU_time, years after enrollment in the LLFS. AdjP, p value adjusted for multiple testing. (C) Proportion of metabolite main classes (blue) and of metabolites positively correlated (green) and negatively correlated with mortality risk (red). (D) HR for mortality associated with 99 metabolites in the LLFS (x axis) and BLSA (y axis). ρ, Pearson correlation. P, p value (E and F) UpSet plots of metabolites associated with age and mortality and EL and mortality. Age_up/Age_down, metabolites positively/negatively associated with age; Cent_up/Cent_down, metabolites higher/lower in EL; Death_up/Death_down, metabolites positively/negatively correlated with mortality risk.
Figure 5.
Figure 5.. Summary of the metabolomic signatures of age, EL, and mortality
(A) metabolites that correlate with age and EL but not mortality. (B) Metabolites that correlate with age, EL, and mortality. (C) metabolites that correlate with age and/or mortality but not EL. (D) metabolites that correlate with EL and/or mortality but not age. (E) metabolites that correlate with mortality but not age and EL. Upward arrow: positive correlation. Downward arrow: negative correlation. Dash: no correlation. Underlined, validated metabolites with concordant effect; italics, validated metabolites with significant effect; boldface, metabolite found in one or more independent sets; AKOS040738329, NCGC00380721–01_C20H30O4_2-hydroxy-4_5’_8a′-trimethyl-1′-oxo-4-vinyloctahydro-1′H-spiro[cyclopentane-1_2′-naphthalene]-5′-carboxylic acid.
Figure 6.
Figure 6.. Summary of integrative analyses
(A) Left: metabolic (y axis) against chronological (x axis) age using a bias-corrected metabolomic clock. Right: metabolic versus chronological age at follow-up. MAE, mean absolute error; R, Pearson correlation. (B) Summary table of the networks generated with different thresholds on the absolute partial correlation P. (C) Markov graphs of the networks inferred with different thresholds on the absolute partial correlation. The black arrow in the third graph points to linoleic acid and gamma-linolenic acid, which separate the majority of lipid and polar metabolites.

Similar articles

Cited by

References

    1. Srivastava S (2019). Emerging Insights into the Metabolic Alterations in Aging Using Metabolomics. Metabolites 9, 301. 10.3390/metabo9120301. - DOI - PMC - PubMed
    1. López-Otín C, Blasco MA, Partridge L, Serrano M, and Kroemer G (2023). Hallmarks of aging: An expanding universe. Cell 186, 243–278. 10.1016/j.cell.2022.11.001. - DOI - PubMed
    1. Panyard DJ, Yu B, and Snyder MP (2022). The metabolomics of human aging: Advances, challenges, and opportunities. Sci. Adv 8, eadd6155. 10.1126/sciadv.add6155. - DOI - PMC - PubMed
    1. Adav SS, and Wang Y (2021). Metabolomics Signatures of Aging: Recent Advances. Aging Dis. 12, 646–661. 10.14336/ad.2020.0909. - DOI - PMC - PubMed
    1. Stancliffe E, Schwaiger-Haber M, Sindelar M, Murphy MJ, Soerensen M, and Patti GJ (2022). An Untargeted Metabolomics Workflow that Scales to Thousands of Samples for Population-Based Studies. Anal. Chem 94, 17370–17378. 10.1021/acs.analchem.2c01270. - DOI - PMC - PubMed

Publication types

LinkOut - more resources