. 2024 Nov 6:13:RP95213.
doi: 10.7554/eLife.95213.

Distinct catecholaminergic pathways projecting to hippocampal CA1 transmit contrasting signals during navigation in familiar and novel environments

Affiliations

Distinct catecholaminergic pathways projecting to hippocampal CA1 transmit contrasting signals during navigation in familiar and novel environments

Chad Heer et al. Elife. .

Abstract

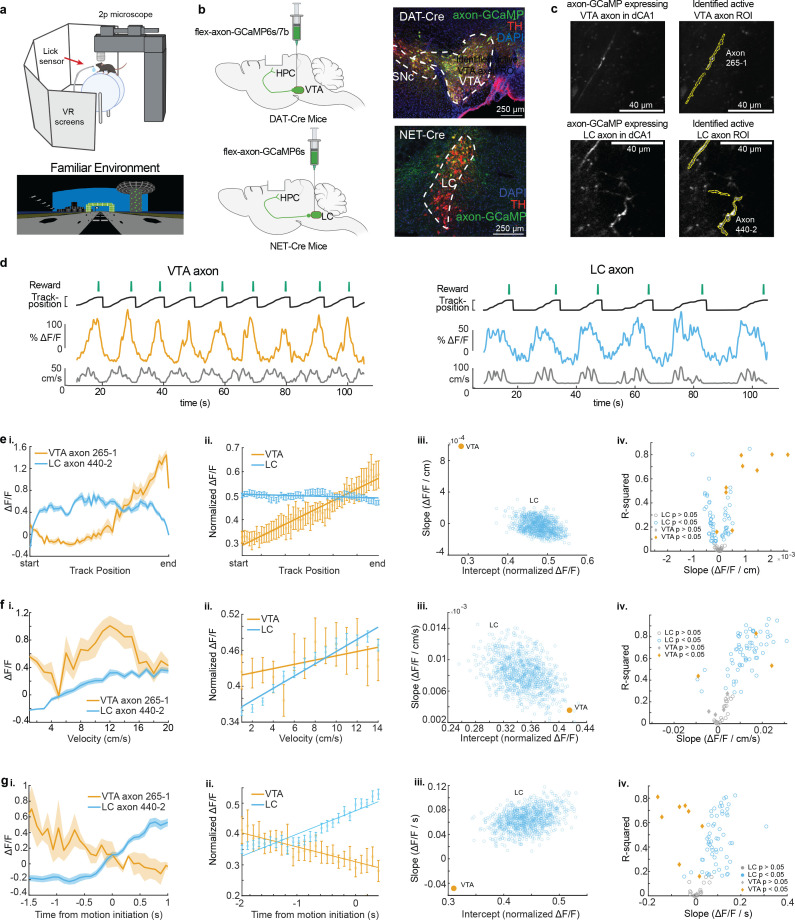
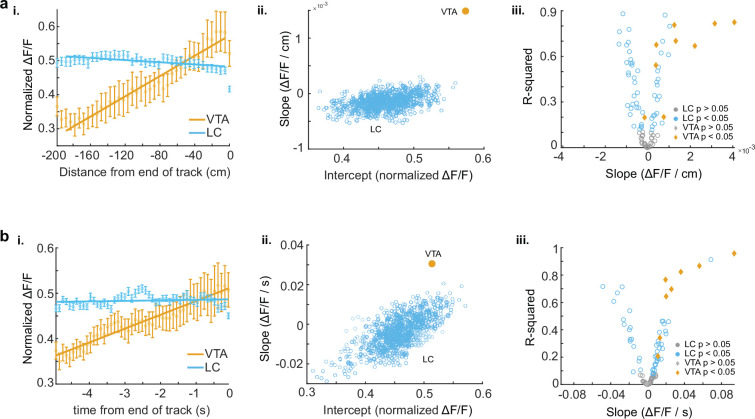
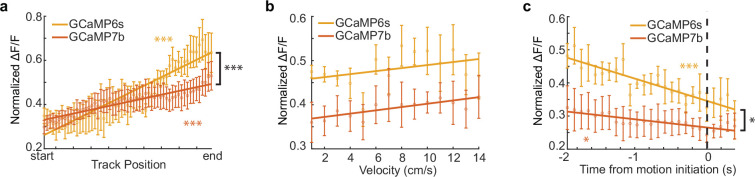
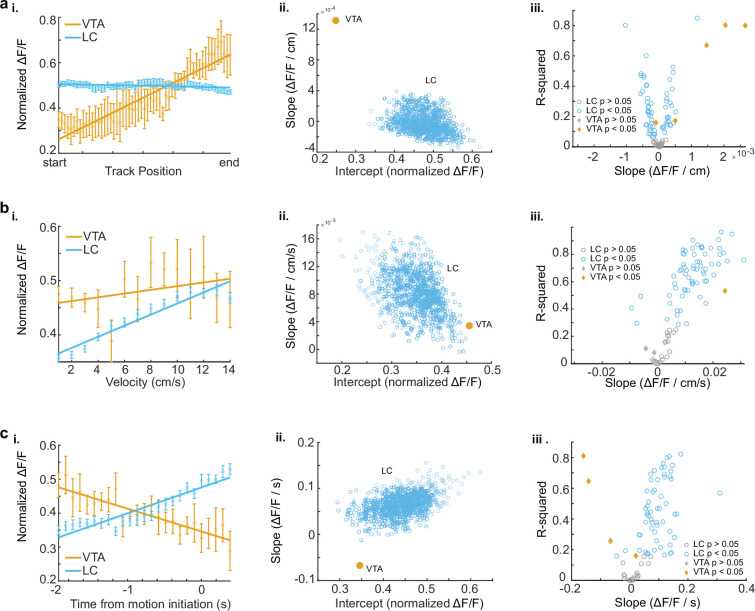
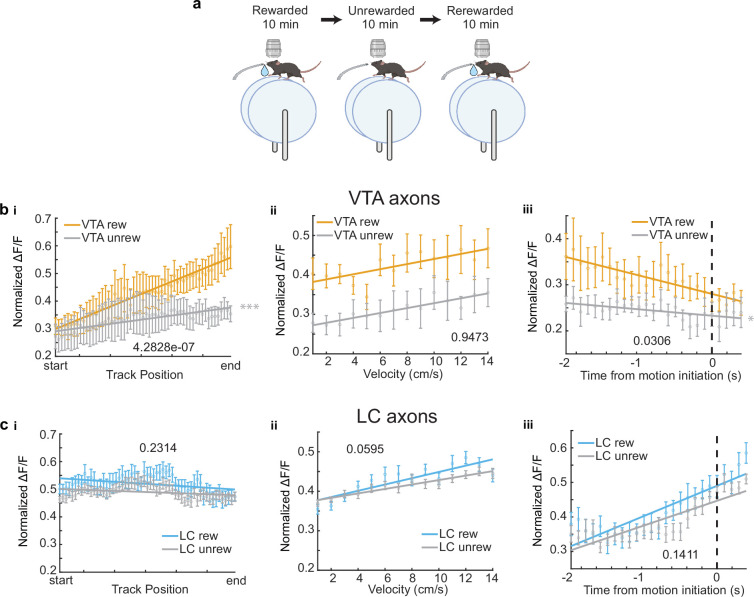
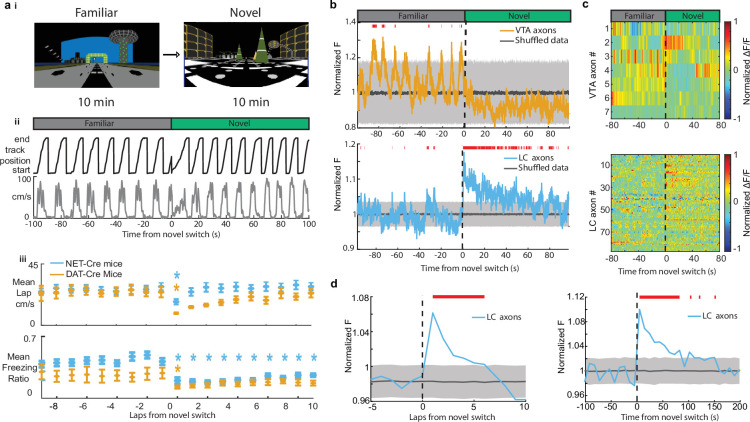
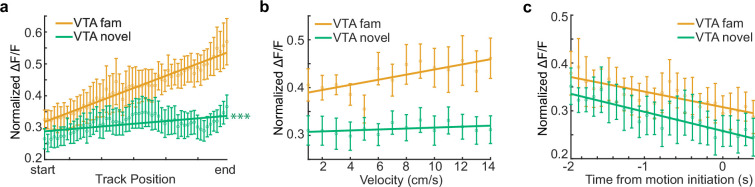
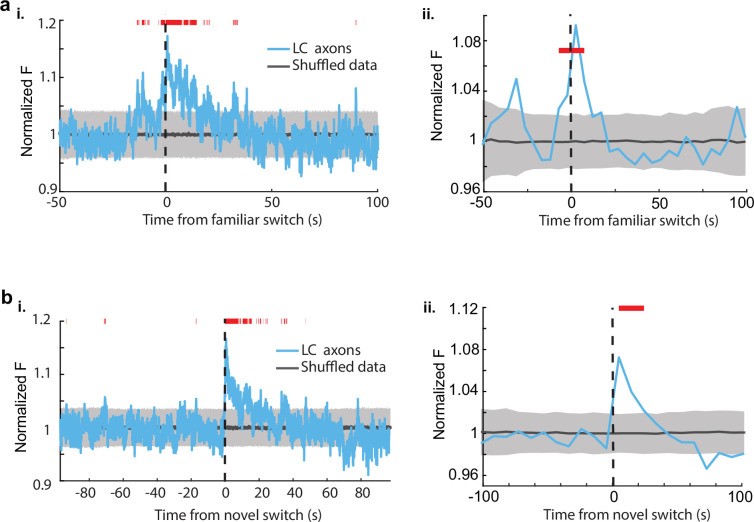
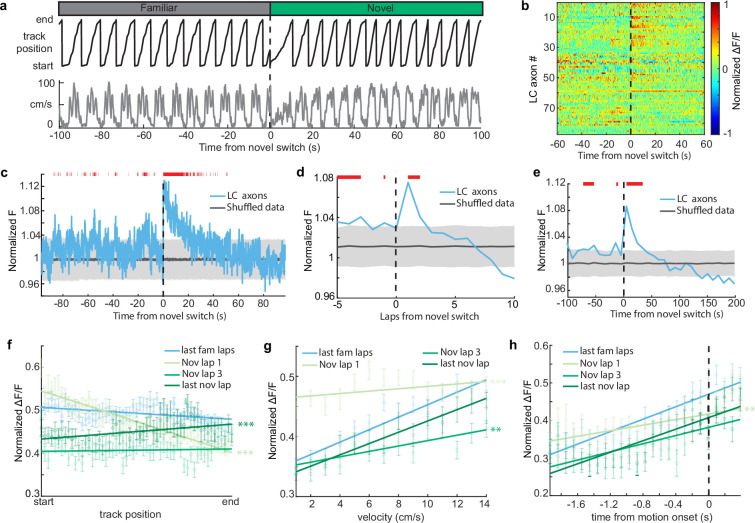
Neuromodulatory inputs to the hippocampus play pivotal roles in modulating synaptic plasticity, shaping neuronal activity, and influencing learning and memory. Recently, it has been shown that the main sources of catecholamines to the hippocampus, ventral tegmental area (VTA) and locus coeruleus (LC), may have overlapping release of neurotransmitters and effects on the hippocampus. Therefore, to dissect the impacts of both VTA and LC circuits on hippocampal function, a thorough examination of how these pathways might differentially operate during behavior and learning is necessary. We therefore utilized two-photon microscopy to functionally image the activity of VTA and LC axons within the CA1 region of the dorsal hippocampus in head-fixed male mice navigating linear paths within virtual reality (VR) environments. We found that within familiar environments some VTA axons and the vast majority of LC axons showed a correlation with the animals' running speed. However, as mice approached previously learned rewarded locations, a large majority of VTA axons exhibited a gradual ramping-up of activity, peaking at the reward location. In contrast, LC axons displayed a pre-movement signal predictive of the animal's transition from immobility to movement. Interestingly, a marked divergence emerged following a switch from the familiar to novel VR environments. Many LC axons showed large increases in activity that remained elevated for over a minute, while the previously observed VTA axon ramping-to-reward dynamics disappeared during the same period. In conclusion, these findings highlight distinct roles of VTA and LC catecholaminergic inputs in the dorsal CA1 hippocampal region. These inputs encode unique information, with reward information in VTA inputs and novelty and kinematic information in LC inputs, likely contributing to differential modulation of hippocampal activity during behavior and learning.

Keywords: LC; VTA; hippocampus; mouse; neuroscience.


Conflict of interest statement

CH, MS No competing interests declared

Figures

Figure 1.
Figure 1.. Distinct activity dynamics in ventral tegmental area (VTA) and locus coeruleus (LC) axons during navigation of familiar environments.
(a) Experimental setup (top), created with BioRender.com. Example virtual reality environment. (b) Schematic representation of injection procedure (left). Representative coronal brain sections immunostained for tyrosine hydroxolase (TH) from a DAT-Cre mouse showing overlapping expression of axon-GCaMP (green) and TH (red) in VTA neurons (top) and from a NET-Cre mouse showing overlapping expression of axon-GCaMP (green) and TH (red) in LC neurons (bottom). (c) Example CA1 field of view of VTA axons (top) and LC axons (bottom). Extracted regions of interest (ROIs) used for example VTA and LC activity throughout the figure. (d) Example DAT-Cre mouse (left) and NET-Cre mouse (right) with aligned reward delivery (top, green), mouse track position (black), ΔF/F from example ROI (VTA – orange, LC – blue), and mouse velocity (bottom, gray). (e, i) Position binned ΔF/F± s.e.m in example VTA (orange) and LC (blue) ROIs during navigation of the familiar rewarded environment. (ii) Population average position binned ΔF/F± s.e.m. in VTA ROIs (orange, n = 9 ROIs from 8 mice) and LC ROIs (blue, n = 87 ROIs from 27 sessions in 17 mice) . Linear regression analysis (on all data points, not means) shows that the population of VTA ROIs increase activity during approach of the end of the track while the population of LC ROIs have consistent activity throughout all positions. Linear regression, F test, VTA, p<1e21, LC, p<0.01. (iii) The LC dataset was resampled 1000× using n = 9 ROIs to match the number of VTA ROIs and the slope and intercept of the regression line were measured each time (blue dots). The VTA slope is steeper than all LC slopes indicating a stronger positive relationship between position and activity for VTA axons. (iv) Linear regression of position binned activity of individual VTA (orange diamonds) and LC (blue, circles) ROIs. The majority (8/9) of VTA ROIs show a significant positive relationship with position while LC ROIs show both a positive (25/87) and negative (37/87) relationship. (F, i) Same example ROIs as (d) binned by velocity. (ii) Same data as (d, ii,) binned by velocity. Linear regression shows that the population of VTA and LC ROIs have a significant relationship with velocity. Linear regression, F test, VTA, p<0.05, LC, p<1e68. (iii) Resampling shows the VTA slope and intercept is within the resampled LC slopes and intercepts indicating similar relationships with velocity. (iv) Linear regression of individual VTA and LC axons shows the majority (63/87) of LC ROIs have a significant positive relationship with velocity while only two VTA ROIs show this relationship. (g, i) Same example ROIs as (d) aligned to motion onset. (ii) Same data as (d, ii) aligned to motion onset. Linear regression shows that the population of VTA axons have a negative slope prior to motion onset while LC axons have positive slope. Linear regression, F test, VTA, p<0.01, LC, p<1e65. (iii) Resampling shows the VTA slope is negative while all resampled LC slopes are positive. (iv) Linear regression of individual VTA and LC ROIs shows the majority (56/87) of LC ROIs have a significant positive slope prior to motion onset while the majority (6/9) of VTA ROIs have a negative slope.
Figure 1—figure supplement 1.
Figure 1—figure supplement 1.. LC and VTA axon activity as a function of time and distance to reward.
(a, i) Population activity ΔF/F± s.e.m. binned by the virtual distance to reward for ventral tegmental area (VTA) regions of interest (ROIs) (orange, 200 m track n = 9 ROIs form 8 sessions in 8 mice) and locus coeruleus (LC) ROIs (blue, 300 m track, n = 87 ROIs from 27 sessions in 17 mice) in the familiar environment. Linear regression, F test, VTA, p=1.83e28, LC, p=8.77e06. (ii) The LC dataset was resampled 1000× using n = 9 axons to match the number of VTA ROIs and the slope and intercept of the regression line were measured each time (blue dots). The VTA slope is steeper than all LC slopes indicating a stronger positive relationship between position and activity for VTA inputs. (iii) Linear regression of position binned activity of individual VTA (orange diamonds) and LC (blue, circles) axons. The majority (8/9) of VTA axons show a significant positive relationship with position while LC axons show both a positive (21/87 axons from 9 sessions in 8 mice) and negative (32/87 axons from 15 sessions in 9 mice) relationship. (b, i) Same data as (a, i) averaged by time to reward. Linear regression shows that the population of VTA axons has a significant positive relationship with time to reward. Linear regression, F test, VTA, p=4.44e25, LC, p=0.119. (ii) Resampling shows the VTA slope is above the resampled LC slopes indicating VTA ROIs have a stronger positive relationship with time to reward. (iii) Linear regression of individual VTA and LC axons shows the majority (8/9) of VTA axons have a significant positive relationship with time to reward while LC axons show both a significant positive (31/87 axons from 14 sessions in 11 mice) and negative (17/87 axons from 7 sessions in 4 mice) relationship.
Figure 1—figure supplement 2.
Figure 1—figure supplement 2.. VTA DA axons expressing axon-GCaMP6s or axon-GCaMP7b show the same trends as a function of behavioral variables.
(a) Population average position binned ΔF/F±s.e.m. of ventral tegmental area (VTA) GCaMP6s regions of interest (ROIs) (orange, n = 5 ROIs in 4 mice) and VTA GCaMP7b ROIs (dark orange, n = 4 ROIs, in 4 mice) in the familiar environment. Linear regression, F test, GCaMP6s, p=2.4264e32, GCaMP7b, p=1.9576e14. (b) Same data as (a) binned by velocity. Linear regression, F test, GCaMP6s, p=0.21076, GCaMP7b, p=0.14113. (c) Same data as (a) aligned to motion onset. Linear regression, F test, GCaMP6s, p=2.0974e8, GCaMP7b, p=0.026893. The slopes for the two GCaMP variants were compared using a one-way ANCOVA with Tukey HSD post hoc test * p<0.05, ***p<1e4.
Figure 1—figure supplement 3.
Figure 1—figure supplement 3.. Distinct activity dynamics in VTA DA axons expressing axon-GCaMP6s and LC axons expressing axon-GCaMP6 during navigation of familiar environments.
(a, i) Population average position binned ΔF/F±s.e.m. s.e.m. in axon-GCaMP6s expressing ventral tegmental area (VTA) regions of interest (ROIs) (orange, n = 5 ROIs in 4 mice) and locus coeruleus (LC) ROIs (blue, n = 87 ROIs from 27 sessions in 17 mice) . Linear regression analysis (on all data points, not means) shows that the population of VTA ROIs increase activity during approach of the end of the track while the population of LC ROIs have consistent activity throughout all positions. Linear regression, F test, VTA, p=2.42e32, LC, p=0.00396. (ii) The LC dataset was resampled 1000× using n = 5 axons to match the number of VTA ROIs and the slope and intercept of the regression line were measured each time (blue dots). The VTA slope is steeper than all LC slopes indicating a stronger positive relationship between position and activity for VTA inputs. (iii) Linear regression of position binned activity of individual VTA (orange diamonds) and LC (blue, circles) axons. The majority (4/5) of VTA axons show a significant positive relationship with position while LC axons show both a positive (25/87) and negative (37/87) relationship. (b, i) Same data as (a, i) binned by velocity. Linear regression shows that the population of LC ROIs have a significant relationship with velocity. Linear regression, F test, VTA, p=0.211, LC,p<1e68. (ii) Resampling shows the VTA slope is within the resampled LC slopes indicating similar relationships with velocity. (iii) Linear regression of individual VTA and LC axons shows the majority (63/87) of LC axons have a significant positive relationship with velocity while only one VTA axon shows this relationship. (c, i) Same data as (a, i) aligned to motion onset. Linear regression shows that the population of VTA axons have a negative slope prior to motion onset while LC axons have positive slope. Linear regression, F test, VTA, p=2.10e081, LC, p=5.51e66. (ii) Resampling shows the VTA slope is negative while all resampled LC slopes are positive. (iii) Linear regression of individual VTA and LC axons shows the majority (56/87) of LC axons have a significant positive slope prior to motion onset while the majority (3/5) of VTA axons have a negative slope.
Figure 2.
Figure 2.. Removal of reward restructures ventral tegmental area (VTA) but not locus coeruleus (LC) input activity during spatial navigation.
(a) Experimental paradigm. (b, i) Population average position binned ΔF/F±s.e.m. of VTA regions of interest (ROIs) (n = 6 ROIs in 6 mice) in the rewarded (VTA rew, orange) and unrewarded conditions (VTA unrew, gray). Linear regression, F test, Rewarded, p<1e22, Unrewarded, p<0.001. (ii) Same data as (b, i) binned by velocity. Linear regression, F test, Rewarded, p<0.05, Unrewarded, p<0.05. (iii) Same data as (b, i) aligned to motion onset. Linear regression, F test, Rewarded, p<1e4, Unrewarded, p<0.05. (c, i) Population average position binned ΔF/F± s.e.m. of LC ROIs (n = 26 ROIs in 7 sessions in 4 mice) in the rewarded (LC rew, blue) and unrewarded conditions (LC unrew, gray). Linear regression, F test, Rewarded, p<0.01, Unrewarded, p<0.01. (ii), Same data as (c, i) binned by velocity. Linear regression, F test, Rewarded, P<1e12, Unrewarded, p<1e15. (iii) Same data as (c, i) aligned to motion onset. Linear regression, F test, Rewarded, p<1e21, Unrewarded, p<1e26. The slope of each unrewarded measure was compared to the familiar laps using a one-way ANCOVA with Tukey HSD post hoc test. *p<0.05, ***p<1e4. This figure was created with BioRender.com.
Figure 3.
Figure 3.. Exposure to a novel environment causes an abrupt and sustained increase in activity in locus coeruleus (LC) but not ventral tegmental area (VTA) inputs to dCA1.
(a, i) Experimental paradigm. (ii) Behavior from example mouse during the transition from the familiar virtual reality (VR) environment to a novel VR environment showing the animals track position (top, black) and velocity (bottom, gray). (iii) The average running velocity ± s.e.m. of all mice (n = 7 DAT-Cre mice; n = 17 NET-Cre mice) during the transition to a novel VR environment (top). The average freezing ratio of all mice ± s.e.m. calculated as the time spent immobile (velocity <5 cm/s) divided by the total lap time. Each lap was compared to the final lap in the familiar environment using a one-way ANOVA with Tukey HSD post hoc test (Blue *, NET-Cre mice P<0.05; Orange *, DAT-Cre mice P<0.05). (b) Mean normalized fluorescence of all VTA regions of interest (ROIs) (top, n = 7 sessions in 7 mice) and LC ROIs (bottom, n = 27 sessions in 17 mice) aligned to the switch to the novel environment. To define a baseline and 95% CI (gray shaded region), 1000 shuffles were created from the calcium traces and down-sampled to match the sample size and averaged. This was repeated 1000 times and the mean and 95% CI of this shuffled data were determined for each frame. Red lines indicate periods where two or more consecutive frames passed above the %CI of the shuffled baseline. (c) Normalized ΔF/F activity of all VTA ROIs (top) and LC ROIs (bottom) aligned to the switch to the novel VR environment. (d) The normalized fluorescence of all LC ROIs binned by lap (left) or into 50 frame bins (right). The baseline and 95% CI (gray shaded region) were defined using the same method as in (b) Red lines indicate bins above the baseline 95% CI.
Figure 3—figure supplement 1.
Figure 3—figure supplement 1.. Reward related activity in VTA DA axons is diminished in a novel environment.
(a) Population average position binned ΔF/F±s.e.m. of ventral tegmental area (VTA) regions of interest (ROIs) (n = 7 ROIs in 7 mice) in the familiar (orange) and novel (green) rewarded environments. Linear regression, F test, Rewarded, p<1e21, Unrewarded, p<0.01. (b) Same data as (a) binned by velocity. Linear regression, F test, Rewarded, p<0.05, Unrewarded, p=0.57. (c) Same data as (a) aligned to motion onset. Linear regression, F test, Rewarded, p<0.01, Unrewarded, p<0.001. The slope of each novel measure was compared to the familiar laps using a one-way ANCOVA with Tukey HSD post hoc test. ***p<1e4.
Figure 3—figure supplement 2.
Figure 3—figure supplement 2.. Increased LC axon activity following exposure to a familiar environment and during immobile periods in a novel environment.
(a, i) Mean normalized fluorescence of locus coeruleus (LC) regions of interest (ROIs) (n = 50, 11 sessions in 9 mice) aligned to the switch from dark to the familiar environment. To define a baseline and 95% CI (gray shaded region), 1000 shuffles were created from the calcium traces and down-sampled to match the sample size and averaged. This was repeated 1000 times and the mean and 95% CI of this shuffled data were determined for each frame. Red lines indicate periods where two or more consecutive frames passed above the %CI of the shuffled baseline. (a, ii) The normalized fluorescence of all LC binned into 50 frame bins. The baseline and 95% CI (gray shaded region) were defined using the same method as in (a). Red lines indicate two or more consecutive bins above the baseline 95% CI. (b, i) Mean normalized fluorescence of LC ROIs (n = 87 ROIs from 27 sessions in 17 mice) during immobile periods aligned to the switch from the familiar to the novel environment. The baseline and 95% CI (gray shaded region) were defined using the same method as in (a). Red lines indicate two or more consecutive bins above the baseline 95% CI. (b, ii) The normalized fluorescence of LC axons during immobile periods binned into 50 frame bins. The baseline and 95% CI (gray shaded region) were defined using the same method as in (a). Red lines indicate two or more consecutive bins above the baseline 95% CI.
Figure 4.
Figure 4.. Novelty-induced changes in behavior explain the late but not early increases in locus coeruleus (LC) activity.
(a) Good behavior from example mouse following removal of freezing periods (velocity <0.2 cm/s) during the transition from the familiar to a novel virtual reality (VR) environment showing the animals track position (top, black) and velocity (bottom, gray). (b) Normalized ΔF/F activity of all LC regions of interest (ROIs) aligned to the switch to the novel VR environment following removal of freezing periods (n = 87 ROIs from 27 sessions in 17 mice). (c) Mean normalized F of all LC ROIs (bottom, n = 87) aligned to the switch to the novel environment. To define a baseline and 95% CI (gray shaded region), 1000 shuffles were created from the calcium traces and down-sampled to match the sample size and averaged. This was repeated 1000 times and the mean and 95% CI of this shuffled data were determined for each frame. Red lines indicate periods where two or more consecutive frames passed above the 95% CI of the shuffled baseline. The normalized F of all LC ROIs binned by lap (d) or into 50 frame bins (e). The baseline and 95% CI (gray shaded region) were defined using the same method as in (c). Red lines indicate bins above the baseline 95% CI. Population average position binned (f), velocity binned (g), and motion onset aligned (h) ΔF/F± s.e.m. in LC ROIs (n = 87) in the final laps of the familiar environment (light blue), and the first (orange), third (dark blue), and final laps (green) of the novel environment. Linear regression, F test, position binned (f) fam last, p<1e4, nov 1, p<1e68, nov 3, p=0.48, nov last, p<0.001; velocity binned (g) fam last, p<1e31, nov 1, p<0.05, nov 3, p<1e5, nov last, P<1e13; motion onset aligned (h) fam last, p<1e29, nov 1, p<0.001, nov 3, p<1e9, nov last, p<1e18. The slope of each lap was compared to the final familiar laps using a one-way ANCOVA with Tukey HSD post hoc test. **p<0.001, ***P<1e4.

Update of

References

    1. Adeniyi PA, Shrestha A, Ogundele OM. Distribution of VTA glutamate and dopamine terminals, and their significance in CA1 neural network activity. Neuroscience. 2020;446:171–198. doi: 10.1016/j.neuroscience.2020.06.045. - DOI - PubMed
    1. Adeyelu T, Ogundele OM. VTA multifaceted modulation of CA1 local circuits. Neurobiology of Learning and Memory. 2023;202:107760. doi: 10.1016/j.nlm.2023.107760. - DOI - PubMed
    1. André MAE, Wolf OT, Manahan-Vaughan D. Beta-adrenergic receptors support attention to extinction learning that occurs in the absence, but not the presence, of a context change. Frontiers in Behavioral Neuroscience. 2015;9:125. doi: 10.3389/fnbeh.2015.00125. - DOI - PMC - PubMed
    1. Aronov D, Tank DW. Engagement of neural circuits underlying 2D spatial navigation in a rodent virtual reality system. Neuron. 2014;84:442–456. doi: 10.1016/j.neuron.2014.08.042. - DOI - PMC - PubMed
    1. Aston-Jones G, Bloom FE. Norepinephrine-containing locus coeruleus neurons in behaving rats exhibit pronounced responses to non-noxious environmental stimuli. The Journal of Neuroscience. 1981;1:887–900. doi: 10.1523/JNEUROSCI.01-08-00887.1981. - DOI - PMC - PubMed

LinkOut - more resources