. 2024 Nov;132(11):117001.
doi: 10.1289/EHP14334. Epub 2024 Nov 6.

A Prospective Analysis of Per- and Polyfluoroalkyl Substances from Early Pregnancy to Delivery in the Atlanta African American Maternal-Child Cohort

Affiliations

A Prospective Analysis of Per- and Polyfluoroalkyl Substances from Early Pregnancy to Delivery in the Atlanta African American Maternal-Child Cohort

Youran Tan et al. Environ Health Perspect. 2024 Nov.

Abstract

Background: Longitudinal trends in per- and polyfluoroalkyl substances (PFAS) serum concentrations across pregnancy have not been thoroughly examined, despite evidence linking prenatal PFAS exposures with adverse birth outcomes.

Objectives: We sought to characterize longitudinal PFAS concentrations across pregnancy and to examine the maternal-fetal transfer ratio among participants in a study of risk and protective factors for adverse birth outcomes among African Americans.

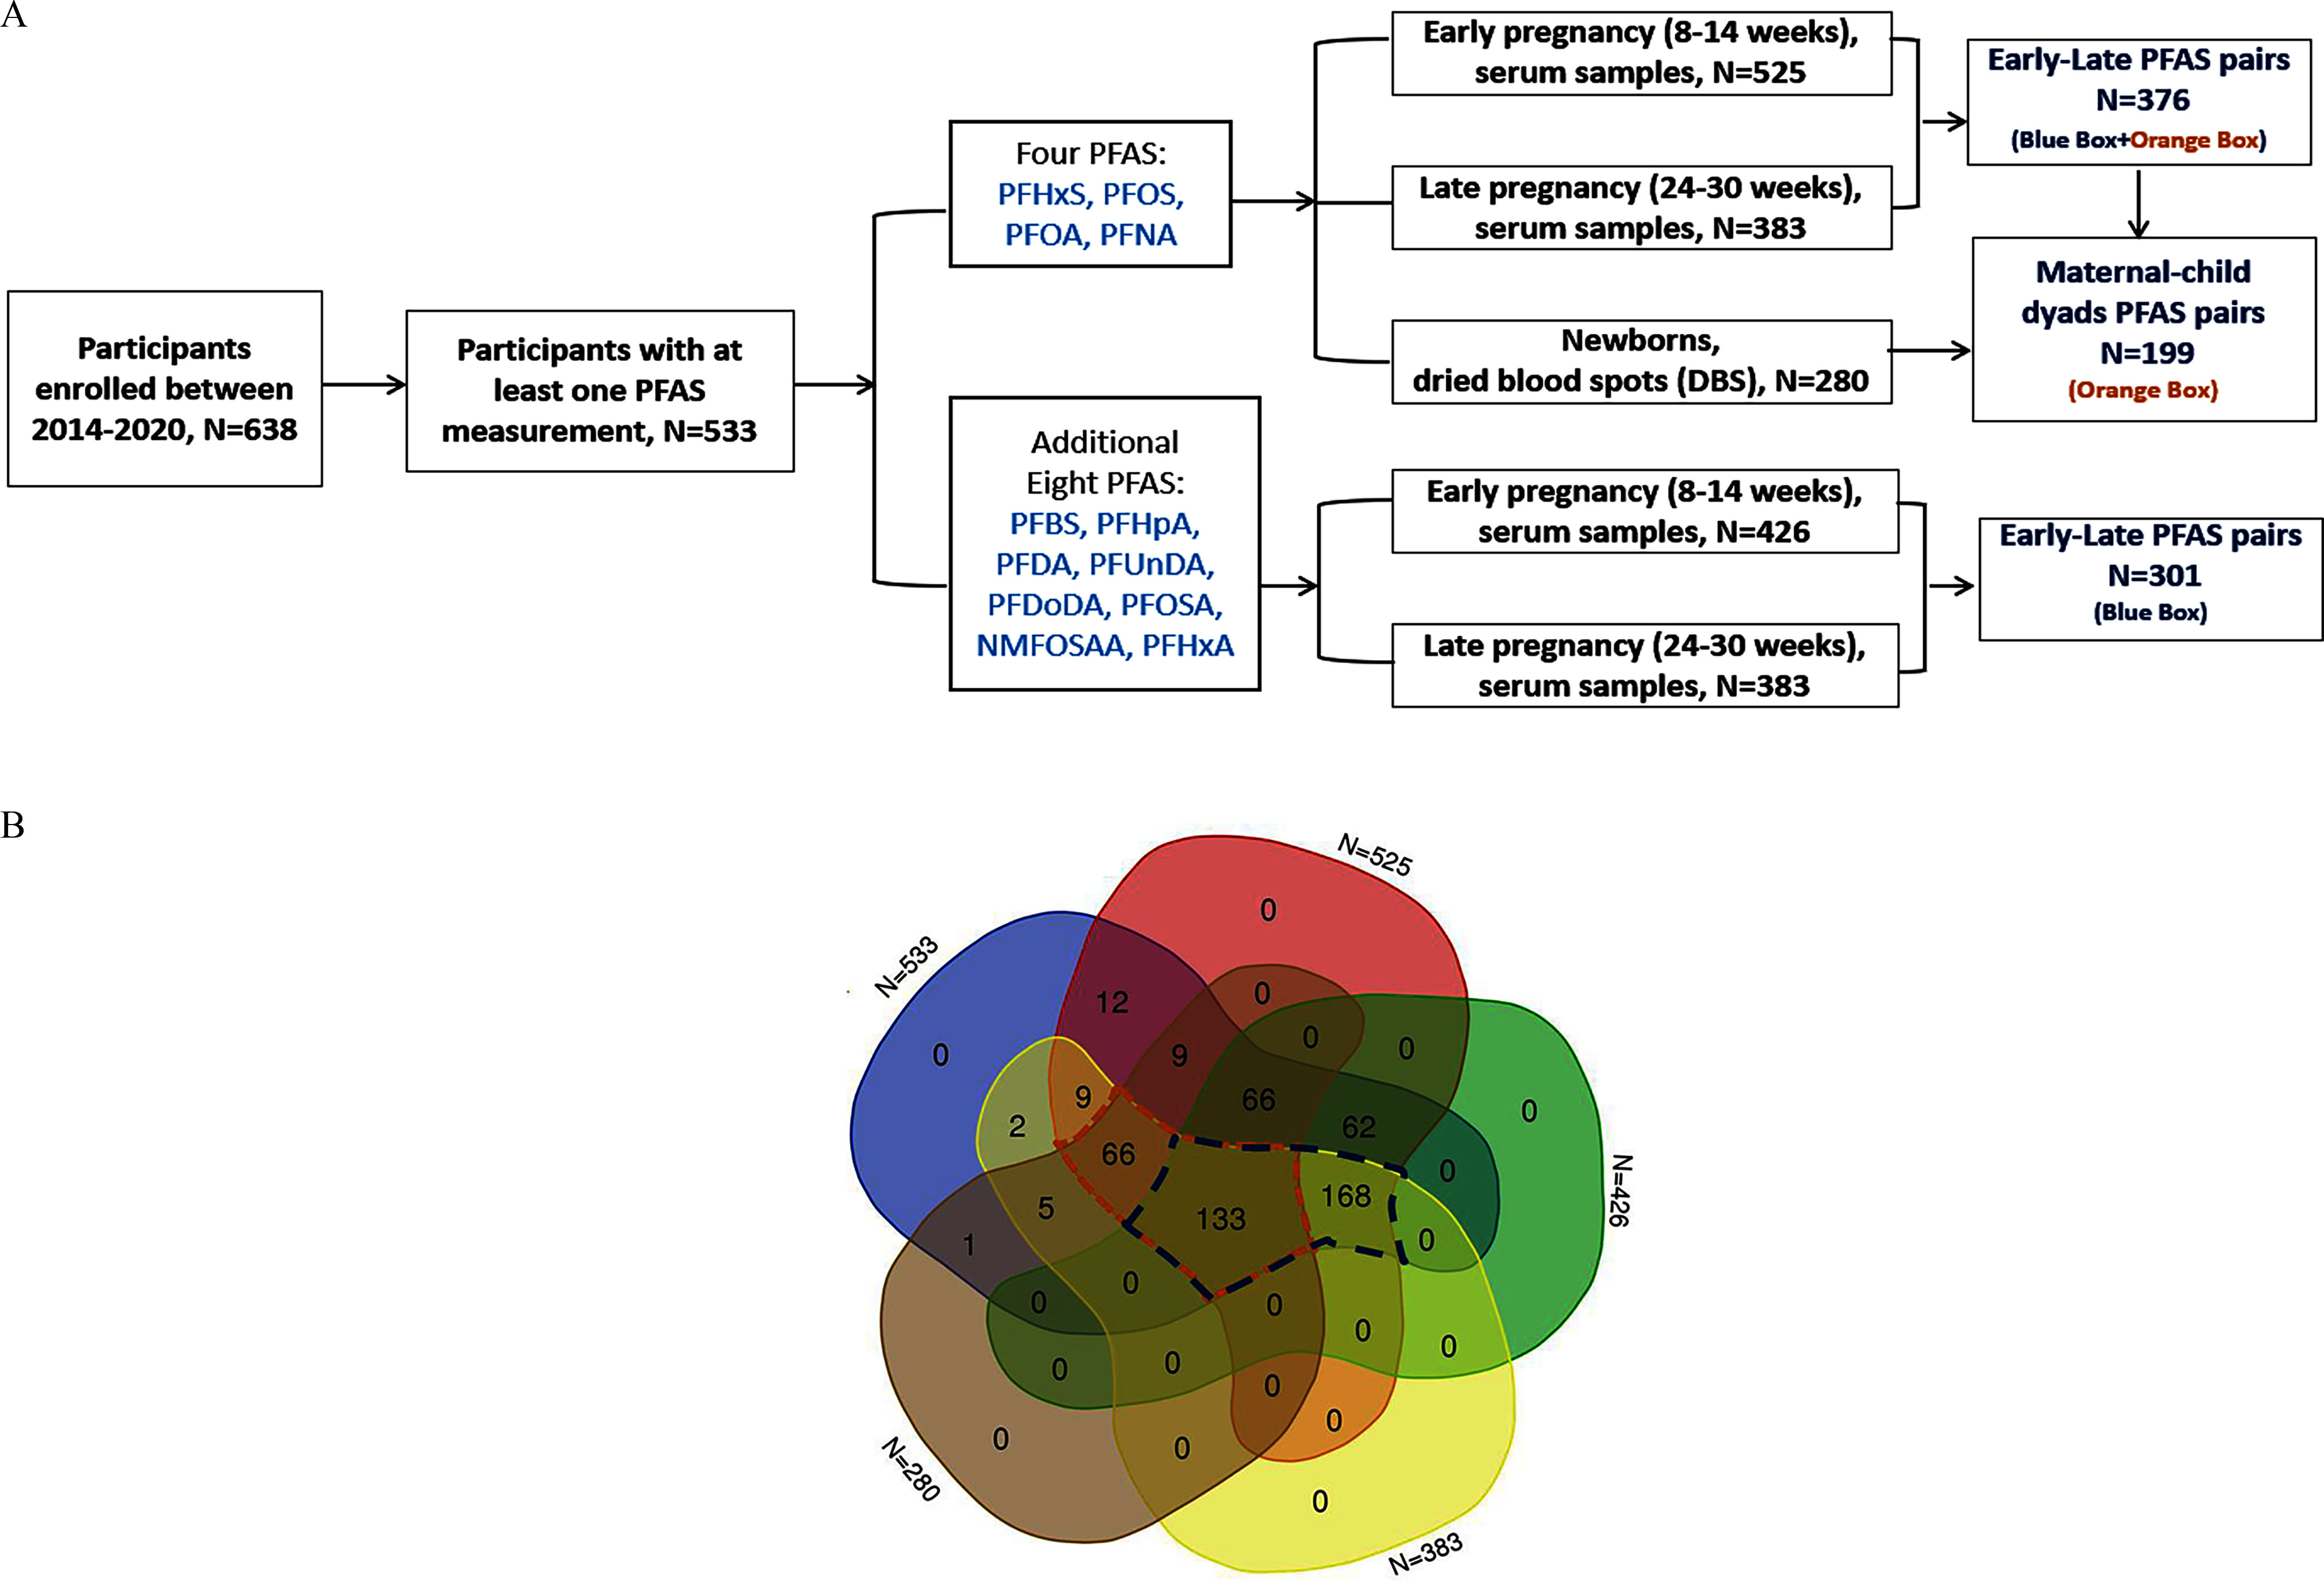
Methods: In the Atlanta African American Maternal-Child cohort (2014-2020), we quantified serum concentrations of four PFAS in 376 participants and an additional eight PFAS in a subset of 301 participants during early (8-14 weeks gestation) and late pregnancy (24-30 weeks gestation). Among these, PFAS concentrations were also measured among 199 newborns with available dried blood spot (DBS) samples. We characterized the patterns, variability, and associations in PFAS concentrations at different time points across pregnancy using intraclass correlation coefficients (ICCs), maternal-newborn pairs transfer ratios, linear mixed effect models, and multivariable linear regression, adjusting for socioeconomic and prenatal predictors.

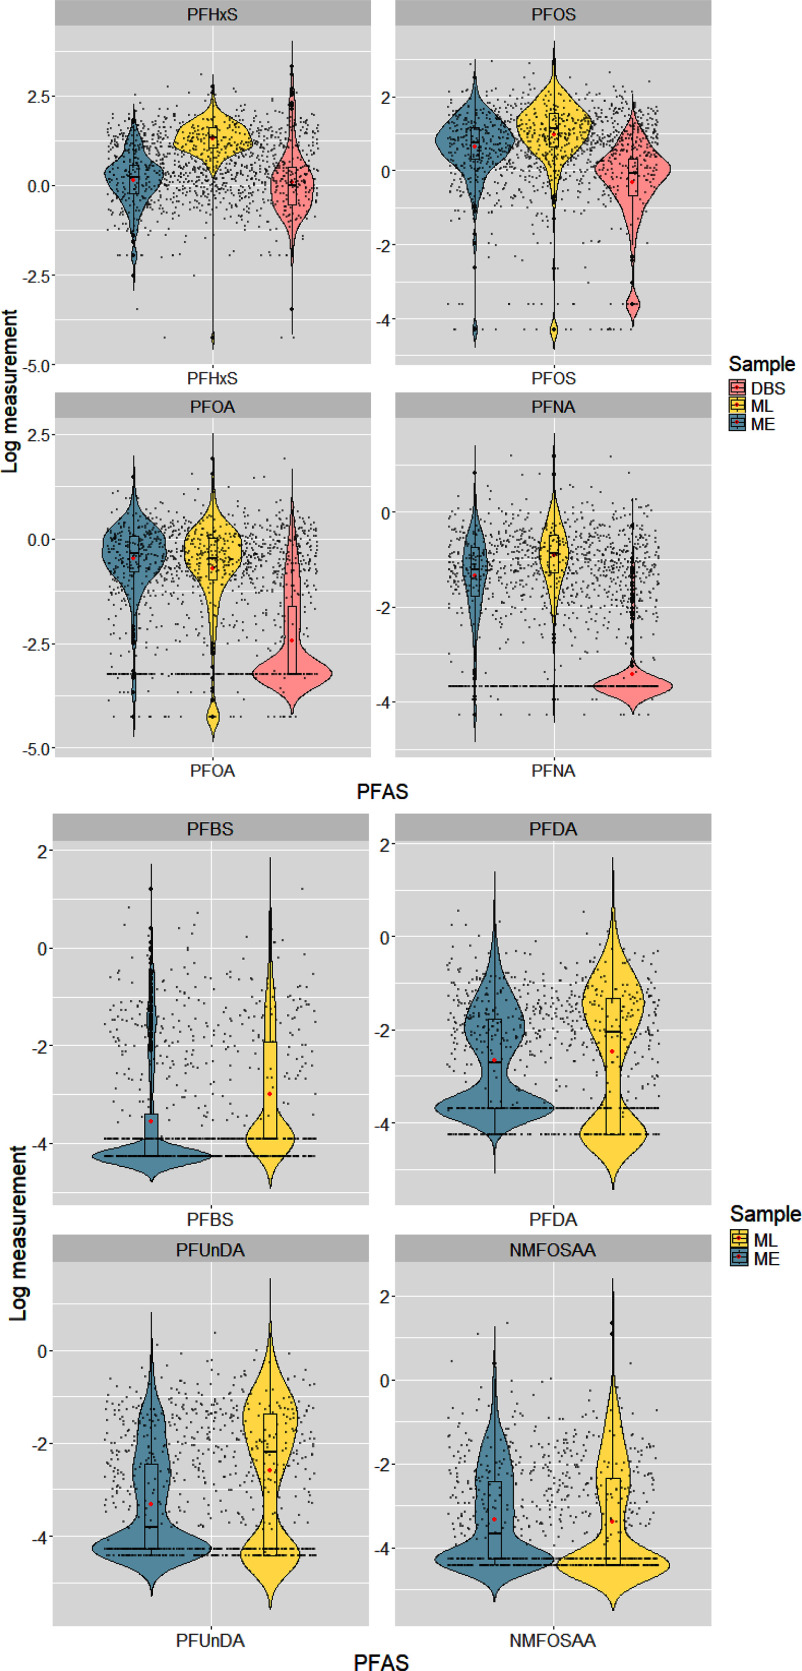
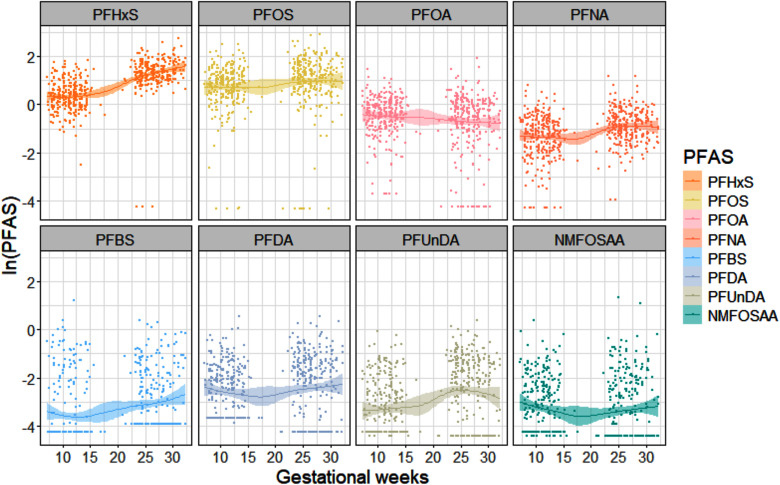
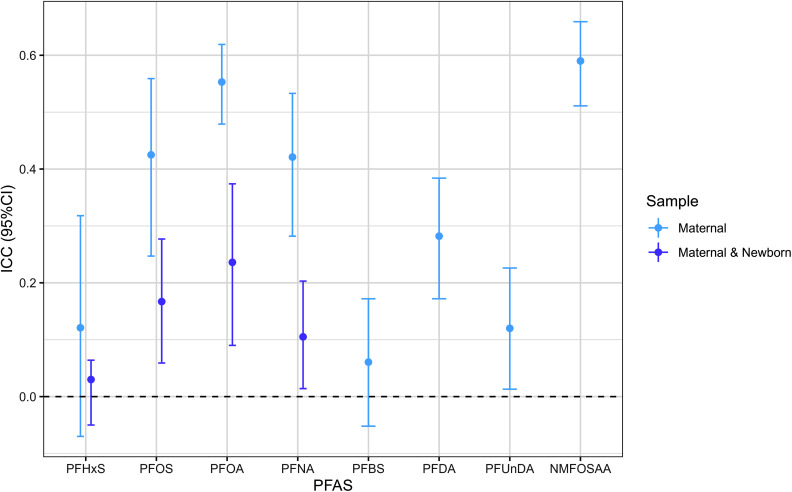
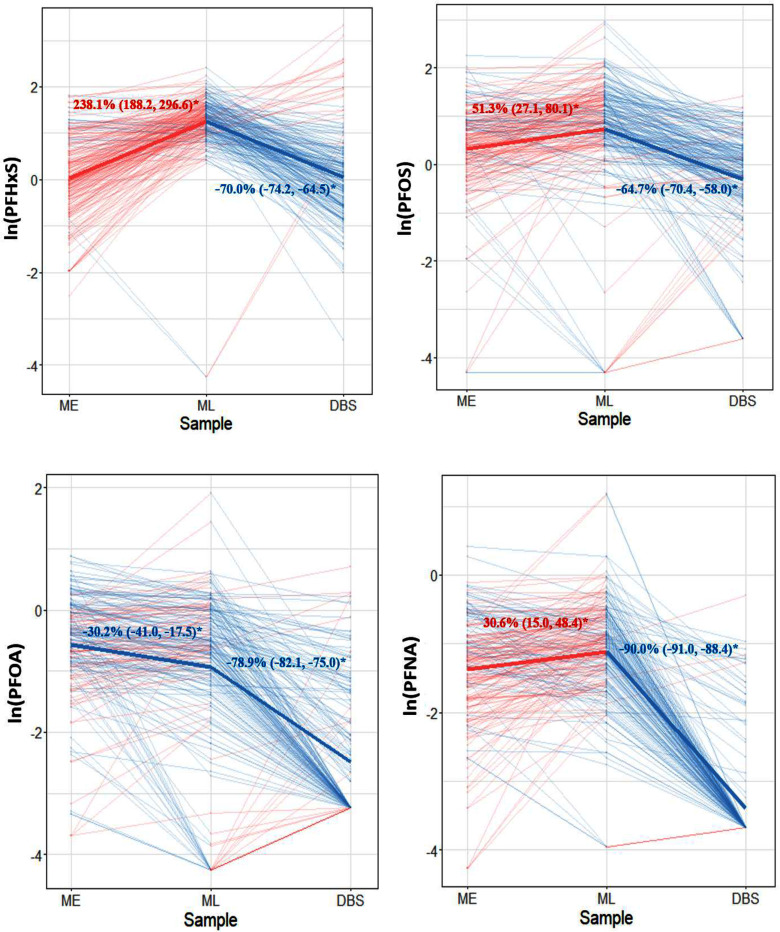
Results: Perfluorohexane sulfonic acid (PFHxS), perfluorooctane sulfonic acid (PFOS), perfluorooctanoic acid (PFOA), and perfluorononanoic acid (PFNA) were detected in >95% of maternal samples, with PFHxS and PFOS having the highest median concentrations. We observed high variability in PFAS concentrations across pregnancy time points (ICC=0.03-0.59). All median PFAS concentrations increased from early to late pregnancy, except for PFOA and N-methyl perfluorooctane sulfonamido acetic acid (NMFOSAA), which decreased [paired t-test for all PFAS p<0.05 except for PFOA and perfluorobutane sulfonic acid (PFBS)]. Prenatal serum PFAS were weakly to moderately correlated with newborn DBS PFAS (-0.05<rho <0.49). The median maternal-fetal PFAS transfer ratio was lower for PFAS with longer carbon chains. After adjusting for socioeconomic and prenatal predictors, in linear mixed effect models, the adjusted mean PFAS concentrations significantly increased during pregnancy, except for PFOA. In multivariable linear regression, PFAS concentrations in early pregnancy significantly predicted the PFAS concentrations in late pregnancy and in newborns.

Discussion: We found that the concentrations of most PFAS increased during pregnancy, and the magnitude of variability differed by individual PFAS. Future studies are needed to understand the influence of within-person PFAS variability during and after pregnancy on birth outcomes. https://doi.org/10.1289/EHP14334.


Figures

Figure 1A is a flowchart with six steps. Step 1: 638 participants enrolled between 2014 and 2020 led to 533 participants with at least one per- and polyfluoroalkyl substances. Step 2: 533 participants with at least one per- and polyfluoroalkyl substances is divided into two groups: four per- and polyfluoroalkyl substances, including perfluorohexane sulfonic acid, perfluorooctane sulfonic acid, perfluorooctanoic acid, and perfluorononanoic acid; and additional eight per- and polyfluoroalkyl substances, including perfluorobutanesulfonic acid, perfluoroheptanoic acid, perfluorodecanoic acid, perfluoroundecanoic acid, perfluorododecanoic acid, perfluorooctanesulfonamide, N-methyl perfluorooctane sulfonamido acetic acid, and perfluorohexanoic acid. Step 3: The four per- and polyfluoroalkyl substances, including perfluorohexane sulfonic acid, perfluorooctane sulfonic acid, perfluorooctanoic acid, and perfluorononanoic acid led to early pregnancy (8 to 14 weeks) with 525 serum samples, late pregnancy (24 to 30 weeks) with 383 serum samples, and newborns with 280 samples of dried blood spots (DBS). Step 4: The additional eight per- and polyfluoroalkyl substances, including perfluorobutanesulfonic acid, perfluoroheptanoic acid, perfluorodecanoic acid, perfluoroundecanoic acid, perfluorododecanoic acid, perfluorooctanesulfonamide, N-methyl perfluorooctane sulfonamido acetic acid, and perfluorohexanoic acid led to early pregnancy (8 to 14 weeks) with 426 serum samples and late pregnancy (24 to 30 weeks) with 383 serum samples. Step 5: The early pregnancy (8 to 14 weeks) with 525 serum samples and late pregnancy (24 to 30 weeks) with 383 serum samples led to 376 cases of early-late per- and polyfluoroalkyl substances pairs. The newborns with 280 samples of dried blood spots (DBS) led to 199 cases of maternal–newborn dyads per- and polyfluoroalkyl substances pairs. Step 6: The early pregnancy (8 to 14 weeks) with 426 serum samples and late pregnancy (24 to 30 weeks) with 383 serum samples led to 301 cases of early-late per- and polyfluoroalkyl substances pairs. Figure 1B is a Venn diagram displaying five parts, namely, 533 samples, 525 samples, 426 samples, 383 samples, and 280 samples. At the center, the intersection area is labeled 133.
Figure 1.
(A) Flowchart of participants with PFAS samples at different time points and (B) the overlap between different sample sizes from the Atlanta African American Maternal–Child Cohort included in our analytic samples, 2014–2020. The orange/blue box notes indicate the size of the paired samples: early-late four PFAS pairs: 133+168+66=376; early-late eight PFAS pairs: 133+168=301; maternal–newborn dyads: 66+133=199. Among N=533 participants, 2 participants were missing maternal demographic information. The demographic statistics Table S4 was thus based on N=531 participants. N=199 was used in the intraclass correlation coefficients (ICCs), transfer ratio, Spearman correlation among maternal–newborn dyads, linear mixed effect models, and multivariable linear regression. N=301/376 was used in the generalized additive models, ICCs, and Spearman correlation among maternal pairs. Note: NMFOSAA, N-methyl perfluorooctane sulfonamido acetic acid; PFAS, per- and polyfluoroalkyl substances; PFBS, perfluorobutanesulfonic acid; PFDA, perfluorodecanoic acid; PFDoDA, perfluorododecanoic acid; PFHpA, perfluoroheptanoic acid; PFHxA, perfluorohexanoic acid; PFHxS, perfluorohexane sulfonic acid; PFNA, perfluorononanoic acid; PFOA, perfluorooctanoic acid; PFOS, perfluorooctane sulfonic acid; PFOSA, perfluorooctanesulfonamide; PFUnDA, perfluoroundecanoic acid.
Figure 2 is a set of eight violin plots. The first four graphs are titled perfluorohexane sulfonic acid, perfluorooctane sulfonic acid, perfluorooctanoic acid, and perfluorononanoic acid, plotting log measurement, ranging from negative 5.0 to 2.5 in increments of 2.5; negative 4 to 2 in increments of 2; negative 5.0 to 2.5 in increments of 2.5; and negative 4 to 0 in increments of 2 (y-axis) across perfluorohexane sulfonic acid, perfluorooctane sulfonic acid, perfluorooctanoic acid, and perfluorononanoic acid, (x-axis) for sample, including dried blood spots, maternal late samples, and maternal early samples. The bottom four graphs under per- and polyfluoroalkyl substances are titled perfluorobutanesulfonic acid, perfluorodecanoic acid, perfluoroundecanoic acid, and N-methyl perfluorooctane sulfonamido acetic acid, plotting log measurement, ranging from negative 4 to 2 in increments of 2; negative 4 to 2 in increments of 2; negative 4 to 0 in increments of 2; and negative 4 to 2 in increments of 2 (y-axis) across perfluorobutanesulfonic acid, perfluorodecanoic acid, perfluoroundecanoic acid, and N-methyl perfluorooctane sulfonamido acetic acid (x-axis) for sample maternal late samples and maternal early samples.
Figure 2.
The distribution of natural log-transformed PFAS across maternal serum samples and newborn dried blood spots among study participants with paired samples available within the Atlanta African American Maternal–Child cohort, 2014–2020 (N=199 (left side) for mother–newborn dyads and N=301 (right side) for maternal early and late sample pairs). PFAS in DBS were normalized to serum concentrations for comparison with maternal serum PFAS. Medians and interquartile ranges are shown in the center box plots, and arithmetic means are indicated by red dots. Note: DBS, dried blood spots; ME, maternal early samples; ML, maternal late samples; NMFOSAA, N-methyl perfluorooctane sulfonamido acetic acid; PFAS, per- and polyfluoroalkyl substances; PFBS, perfluorobutanesulfonic acid; PFDA, perfluorodecanoic acid; PFHxS, perfluorohexane sulfonic acid; PFNA, perfluorononanoic acid; PFOA, perfluorooctanoic acid; PFOS, perfluorooctane sulfonic acid; PFUnDA, perfluoroundecanoic acid.
Figure 3 is a set of eight ribbon plots titled perfluorohexane sulfonic acid, perfluorooctane sulfonic acid, perfluorooctanoic acid, perfluorononanoic acid, perfluorobutanesulfonic acid, perfluorodecanoic acid, perfluoroundecanoic acid, and N-methyl perfluorooctane sulfonamido acetic acid, plotting natural logarithm (per- and polyfluoroalkyl substances), ranging from negative 4 to 2 in increments of 2 (y-axis) across gestational weeks, ranging from 10 to 30 in increments of 5 (x-axis) for per- and polyfluoroalkyl substances, including perfluorohexane sulfonic acid, perfluorooctane sulfonic acid, perfluorooctanoic acid, perfluorononanoic acid, perfluorobutanesulfonic acid, perfluorodecanoic acid, perfluoroundecanoic acid, and N-methyl perfluorooctane sulfonamido acetic acid.
Figure 3.
Generalized additive models (GAMs) plot of natural log-transformed PFAS (ng/mL) across gestational weeks using maternal serum sample pairs among study participants within the Atlanta African American Maternal–Child cohort, 2014–2020 [N=376 (top row) or N=301 (bottom row)]. Note: NMFOSAA, N-methyl perfluorooctane sulfonamido acetic acid; PFAS, per- and polyfluoroalkyl substances; PFBS, perfluorobutanesulfonic acid; PFDA, perfluorodecanoic acid; PFHxS, perfluorohexane sulfonic acid; PFNA, perfluorononanoic acid; PFOA, perfluorooctanoic acid; PFOS, perfluorooctane sulfonic acid; PFUnDA, perfluoroundecanoic acid.
Figure 4 is an error bar graph, plotting Intraclass correlation coefficients (95 percent confidence intervals), ranging from 0.0 to 0.6 in increments of 0.2 (y-axis) across per- and polyfluoroalkyl substances, including perfluorohexane sulfonic acid, perfluorooctane sulfonic acid, perfluorooctanoic acid, perfluorononanoic acid, perfluorobutanesulfonic acid, perfluorodecanoic acid, perfluoroundecanoic acid, and N-methyl perfluorooctane sulfonamido acetic acid (x-axis) for sample, including maternal and maternal and newborn.
Figure 4.
Intraclass correlation coefficients (ICCs) and 95% CIs of natural log-transformed PFAS concentrations among paired maternal samples [N=376 (PFHxS, PFOS, PFOA, and PFNA) or 301 (PFBS, PFDA, PFUnDA, and NMFOSAA)] and maternal–newborn pairs (N=199). The summary data can be found in Table S4. PFAS in DBS were normalized to serum concentrations for comparison with maternal serum PFAS. Samples measured below the LOD were imputed with the LOD divided by the square root of 2. Note: CI, confidence interval; DBS, dried blood spots; LOD, limit of detection; NMFOSAA, N-methyl perfluorooctane sulfonamido acetic acid; PFAS, per- and polyfluoroalkyl substances; PFBS, perfluorobutanesulfonic acid; PFDA, perfluorodecanoic acid; PFHxS, perfluorohexane sulfonic acid; PFNA, perfluorononanoic acid; PFOA, perfluorooctanoic acid; PFOS, perfluorooctane sulfonic acid; PFUnDA, perfluoroundecanoic acid.
Figure 5 is a set of four graphs, plotting natural logarithm (perfluorohexane sulfonic acid), ranging from negative 4 to 2 in increments of 2; natural logarithm (perfluorooctane sulfonic acid), ranging from negative 4 to 2 in increments of 2; and natural logarithm (perfluorooctanoic acid) ranging from negative 4 to 2 in increments of 2; natural logarithm (perfluorononanoic acid), ranging from negative 4 to 0 in increments of 2 (y-axis) across sample, including maternal early samples, maternal late samples, and dried blood spots (x-axis).
Figure 5.
Adjusted percentage change and 95% CIs for PFAS concentrations among maternal–newborn pairs (N=199) using linear mixed effect models. PFAS in DBS were normalized to serum concentrations for comparison with maternal serum PFAS. Samples measured below the LOD were imputed with the LOD divided by the square root of 2; models were adjusted for age, education, hospital site, parity, body mass index, alcohol, marijuana use, and infant sex. Thin lines represent individual trajectories of PFAS concentrations. Thick lines represent the adjusted mean concentrations of PFAS on population level for early pregnancy–late pregnancy and late pregnancy–delivery time points. Red and blue color indicate an increased or decreased PFAS, respectively. Statistically significant changes over time are indicated by an asterisk. Note: CI, confidence interval; DBS, dried blood spots; LOD, limit of detection; ME, maternal early samples; ML, maternal late samples; PFAS, per- and polyfluoroalkyl substances; PFHxS, perfluorohexane sulfonic acid; PFNA, perfluorononanoic acid; PFOA, perfluorooctanoic acid; PFOS, perfluorooctane sulfonic acid.

References

    1. Paul AG, Jones KC, Sweetman AJ. 2009. A first global production, emission, and environmental inventory for perfluorooctane sulfonate. Environ Sci Technol 43(2):386–392, PMID: 19238969, 10.1021/es802216n. - DOI - PubMed
    1. Zhang Z, Sarkar D, Biswas JK, Datta R. 2022. Biodegradation of per- and polyfluoroalkyl substances (PFAS): a review. Bioresour Technol 344(pt B):126223, PMID: 34756980, 10.1016/j.biortech.2021.126223. - DOI - PubMed
    1. Sunderland EM, Hu XC, Dassuncao C, Tokranov AK, Wagner CC, Allen JG. 2019. A review of the pathways of human exposure to poly-and perfluoroalkyl substances (PFASs) and present understanding of health effects. J Expo Sci Environ Epidemiol 29(2):131–147, PMID: 30470793, 10.1038/s41370-018-0094-1. - DOI - PMC - PubMed
    1. ATSDR (Agency for Toxic Substances and Disease Registry). 2022. Per- and Polyfluoroalkyl Substances (PFAS) and Your Health. What are the health effects of PFAS? https://www.atsdr.cdc.gov/pfas/health-effects/index.html [accessed 30 October 2024].
    1. Lau C, Anitole K, Hodes C, Lai D, Pfahles-Hutchens A, Seed J. 2007. Perfluoroalkyl acids: a review of monitoring and toxicological findings. Toxicol Sci 99(2):366–394, PMID: 17519394, 10.1093/toxsci/kfm128. - DOI - PubMed

LinkOut - more resources