. 2024 Nov 8;10(45):eadq0660.
doi: 10.1126/sciadv.adq0660. Epub 2024 Nov 6.

Endosomes serve as signaling platforms for RIG-I ubiquitination and activation

Affiliations

Endosomes serve as signaling platforms for RIG-I ubiquitination and activation

Kuan-Ru Chen et al. Sci Adv. .

Abstract

RIG-I-like receptors (RLRs) are cytosolic RNA sensors critical for antiviral immunity. RLR activation is regulated by polyubiquitination and oligomerization following RNA binding. Yet, little is known about how RLRs exploit subcellular organelles to facilitate their posttranslational modifications and activation. Endosomal adaptor TAPE regulates the endosomal TLR and cytosolic RLR pathways. The potential interplay between RIG-I signaling and endosomes has been explored. Here, we report that endosomes act as platforms for facilitating RIG-I polyubiquitination and complex formation. RIG-I was translocated onto endosomes to form signaling complexes upon activation. Ablation of endosomes impaired RIG-I signaling to type I IFN activation. TAPE mediates the interaction and polyubiquitination of RIG-I and TRIM25. TAPE-deficient myeloid cells were defective in type I IFN activation upon RNA ligand and virus challenges. Myeloid TAPE deficiency increased the susceptibility to RNA virus infection in vivo. Our work reveals endosomes as signaling platforms for RIG-I activation and antiviral immunity.


Figures
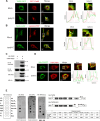
Fig. 1.
Fig. 1.. TAPE binds phosphoinositides and is located at endolysosomes during RIG-I signaling.
(A and B) HeLa cells were transfected with TAPE-EGFP and RFP-Rab5 (A) or Lamp1-RFP (B), and then transfected cells were mock-treated or treated with polyI:C transfection (tpolyI:C; 1 μg/ml) for 2 hours. Confocal microscopy was performed to examine the localization of fluorescent proteins in treated cells (left). The outlined areas are enlarged in the right panels (right). The fluorescent intensity of the white lines was quantified in the outlined regions (right). Scale bars, 10 μm. (C) HEK293T cells were transfected with HA-TAPE together with mRFP-Rab5. TAPE-Rab5 interaction was examined by the immunoprecipitation (IP)–Western blot (WB) analysis. (D) Similar to (A), HeLa cells were transfected with TAPE-RFP and a mitochondrial marker Mito-PAGFP. Confocal microscopy examined the colocalization of TAPE and mitochondria in cells before and after polyI:C transfection. Scale bars, 10 μm. (E) The phospholipid composition of each dot on the PIP strip was shown (left), including LPA, lysophosphatidic acid; LPC, lysophosphatidylcholine; PE, phosphatidylethanolamine; PC, phosphatidylcholine; S1P, sphingosine 1-phosphate; PA, phosphatidic acid; PS, phosphatidylserine. The PIP strip was probed with recombinant HA-tagged TAPE or TAPE-ΔC2 and then subjected to WB with HA antibody (middle). Schematic structure of hemagglutinin (HA)–tagged TAPE and TAPE-ΔC2 (upper right). The binding intensity was quantified by ImageJ (lower right).
Fig. 2.
Fig. 2.. RIG-I is translocated to TAPE- and Rab5-containing endosomes to form signaling complexes upon RIG-I ligand stimulation.
(A) HeLa cells transfected with GFP–RIG-I and TAPE-RFP were mock-treated or transfected with 5′-triphosphate RNA (5′ppp RNA; 1 μg/ml) for 4 hours. These cells were subjected to confocal microscopic analyses. Arrows indicated the merged speckles. (B) Similar to (A), FITC-labeled polyI:C (1 μg/ml) was transfected into HeLa cells expressing RIG-I–CFP and TAPE-RFP for 1.5 hours. The outlined area is enlarged to show merged speckles (right). (C) Confocal images of HeLa cells transfected with GFP–RIG-I and Rab5-RFP before and after polyI:C transfection for the indicated times (left). The outlined regions are magnified (middle). The fluorescent intensity of the white lines was measured in the areas (right). (D) Confocal images of HeLa cells transfected with GFP–RIG-I and Rab7-RFP before and after polyI:C transfection for the indicated times (left). The outlined regions are magnified (right). (E) Confocal images of HeLa cells transfected with GFP–RIG-I and FLAG-MAVS before and after polyI:C transfection for the indicated times (left). FLAG-MAVS was immunostained by the anti-FLAG antibody. (F) HEK293T cells were transfected with Flag–RIG-I alone or with RFP-Rab5 and then left untreated or treated with IAV RNA transfection for 3 hours. The IP-WB analysis examined RIG-I interaction with Rab5. (G) Confocal images of HeLa cells transfected with TAPE-CFP, GFP–RIG-I, and RFP-Rab5 before and after 5′ppp RNA (1 μg/ml) stimulation. Arrows denote speckles formed by TAPE-CFP, GFP–RIG-I, and RFP-Rab5. Scale bars, (A to E and G) 10 μm.
Fig. 3.
Fig. 3.. RIG-I engages with TAPE- and Rab5-containing endosomes upon RNA virus infection.
(A and B) HeLa cells transfected with GFP–RIG-I and TAPE-RFP (A) or RFP-Rab5 (B) were mock-treated or infected with SeV (50HA). Confocal microscopy examined the colocalized speckles in cells and 4′,6-diamidino-2-phenylindole (DAPI)–stained nuclei at indicated times. The outlined areas and the fluorescent intensity of the lines are shown (middle and right). (C) HeLa cells transfected with GFP–RIG-I were mock-treated or infected with SeV (50 HA) for indicated times and then immunostained by an antibody against endogenous HSP60, another mitochondrial marker. Confocal microscopy examined the colocalized speckles in cells and DAPI-stained nuclei. Scale bars, 10 μm.
Fig. 4.
Fig. 4.. Endosomes are implicated in RIG-I signaling to the activation of type I IFN.
(A and B) HEK293 cells treated with the indicated siRNAs for 48 hours were transfected with an IFN-β luciferase reporter (IFN-β–Luc) with RIG-I (A) or TLR3 (B) and then treated with IAV-infected RNA transfection (0.2 μg/ml) (A) or polyI:C (50 μg/ml) (B). After 16 hours, these cells were harvested to measure the IFN-β promoter activity. (C and D) Similar to (A) and (B), an NF-κB luciferase reporter (pELAM-Luc) was used to analyze the knockdown effect of endoslysosomal proteins on RIG-I (C) to TLR3 (D) signaling to the NF-κB promoter. (E) HEK293 cells treated with the indicated siRNAs were transfected with IFN-β–Luc with RIG-I–CARD or MAVS to analyze the IFN-β promoter activity. (F and G) HEK293 cells transfected with RIG-I plus IFN-β–Luc were treated with chloroquine (5 and 30 μg/ml) (F) or bafilomycin A1 (10, 100, and 300 nM) (G) for 30 min, and then stimulated with IAV infected RNA (0.2 μg/ml) for analyzing the IFN-β promoter activity. (H and I) Human monocyte-derived macrophages were treated with indicated siRNAs and then stimulated with polyI:C (1 μg/ml) transfection. Supernatants from treated cells were subjected to ELISA to measure IFN-α and TNF-α production. (J) Human monocyte-derived macrophages were treated with chloroquine and then stimulated with polyI:C transfection to analyze IFN-α production by ELISA. (K) Human monocyte-derived macrophages were infected with dengue virus [DENV; 10 multiplicity of infection (MOI)] for 24 hours. Supernatants from infected cells were subjected to ELISA for IFN-β production. Data are representative of two or three independent experiments with similar results. *P < 0.05, **P < 0.01, and ***P < 0.001, Student’s t test. ns (not significant), P > 0.05.
Fig. 5.
Fig. 5.. TAPE mediates the interaction and polyubiquitination of RIG-I and TRIM25.
(A) HEK293T cells were transduced by lentiviruses containing control shRNA (Scramble) and two TAPE shRNAs (TAPE-1 and TAPE-2), respectively, for puromycin selection for 48 hours. These cells were then transfected with HA-tagged K63-ubiquitin (HA-K63-Ub) with the expression construct GST or GST–RIG-I–CARD. The cell lysates were subjected to the pull-down (PD)–WB analysis with the indicated antibodies (top). WB examined the cell lysates to check indicated protein expression and knockdown efficiency (bottom). (B) WT (control) and TAPE KO HEK293T cells transfected with HA-K63-Ub with GST or GST–RIG-I–CARD were subjected to the PD-WB analysis with the indicated antibodies (top). WB examined the expression of transfected GST, GST–RIG-I–CARD, and the endogenous TAPE with the indicated antibodies (bottom). (C) WT and TAPE KO HEK293T cells transfected with Flag–RIG-I alone or plus HA-K63-Ub were subjected to the IP-WB analysis (top). The expression of transfected constructs was examined by WB (bottom). (D) HEK293T cells transfected with Flag-TRIM25 alone or with TAPE-EGFP were subjected to the IP-WB analysis. (E) Confocal images of HeLa cells transfected with TAPE-GFP and flag-TRIM25. After transfection for 24 hours, these cells were transfected with polyI:C and then immunostained by the anti-flag antibody (left). The outlined regions are zoomed in the middle panels (middle). The fluorescent intensity of the white lines was measured in the areas (right). (F) WT and TAPE KO HEK293T cells transfected with Flag-TRIM25 alone or the indicated constructs were subjected to the IP-WB analysis. Scale bars, 10 μm. (G) WT and TAPE KO HEK293T cells transfected with Flag–RIG-I and Myc-TRIM25 were subjected to the IP-WB analysis (top). The expression of transfected constructs and endogenous TAPE was examined by WB (bottom).
Fig. 6.
Fig. 6.. Mapping the interaction domains between TAPE and RIG-I, as well as MAVS.
(A) Schematic structure of the RIG-I and TAPE mutants. (B) As indicated, HEK293T cells were transfected with HA-TAPE alone or plus Flag–RIG-I and its deletion mutants. These cell lysates were subjected to the IP-WB analysis with indicated antibodies. (C) Similar to (B), HEK293T cells were transfected with Flag–RIG-I alone or combined with HA-TAPE and its deletion mutants for the IP-WB analysis with indicated antibodies. (D) HEK293T cells were transfected with Flag-MAVS with HA-TAPE and its deletion mutants and were subjected to the IP-WB analysis with the indicated antibodies. (E) HEK293T cells were cotransfected with TAPE-EGFP and HA-TAPE for the IP-WB analysis. (F) TAPE KO HEK293T cells were transfected with MAVS-His plus HA-TAPE and its deletion mutants and then examined by the IP-WB analysis with indicated antibodies. (G) Schematic structure of the HA-tagged MAVS truncated mutants containing amino acids (aa) 1 to 180, 180 to 360, 360 to 540, and 180 to 540, respectively. (H) HEK293T cells were transfected with TAPE-EGFP and HA-MAVS mutants, as indicated. TAPE interaction with MAVS deletion mutants was examined by the IP-WB analysis.
Fig. 7.
Fig. 7.. TAPE deficiency impairs RIG-I signaling in mouse embryonic fibroblasts, conventional DCs, and macrophages.
(A to C) WB analysis of IRF3 phosphorylation in wild type (WT) and TAPE KO MEFs transfected with polyI:C (1 μg/ml) (A), IAV-infected RNA (1 μg/ml) (B), or infected with IAV (1 MOI) (C). (D and E) WT and TAPE KO MEFs were infected with the Dengue virus (5 MOI) for 36 hours, and supernatants from treated MEFs were subjected to ELISA for IFN-β (D) and RANTES (E) production. (F) Ifnb mRNA expression levels in WT and TAPE KO MEFs expressing the active mutant RIG-I–CARD were measured by qRT-PCR. (G) Endogenous TAPE protein levels in indicated BMDCs or BMDMs were analyzed by WB with anti-CC2D1A/TAPE antibody. (H) Conventional DCs (cDCs) from Tapef/f and Tapef/f Cd11c-Cre mice were transfected with polyI:C (0.5 μg/ml) or 5′pppRNA (135 nt, 0.5 μg/ml) for ELISA of IFN-β production. (I) WB analysis of IRF3 phosphorylation in indicated cDCs transfected with polyI:C (1 μg/ml) or IAV-infected RNA (1 μg/ml) for 2 hours. (J) WB analysis of IRF3 phosphorylation in indicated BMDMs transfected with polyI:C (1 μg/ml). (K to N) Indicated cDCs were infected with IAV (PR8, 10 MOI) for 24 hours. ELISA analyzed supernatants from infected cells for IFN-β (K), IFN-α (L), RANTES (M), and IL-6 (N). (O and P) Indicated BMDMs were stimulated with polyI:C (1 μg/ml) transfection (O) or SeV (50 HA) infection (P) for measuring the IFN-β production by ELISA. Data are representative of two or three independent experiments with similar results. *P < 0.05, **P < 0.01, and ***P < 0.001, unpaired t test.
Fig. 8.
Fig. 8.. TAPE deficiency in myeloid cells increases the susceptibility to RNA virus infection in vivo.
(A and B) Tapef/f (n = 6) and Tapef/f Cd11c-Cre mice (n = 7) were infected intranasally with IAV [PR/8/34, 10 plaque-forming units (PFU)], and the weight loss and survival rates of animals were monitored daily for 14 days. The weight loss difference between the two groups was statistically significant (***P < 0.001 by two-way ANOVA) (A). Individual weight loss of each mouse during the course and the weight loss of mice more than 20% was considered to reach the endpoint. (B) Kaplan-Meier survival curves of the two groups were significant (***P < 0.001 by log-rank test). (C) Survival of WT (n = 4, 6 to 7 weeks old) and Tapef/f Vav1-Cre (n = 6, 6 to 7 weeks old) mice after intranasal infection with IAV (PR/8/34 natural propagation strain, 103 PFU). Kaplan-Meier survival curves of the two groups were significant (*P < 0.05 by log-rank test). (D) Similar to (A), Tapef/f (n = 8) and Tapef/f Cd11c-Cre mice (n = 9) were challenged with IAV (PR/8/34, 50 PFU) by intranasal infection. The plaque assay measured the lung viral titers 6 days after infection (**P < 0.005 by the Mann-Whitney U test). (E) Pathology of Tapef/f and Tapef/f Cd11c-Cre mice in response to IAV infection. Hematoxylin and eosin staining of lung sections similar to (A), Tapef/f (n = 5) and Tapef/f Cd11c-Cre mice (n = 4) were challenged with Dulbecco’s PBS and IAV (PR/8/34, 10 PFU) by intranasal infection. The lung sections were collected in 7 days after infection. Scale bars, 200 μm (for 4×) and 50 μm (for 20×). (F) Survival of Tapef/f (n = 7) and Tapef/f Cd11c-Cre mice (n = 5) after intranasal infection with VSV (3 × 10³ PFU). Kaplan-Meier survival curves of the two groups were significant (**P < 0.005 by log-rank test).
Fig. 9.
Fig. 9.. Model for RIG-I signaling on endosomes.
Upon virus infection by the endocytic pathways, RIG-I is recruited to the cytosolic side of endosomes to detect viral RNA released from the virus-endosome fusion. The endosomal adaptor TAPE mediates the assembly of the RIG-I signaling complex by promoting the interaction and polyubiquitination of RIG-I and TRIM25. Consequently, the RIG-I signaling complex triggers MAVS-mediated downstream signaling.

References

    1. Lazear H. M., Schoggins J. W., Diamond M. S., Shared and distinct functions of type I and type III interferons. Immunity 50, 907–923 (2019). - PMC - PubMed
    1. McNab F., Mayer-Barber K., Sher A., Wack A., O’Garra A., Type I interferons in infectious disease. Nat. Rev. Immunol. 15, 87–103 (2015). - PMC - PubMed
    1. Ye L., Schnepf D., Staeheli P., Interferon-λ orchestrates innate and adaptive mucosal immune responses. Nat. Rev. Immunol. 19, 614–625 (2019). - PubMed
    1. Chow K. T., Gale M. Jr., Loo Y. M., RIG-I and other RNA sensors in antiviral immunity. Annu. Rev. Immunol. 36, 667–694 (2018). - PubMed
    1. Liu G., Gack M. U., Distinct and orchestrated functions of RNA sensors in innate immunity. Immunity 53, 26–42 (2020). - PMC - PubMed

LinkOut - more resources