. 2024 Nov 8;10(45):eadr3997.
doi: 10.1126/sciadv.adr3997. Epub 2024 Nov 6.

Dormancy-inducing 3D engineered matrix uncovers mechanosensitive and drug-protective FHL2-p21 signaling axis

Affiliations

Dormancy-inducing 3D engineered matrix uncovers mechanosensitive and drug-protective FHL2-p21 signaling axis

Sadra Bakhshandeh et al. Sci Adv. .

Abstract

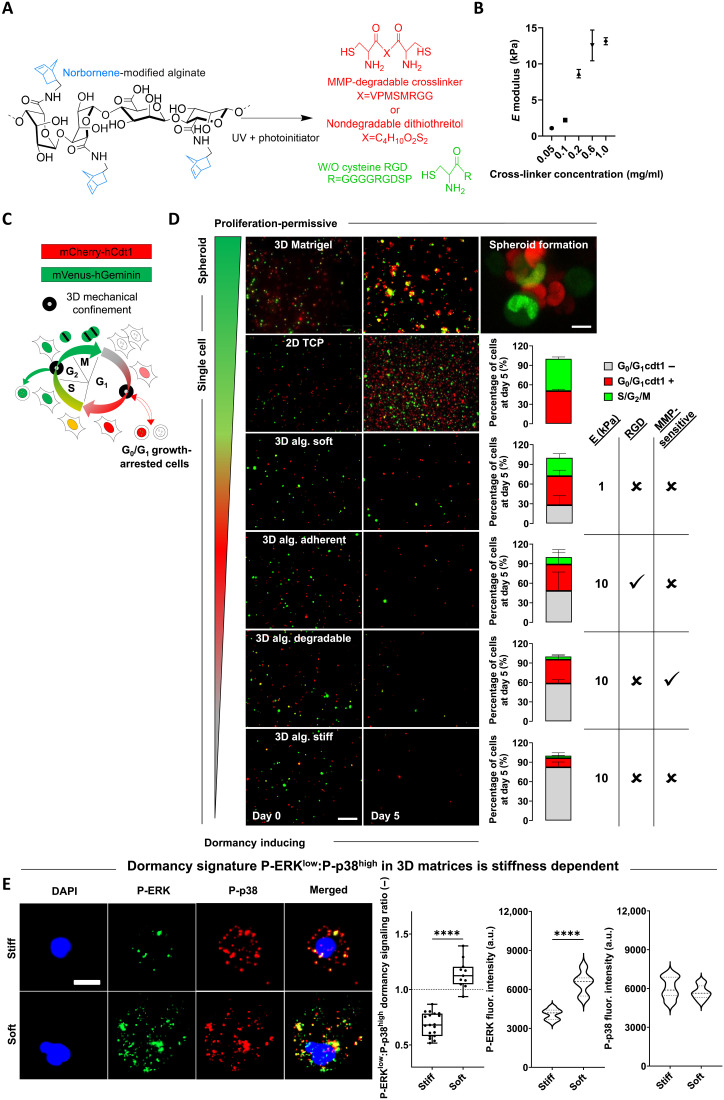
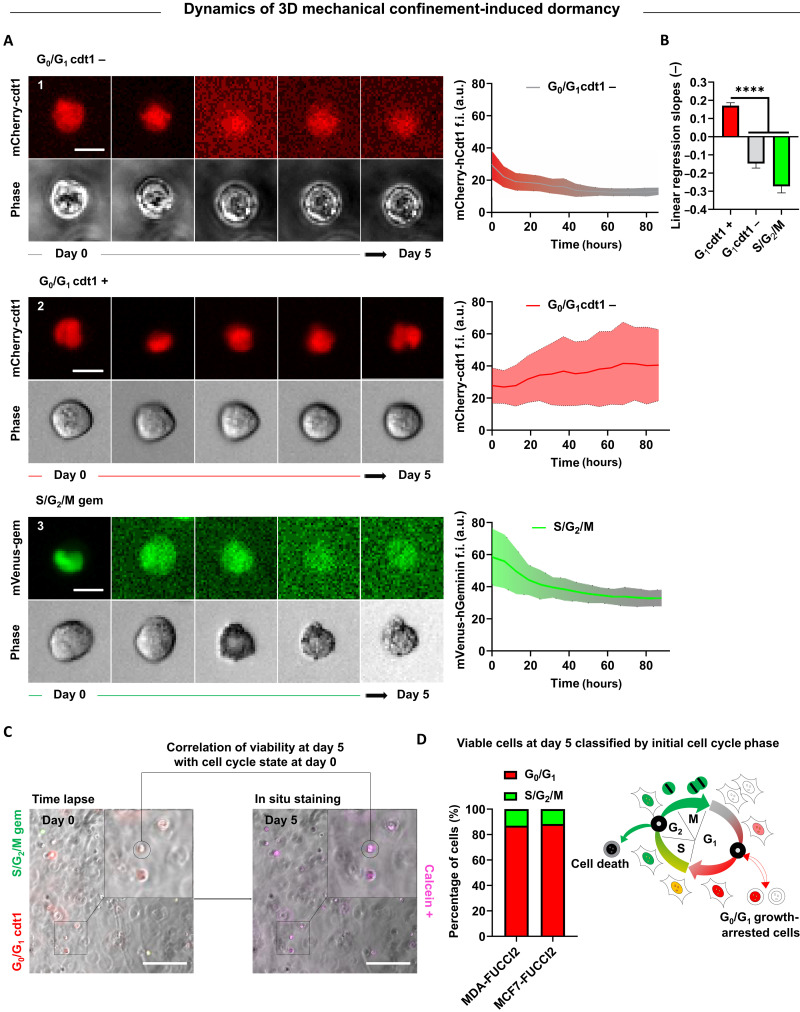
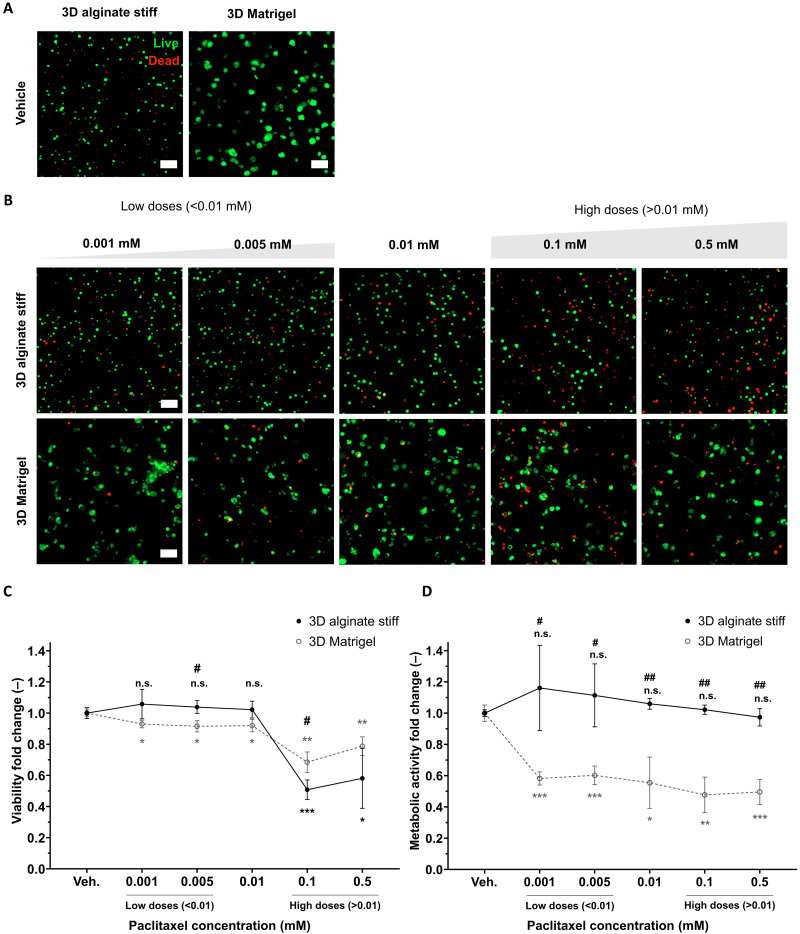
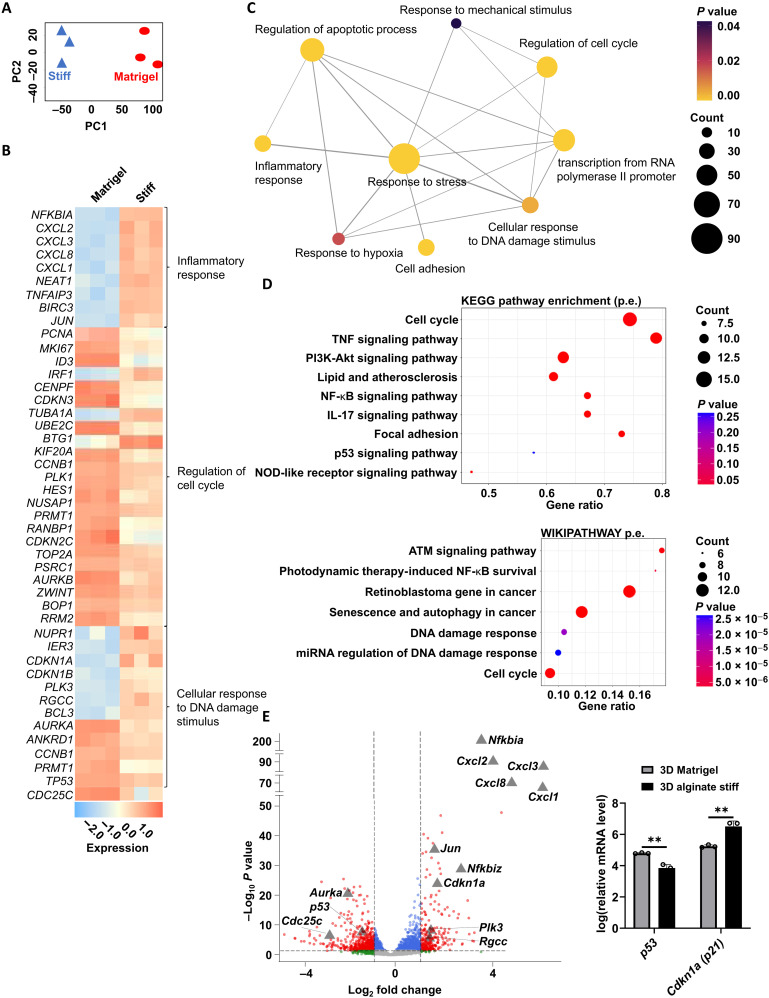
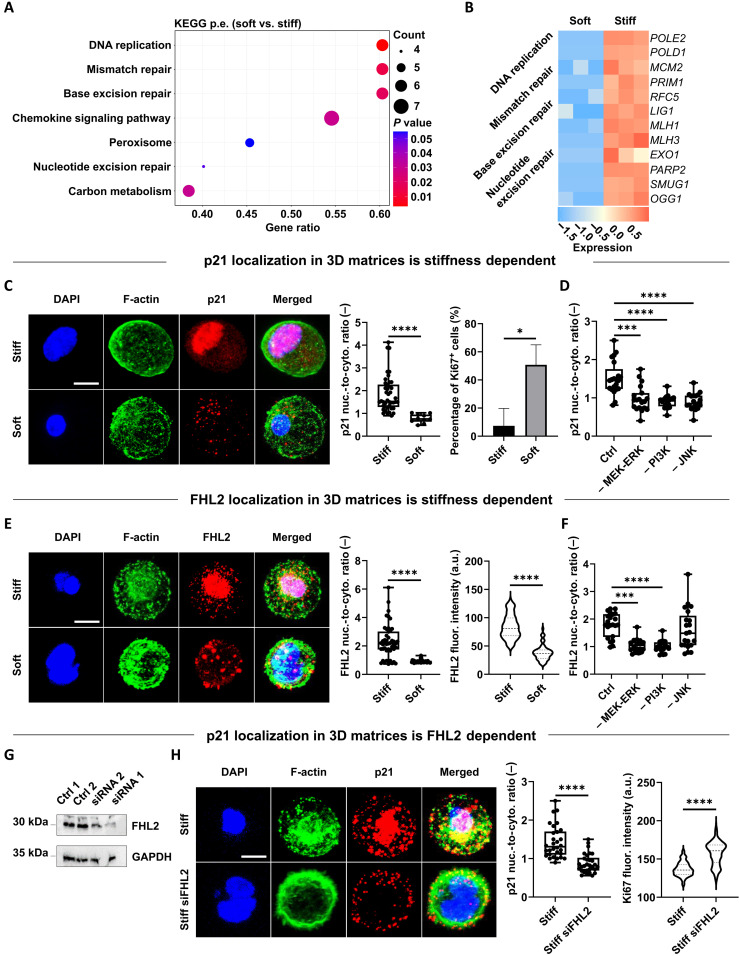
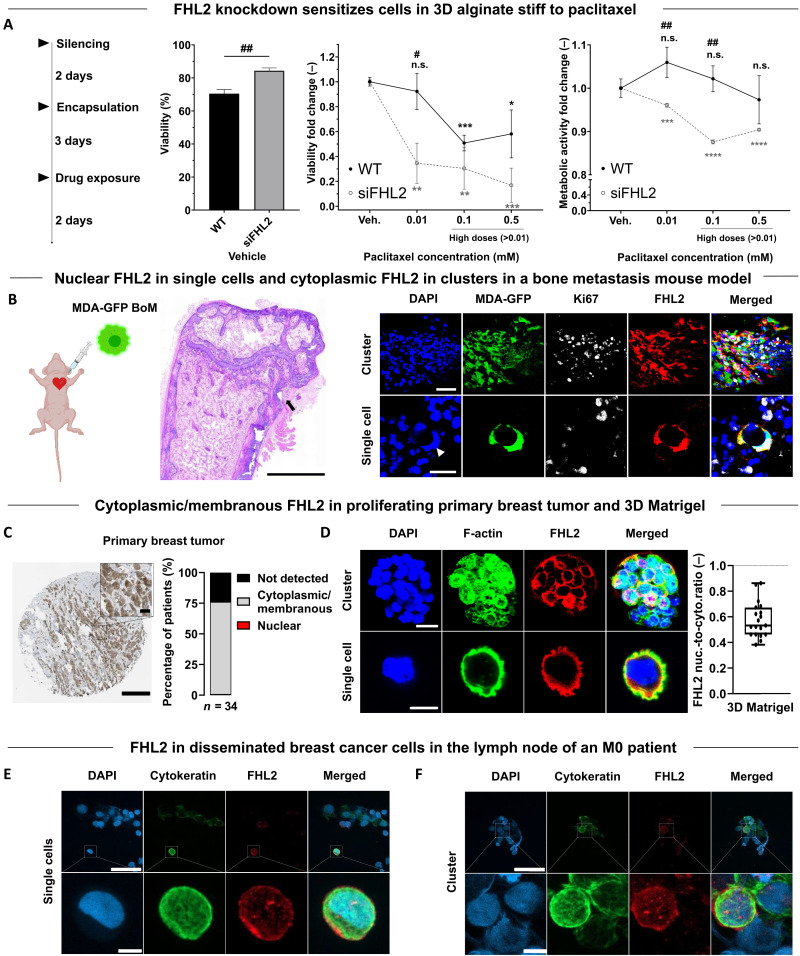
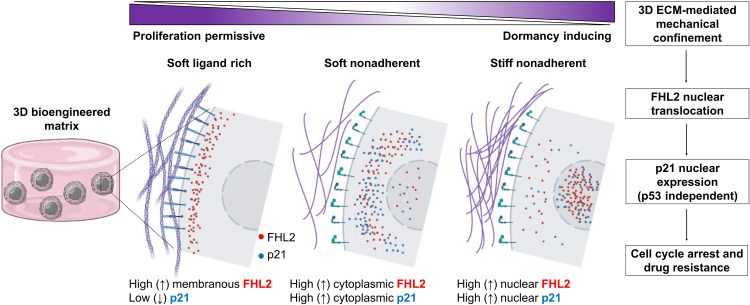
Solid cancers frequently relapse with distant metastasis, despite local and systemic treatment. Cellular dormancy has been identified as an important mechanism underlying drug resistance enabling late relapse. Therefore, relapse from invisible, minimal residual cancer of seemingly disease-free patients call for in vitro models of dormant cells suited for drug discovery. Here, we explore dormancy-inducing 3D engineered matrices, which generate mechanical confinement and induce growth arrest and survival against chemotherapy in cancer cells. We characterized the dormant phenotype of solitary cells by P-ERKlow:P-p38high dormancy signaling ratio, along with Ki67- expression. As underlying mechanism, we identified stiffness-dependent nuclear localization of the four-and-a-half LIM domain 2 (FHL2) protein, leading to p53-independent high p21Cip1/Waf1 nuclear expression, validated in murine and human tissue. Suggestive of a resistance-causing role, cells in the dormancy-inducing matrix became sensitive against chemotherapy upon FHL2 down-regulation. Thus, our biomaterial-based approach will enable systematic screens for previously unidentified compounds suited to eradicate potentially relapsing dormant cancer cells.


Figures

Fig. 1.
Fig. 1.. 3D mechanical confinement via covalently cross-linked alginate yields distinct fractions and populations of growth-arrested cells based on hydrogel composition.
(A) Bis-cysteine enzymatically (MMP) degradable peptide or non-degradable dithiothreitol (DTT) (red) cross-link with norbornene-modified alginate (blue-black) in the presence or absence of cysteine-coupled RGD molecules (green). (B) Frequency sweep of norbornene-modified alginate (no RGD) with different concentrations of DTT cross-linker yields a range of stiffness (elastic/Young’s moduli) (n = 3). (C) Diagram of FUCCI2 cell cycle reporter activity (G0/G1, mCherry-hCdt1; and S/G2/M, mVenus-hGeminin). The cartoon was adapted from (40), Copyright (2008), with permission from Elsevier. (D) Time-lapse imaging (5 days) of MDA-MB-231–FUCCI2 cells within a range of proliferation-permissive and dormancy-inducing hydrogels with distinct stiffness, adhesion, and degradation properties (right-hand–side table). Representative time-lapse fluorescence maximum projections at days 0 and 5; scale bar, 200 μm. For 3D Matrigel spheroid image: scale bar, 10 μm. Percentage bar plots show fraction of cell cycle distribution at day 5 for different experimental groups (n ≥ 3 gels for 82 to 453 cells). (E) Representative images of P-ERK and P-p38 for MDA-MB-231 cells within 3D stiff and soft alginate hydrogels after 5 days of encapsulation [blue, 4′,6-diamidino-2-phenylindole (DAPI); green, P-ERK; and red, P-p38]. Scale bar, 10 μm; P-ERKlow:P-p38high ratio quantification in based on each phosphorylated protein fluorescence intensity (f.i.; a.u., arbitrary units) per cell (n = 10 to 20 single cells per condition). Student’s t test, ****P < 0.0001.
Fig. 2.
Fig. 2.. Dynamics of cell cycle and viability correlation reveal that G0/G1 cells are substantially more resistant to 3D mechanical confinement than cells in the S/G2/M phase.
(A) Representative time-lapse images of single MDA-MB-231–FUCCI2 cells in 3D alginate stiff hydrogels with respective single cell longitudinal tracking of mCherry-hCdt1 and mVenus-hGeminin f.i. (a.u.). Center trace and shaded area indicate mean and SD (n ≥ 15 cells). Scale bar, 10 μm. (B) Comparison of linear regression slopes from f.i. tracking graph. Kruskal-Wallis test with Dunn’s correction, ****P < 0.0001. (C) Experimental workflow for longitudinal correlation of FUCCI2 initial cell cycle state within 3D alginate stiff hydrogels and viability after 5 days of encapsulation. Cells were stained in situ for viability after 5 days in time lapse, and the selected cells (calcein+) were tracked back to their initial cell cycle state (time of encapsulation). Scale bars, 200 μm. (D) Percentage bar plots show fraction of viable cells with respect to their initial cell cycle state for MDA-MB-231–FUCCI2 and MCF7-FUCCI2 cells (n ≥ 241 cells pooled from three independent experiments). Diagram of cell cycle progression under 3D mechanical confinement, revealing growth arrest and higher resilience for cells in G0/G1 and death for cells in S/G2/M. The cartoon was adapted from (40), Copyright (2008), with permission from Elsevier.
Fig. 3.
Fig. 3.. Growth-arrested viable BCCs within 3D alginate stiff gels are more resistant to cell cycle–specific paclitaxel.
(A) Representative live/dead (live, calcein; and dead, ethidium homodimer) maximum projection fluorescence images of MDA-MB-231 cells encapsulated in dormancy-inducing 3D alginate stiff and proliferation-permissive 3D Matrigel vehicles for 5 days without drug exposure (n = 3 gels with 150 to 250 cells). Scale bars, 100 μm. (B) Representative live/dead (live, calcein; and dead, ethidium homodimer) maximum projection fluorescence images of MDA-MB-231 cells encapsulated in dormancy-inducing 3D alginate stiff and proliferation-permissive 3D Matrigel for 3 days and exposed to paclitaxel (0.001 to 0.5 mM) for 2 days (n = 3 gels with 150 to 250 cells). Scale bars, 100 μm. (C) Quantification of viability fold change within 3D alginate stiff and 3D Matrigel with respect to the vehicle (untreated groups) and between groups. (D) Quantification of metabolic activity fold change within 3D alginate stiff and 3D Matrigel with respect to the vehicle of each gel (untreated groups). * for statistical significance with respect to the vehicle of each gel (untreated groups) and # for statistics between groups. Student’s t test (n = 3 hydrogels), */#P ≤ 0.05, **/##P ≤ 0.01, and n.s., not significant.
Fig. 4.
Fig. 4.. Gene expression analysis of cells in 3D alginate stiff compared to that in 3D Matrigel.
(A) Principal components analysis (PCA) based on all expressed genes between 3D alginate stiff and 3D Matrigel groups acquired from RNA-seq (n = 3 for each condition). (B) Heatmap of selected differentially expressed genes (DEGs) involved in inflammatory response, regulation of cell cycle, and cellular response to DNA damage stimulus. (C) Network map of selected biological processes most enriched in 3D alginate compared to that in 3D Matrigel. Node size, node color, and edge width represent number of genes, P value from enrichment analysis, and overlap of the number of genes between two gene sets, respectively. (D) Selected top differentially regulated pathways from gene set enrichment analysis (GSEA) on DEGs between cells grown in 3D alginate stiff and 3D Matrigel according to Kyoto Encyclopedia of Genes and Genomes (KEGG) and WIKIPATHWAY databases. TNF, tumor necrosis factor; NF-κB, nuclear factor κB. (E) Volcano plot of DEGs between 3D Matrigel and 3D alginate stiff. Grey triangles mark genes of interest associated with inflammation and DNA-damage pathways [grey dots, not significant; green dots, significant absolute log(base2) fold change of >1; blue dots, significant P value of <0.05; and red, significant absolute log(base2) fold change of >1 and P value of <0.05 from a total of 9426 entries]. Relative mRNA levels of p53 and cdkn1a (p21) (n = 3 for each condition). Student’s t test, **P ≤ 0.01.
Fig. 5.
Fig. 5.. p21 and FHL2 localization in 3D matrices is stiffness dependent, and FHL2 mediates p21 localization and Ki67 expression.
(A) Selected top differentially regulated pathways from GSEA based on DEGs between cells grown in soft versus stiff alginate hydrogels. (B) Heatmap of DEGs (soft versus stiff) from DNA damage and repair pathways. (C) Representative confocal images of p21 localization and quantification of its nuc./cyto. ratio (n = 3 gels for 10 to 42 cells) for MDA-MB-231 cells within 3D stiff and soft alginate after 7 days of encapsulation (blue, DAPI; green, F-actin; and red, p21). Fraction of Ki67-positive cells (n = 3 gels for 28 to 628 cells). (D) Quantification of p21 localization in 3D alginate stiff after 7 days in the absence or presence of indicated inhibitors (n ≥ 19 cells). (E) Representative confocal images of FHL2 localization and quantification of its nuc./cyto. ratio (n = 3 gels for 36 to 46 cells) for MDA-MB-231 cells within same hydrogels and time point (blue, DAPI; green, F-Actin; and red, FHL2). FHL2 f.i. (a.u.) per cell (n = 3 gels for 59 to 151 cells). (F) Quantification of FHL2 localization in 3D alginate stiff after 7 days exposed to same inhibitors (n ≥ 18 cells). (G) Immunoblot showing FHL2 levels in MDA-MB-231 cells treated with two different anti-FHL2 small interfering RNA (siRNA) oligos compared to untreated (control 1) or scramble (control 2) groups. GAPDH, glyceraldehyde-3-phosphate dehydrogenase. (H) Representative confocal images of p21 localization and quantification of its nuc./cyto. ratio (n = 3 gels for 30 cells) for MDA-MB-231 and siRNA-FHL2–silenced cells within 3D stiff alginate (blue, DAPI; green, F-actin; and red, p21). Ki67 f.i. (a.u.) per cell (n = 74 to 260 cells). For statistical comparisons, two-tailed Student’s t test or Mann-Whitney U test for normally distributed or non-parametric groups, respectively (*P ≤ 0.05, ***P ≤ 0.001, and ****P ≤ 0.0001). Statistics with inhibitors compared with respect to control group (alginate stiff). Scale bars equal 10 μm.
Fig. 6.
Fig. 6.. FHL2 knockdown sensitizes cells to chemotherapy. FHL2 expression and localization in murine tissue of a breast cancer bone metastasis model, in human primary breast tumor, and in early DCCs.
(A) FHL2-silenced MDA-MB-231 cells were encapsulated within 3D alginate stiff for 3 days and exposed to 0.01 mM and higher doses of paclitaxel (0.01 to 0.5 mM) for 2 days. Percentage bars of viability (calcein+) for vehicles and fold changes in viability and metabolic activity (PrestoBlue) with respect to untreated groups. * for statistical analysis with respect to the vehicle and # between groups. Student’s t test (n = 3 hydrogels), */#P ≤ 0.05, **/##P ≤ 0.01, ***P ≤ 0.001, and ****P ≤ 0.0001. WT, wild type. (B) Intracardiac injection of GFP-tagged MDA-MB-231-1833 BoM cells in mice with Hematoxylin and Eosin (H&E) staining of the femur showing an osteolytic lesion (arrowhead). Confocal images of Ki67 and FHL2 localization of GFP-tagged MDA-MB-231-1833 BoM cells as clusters and single cells. Scale bars equal 1000 μm, 25 μm and 20 μm for H&E overview, cluster and single cell images, respectively. (C) Immunohistochemical image of FHL2 localization in a female patient (50 years old) with breast ductal carcinoma. Fraction of FHL2 localization in 34 patients with primary breast ductal carcinoma. Data obtained from The Human Protein Atlas (88). Scale bar equals 20 μm. (D) Confocal images of FHL2 localization in spheroids and single MDA-MB-231 cells, both kinds encapsulated within the same 3D Matrigel after 7 days of encapsulation and combined quantification of its nuc./cyto. ratio (n = 19 cells) (blue = DAPI, green = F-Actin, red = FHL2). Scale bar equals 20 μm for spheroids and 10 μm for single cells images. (E and F) Confocal images of cytokeratin (epithelial marker) and FHL2 (in single cells and within clusters) of human early DCCs disseminated in the sentinel lymph node of an M0 patient. Scale bars equal 50 μm and 5 μm for the wide and zoomed images, respectively.
Fig. 7.
Fig. 7.. Proposed stiffness-mediated FHL2 signaling mechanism in 3D bioengineered matrices inducing cancer cell dormancy and drug resistance.
In proliferation-permissive, ligand-rich microenvironments such as basement membranes, stronger adhesion sites maintain FHL2 in the membranous regions. In low or non-adherent microenvironments, the increase in mechanical confinement (stiffness) results in FHL2 translocation to the nucleus, leading to high p21 nuclear expression and cell cycle arrest (graphical illustration created with BioRender.com).

References

    1. Klein C. A., Cancer progression and the invisible phase of metastatic colonization. Nat. Rev. Cancer 20, 681–694 (2020). - PubMed
    1. Ghajar C. M., Metastasis prevention by targeting the dormant niche. Nat. Rev. Cancer 15, 238–247 (2015). - PMC - PubMed
    1. Aguirre-Ghiso J. A., Models, mechanisms and clinical evidence for cancer dormancy. Nat. Rev. Cancer 7, 834–846 (2007). - PMC - PubMed
    1. Montagner M., Sahai E., In vitro models of breast cancer metastatic dormancy. Front. Cell Dev. Biol. 8, 37 (2020). - PMC - PubMed
    1. Agudo J., Aguirre-Ghiso J. A., Bhatia M., Chodosh L. A., Correia A. L., Klein C. A., Targeting cancer cell dormancy. Nat. Rev. Cancer 24, 97–104 (2024). - PMC - PubMed

MeSH terms