. 2024 Nov 8;10(45):eadn1862.
doi: 10.1126/sciadv.adn1862. Epub 2024 Nov 6.

Generalizable and replicable brain-based predictions of cognitive functioning across common psychiatric illness

Affiliations

Generalizable and replicable brain-based predictions of cognitive functioning across common psychiatric illness

Sidhant Chopra et al. Sci Adv. .

Abstract

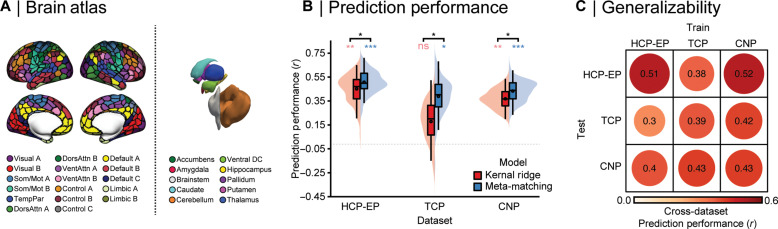
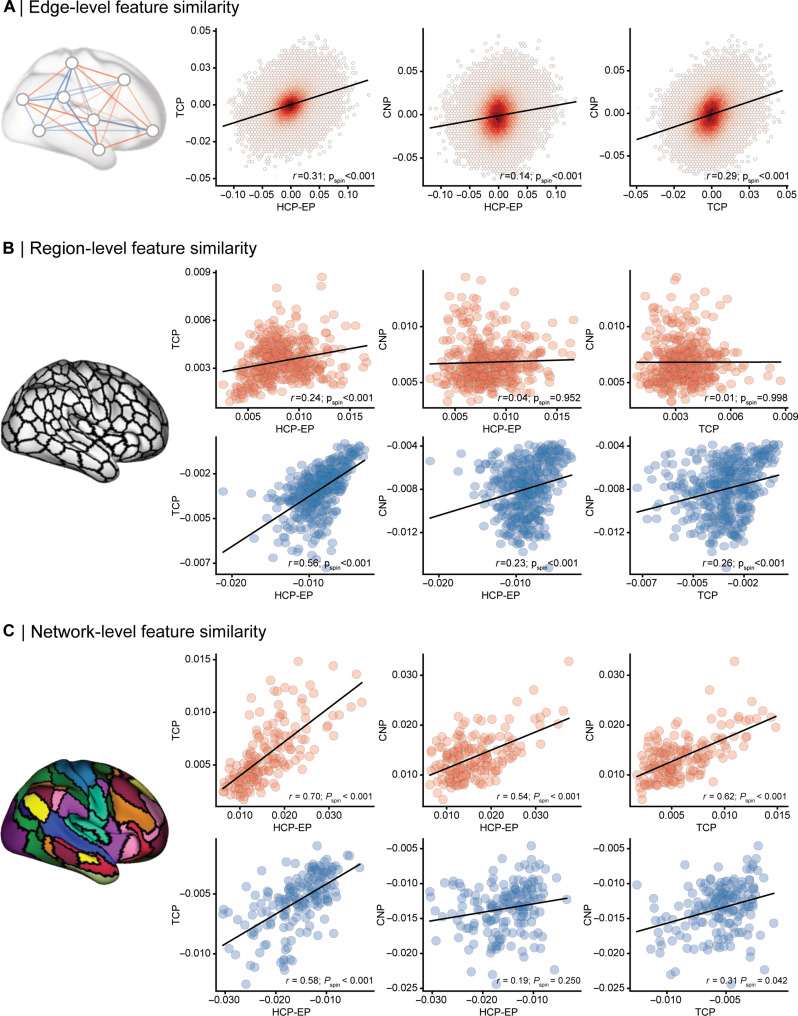
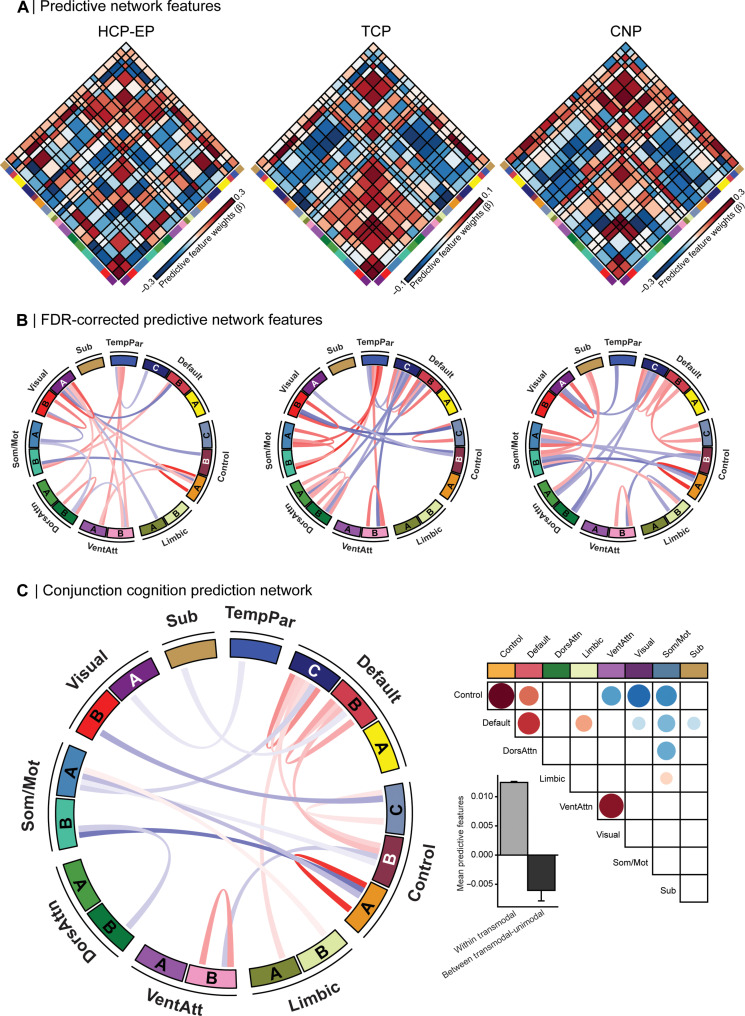
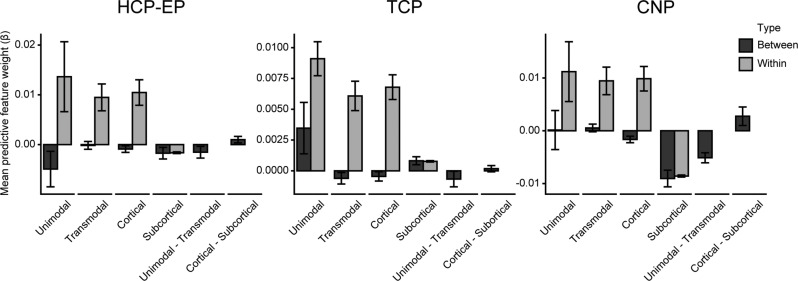
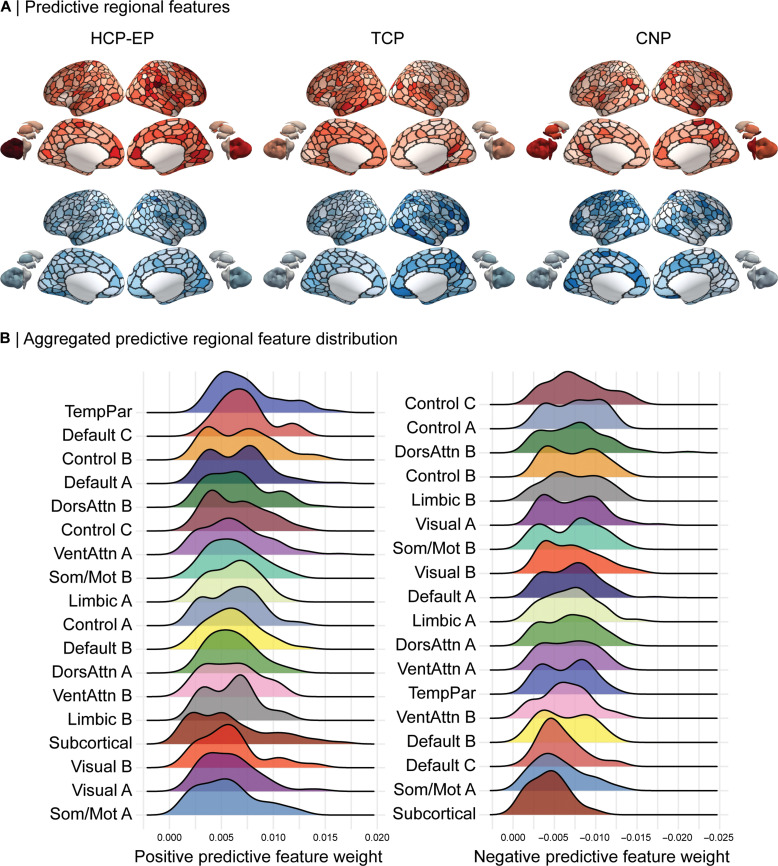
A primary aim of computational psychiatry is to establish predictive models linking individual differences in brain functioning with symptoms. In particular, cognitive impairments are transdiagnostic, treatment resistant, and associated with poor outcomes. Recent work suggests that thousands of participants may be necessary for the accurate and reliable prediction of cognition, questioning the utility of most patient collection efforts. Here, using a transfer learning framework, we train a model on functional neuroimaging data from the UK Biobank to predict cognitive functioning in three transdiagnostic samples (ns = 101 to 224). We demonstrate prediction performance in all three samples comparable to that reported in larger prediction studies and a boost of up to 116% relative to classical models trained directly in the smaller samples. Critically, the model generalizes across datasets, maintaining performance when trained and tested across independent samples. This work establishes that predictive models derived in large population-level datasets can boost the prediction of cognition across clinical studies.


Figures

Fig. 1.
Fig. 1.. Accurate and generalizable prediction of global cognitive functioning across patient samples.
(A) Network organization of the human cortex. Colors reflect regions estimated to be within the same functional network according to the 17-network solution from Yeo et al. (47) across the 400-parcel atlas from Schaefer et al. (39), along with 19 subcortical regions (40). Cortical parcels and subcortical regions are used to extract blood-oxygen-level dependent time series and compute pair-wise functional connectivity estimates used for prediction. (B) Prediction performance (Pearson’s correlation between observed and predicted values) using KRR (red) and meta-matching (blue) across three transdiagnostic datasets: HCP-EP, TCP, and UCLA CNP. Colored asterisks denote above-chance prediction ( *P < 0.05; **P < 0.001; ***P < 0.0001; ns = P > 0.05), and black asterisks denotes the statistically significant difference between models. (C) Generalizability matrix for the meta-matching models, showing the prediction performance between the independent samples, where the meta-matching model is trained in one dataset and then used to make predictions in an independent dataset. The diagonal represents the mean prediction performance within each dataset, which is also represented by the black dots in (B).
Fig. 2.
Fig. 2.. Predictive features are correlated between independent transdiagnostic datasets across scales.
(A) Association between HCP-EP, TCP, and UCLA CNP prediction model feature weights at the edge level, which consist of 87,571 features per model. (B) Association between feature weights of the three datasets at the region level, where feature weights were averaged for all edges corresponding to a region, resulting in 419 regional features. Positive (red) and negative (blue) feature weights were considered separately by zeroing negative or positive values before averaging, respectively. All P values displayed account for spatial autocorrelation between edges, regions, and networks. (C) Association between feature weights of the three datasets at the network level, where feature weights were averaged within and between each network, resulting in 171 network features per dataset. Positive and negative feature weights were considered separately by zeroing negative or positive values before averaging, respectively.
Fig. 3.
Fig. 3.. Increased within transmodal and reduced between network coupling is predictive of better cognitive functioning.
(A) Predictive feature matrices for each of the three datasets: HCP-EP, TCP, and UCLA CNP, averaged within and between network blocks. Non-averaged data are provided in the Supplementary Materials (fig. S5). Red, positive predictive feature weight (stronger coupling predicts better cognition); blue, negative predictive feature weight (weaker coupling predicts better cognition). (B) Top 10% of FDR-corrected predictive network connections for each dataset are displayed in Circos plots. See fig. S11 for all FDR-corrected predictive network connections for each dataset, displayed using Circos plots. (C) (Left) Circos plot showing the connections which survive multiple-comparison correction in a conjunction analysis across the three datasets. (Top right) Heat map of conjunction analysis results aggregated into a seven-network and subcortex atlas solution. (Bottom right) Mean feature weights from the conjunction analysis categorized into within and between transmodal and unimodal networks. Sub, subcortex; TempPar, temporoparietal; DorsAttn, dorsal attention; VentAttn, ventral attention; SomMot, somatomotor.
Fig. 4.
Fig. 4.. Increased within and decreased between system coupling predicts better cognition across datasets.
Average predictive feature weights within (gray) and between (black) unimodal and transmodal cortical and subcortical regions across the three datasets: HCP-EP, TCP, and UCLA CNP. Error bars represent the SEM. Unimodal networks include all visual and somatomotor networks, and transmodal networks include default, control, ventral attention, dorsal attention, limbic, and temporoparietal networks.
Fig. 5.
Fig. 5.. Predictive features at the regional level.
(A) Regional feature weights projected onto cortical and subcortical regions. Average positive (red) and negative (blue) feature weights are shown separately for each of the three datasets: HCP-EP, TCP, and UCLA CNP. (B) Positive (left) and negative (right) distributions of regional feature weights from all three datasets aggregated into 17 networks and subcortex and ordered by the strongest to weakest mean predictive feature weight.

References

    1. Poldrack R. A., Huckins G., Varoquaux G., Establishment of best practices for evidence for prediction: A review. JAMA Psychiatry 77, 534–540 (2020). - PMC - PubMed
    1. Varoquaux G., Cross-validation failure: Small sample sizes lead to large error bars. Neuroimage 180, 68–77 (2018). - PubMed
    1. Whelan R., Garavan H., When optimism hurts: Inflated predictions in psychiatric neuroimaging. Biol. Psychiatry 75, 746–748 (2014). - PubMed
    1. Abramovitch A., Short T., Schweiger A., The C Factor: Cognitive dysfunction as a transdiagnostic dimension in psychopathology. Clin. Psychol. Rev. 86, 102007 (2021). - PubMed
    1. East-Richard C., Mercier A. R., Nadeau D., Cellard C., Transdiagnostic neurocognitive deficits in psychiatry: A review of meta-analyses. Can. Psychol. 61, 190–214 (2020).

Publication types