. 2024 Dec 1;35(12):ar152.
doi: 10.1091/mbc.E24-05-0200. Epub 2024 Nov 6.

The transmembrane domain of the desmosomal cadherin desmoglein-1 governs lipid raft association to promote desmosome adhesive strength

Affiliations

The transmembrane domain of the desmosomal cadherin desmoglein-1 governs lipid raft association to promote desmosome adhesive strength

Stephanie E Zimmer et al. Mol Biol Cell. .

Abstract

Cholesterol- and sphingolipid-enriched domains called lipid rafts are hypothesized to selectively coordinate protein complex assembly within the plasma membrane to regulate cellular functions. Desmosomes are mechanically resilient adhesive junctions that associate with lipid raft membrane domains, yet the mechanisms directing raft association of the desmosomal proteins, particularly the transmembrane desmosomal cadherins, are poorly understood. We identified the desmoglein-1 (DSG1) transmembrane domain (TMD) as a key determinant of desmoglein lipid raft association and designed a panel of DSG1TMD variants to assess the contribution of TMD physicochemical properties (length, bulkiness, and palmitoylation) to DSG1 lipid raft association. Sucrose gradient fractionations revealed that TMD length and bulkiness, but not palmitoylation, govern DSG1 lipid raft association. Further, DSG1 raft association determines plakoglobin recruitment to raft domains. Super-resolution imaging and functional assays uncovered a strong relationship between the efficiency of DSG1TMD lipid raft association and the formation of morphologically and functionally robust desmosomes. Lipid raft association regulated both desmosome assembly dynamics and DSG1 cell surface stability, indicating that DSG1 lipid raft association is required for both desmosome formation and maintenance. These studies identify the biophysical properties of desmoglein transmembrane domains as key determinants of lipid raft association and desmosome adhesive function.


Conflict of interest statement

Conflicts of interests: The authors declare no financial conflict of interest.

Figures

FIGURE 1:
FIGURE 1:
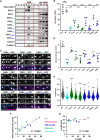
Palmitoylation-deficient DSG1 associates with rafts and assembles adhesive desmosomes. (A) Sucrose gradient fractionations from DSG-null cells expressing DSG1WT-GFP or DSG1PALM-GFP show distribution of DSG1-GFP between DRM and non-DRM fractions. (B) Quantification of westerns in A, n = 4. (C) Maximum intensity projections of SIM images from DSG-null cells expressing DSG1WT-GFP or DSG1PALM-GFP show desmosomes identified by desmoplakin railroad tracks. Bar, 1 µm. Quantification of desmosomes per border (D) and average desmosome length (µm) (E), n = 3. (F) Dispase cell dissociation assay of DSG-null monolayers or monolayers from DSG-null cells expressing DSG1WT-GFP or DSG1PALM-GFP. Fewer fragments indicate strong desmosomal adhesion. Fragments are shown within wells of a 24-well plate. (G) Quantification of F. Fragment counts normalized to monolayer fragmentation of DSG-null cells, n = 6 (four technical replicates per n). For B, D, E, and G, error bars represent SEM; p-values determined by one-way ANOVA followed by Dunnett's post-hoc.
FIGURE 2:
FIGURE 2:
DSG1 raft association is determined by TMD length and bulkiness and supports desmosome formation. (A) Sucrose gradient fractionations of DSG-null cells expressing DSG1WT-GFP or each of the DSG1TMD-GFP variants show distribution of DSG1-GFP between DRM and non-DRM fractions. (B) Quantification of westerns in A, n = 4. (C) Maximum intensity projections of SIM images from DSG-null cells expressing DSG1WT-GFP or each of the DSG1TMD-GFP variants show desmosomes identified by desmoplakin railroad tracks. (D) Quantification of desmosomes per border, n = 3. (E) Quantification of desmosome length (µm). Each point represents the average length of up to 1000 measured desmosomes per replicate, n = 3. (F–G) Scatter plot of correlation between degree of raft association (% DRM) and desmosome number (F) or desmosome length (G), color-coded by TMD property. Point shape and color match those used in B, D, and E for identification. For B, D, and E, error bars represent SEM; p-values determined by one-way ANOVA followed by Dunnett's post-hoc.
FIGURE 3:
FIGURE 3:
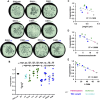
DSG1 raft association correlates with desmosome adhesive function. (A) Dispase monolayer fragmentation assay of DSG-null monolayers or monolayers from DSG-null cells expressing DSG1WT-GFP or other DSG1TMD-GFP variants. Fewer fragments indicate strong desmosomal adhesion. Images were captured without magnification. (B) Quantification of A. Fragment counts normalized to monolayer fragmentation of DSG-null cells, n = 6. Error bars represent SEM; p-values determined by one-way ANOVA followed by Dunnett's post-hoc. All DSG1TMD variants were compared with DSG-null monolayer fragmentation (top asterisks) to assess general ability to functionally rescue or to DSG1WT-GFP monolayer fragmentation (bottom asterisks) to assess function relative to WT conditions. (C–E) Scatter plot of correlation between mean desmosome length (µm) in Figure 2E and fragmentation values from B and C, mean desmosome count in Figure 2D and fragmentation values from B and D, and % DRM in Figure 2B and fragmentation values from B and E.
FIGURE 4:
FIGURE 4:
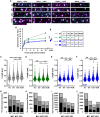
DSG1 raft association regulates desmosome dynamics. (A) Maximum intensity projections of spinning disk confocal images of DSG-null cells expressing DSG1WT-GFP, DSG1Leu-GFP, DSG1SAM-GFP, or DSG1Δ7C-GFP stained for GFP and DP at steady state or 1, 3, or 12 h after a calcium switch. Bar, 1 µm. These variants are representative of three mechanistic categories into which the DSG1TMD variants can be grouped. (B) Graph showing desmosome assembly progression following a calcium switch and compared with desmosome quantities at steady state. Error bars represent mean ± SEM, n = 3, p-values determined by one-way ANOVA followed by Dunnett's post-hoc. (C–F) Violin plots show distribution of measured desmosome lengths 1, 3, or 12 h after calcium switch or during steady state (HCM, high calcium medium) for DSG-null cells expressing DSG1WT-GFP (C), DSG1Leu-GFP (D), DSG1SAM-GFP (D), or DSG1Δ7C-GFP (F). Y-axis was limited to 1 µm to better visualize spreads. DSG1WT-GFP at 3 h, 12 h, and HCM and DSG1SAM-GFP at 12 h and HCM had limited measurements above 1 µm. p-values determined by two-way ANOVA followed by Šidák's multiple comparisons test to compare 1-h versus 3-h, 3-h versus 12-h, 12-h versus HCM, 1-h versus 12-h, and 1-h versus HCM. (G–J) Graphs show total number of measured desmosomes for each DSG1TMD variant per timepoint per replicate, R1-R3: 1 h (G), 3 h (H), 12 h (I), HCM (J).
FIGURE 5:
FIGURE 5:
Most DSG1TMD variants traffic normally through the Golgi body to the plasma membrane. (A) Spinning disk confocal images show DSG-null cells expressing DSG1WT-GFP, DSG1Leu-GFP, DSG1SAM-GFP, or DSG1Δ7C-GFP and stained for GM130 and WGA to mark Golgi and plasma membranes, respectively. Bar, 5 µm. (B–C) Quantification of overlap between DSG1TMD-GFP and GM130 or DSG1TMD-GFP and WGA. Error bars represent mean ± SEM, n = 3, p-values determined by one-way ANOVA followed by Dunnett's post-hoc.
FIGURE 6:
FIGURE 6:
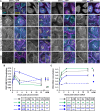
Many DSG1TMD-GFP variants exhibit increased surface turnover and increased desmocollin-2 surface turnover. (A) Maximum intensity projections of images show surface level DSG1 in DSG-null cells expressing DSG1WT-GFP, DSG1Leu-GFP, DSG1SAM-GFP, or DSG1Δ7C-GFP after 0, 1, 3, or 6 h of turnover. Bar, 5 µm. (B) Quantification of images in A. Error bars represent mean ± SEM, n = 3, p-values determined by one-way ANOVA followed by Dunnett's post-hoc. (C–E) Scatterplot showing correlation between surface levels of DSG1 or desmocollin-2 after 1-h (C), 3-h (D), or 6-h (E) pulse-chase normalized to 0 h. Desmocollin-2 surface turnover results are in Supplemental Figure S8.
FIGURE 7:
FIGURE 7:
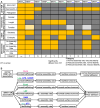
DSG1TMD variant results summary. (A) Color-coded tabular results summary illustrates how DSG1TMD variants behave relative to DSG1WT throughout the experiments performed in this work. (B) The nonraft Dsg1TMD variants consistently form fewer, poorly adhesive desmosomes through inconsistent pathways involving differing combinations of reduced trafficking rate, reduced desmosome assembly rate, and/or increased surface turnover.
FIGURE 8:
FIGURE 8:
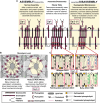
Schematic representation of desmosome maintenance dynamics. (A) Addition of calcium to nonadhesive cells drives desmosome assembly by clustering desmosomal proteins via protein–protein interactions and raft association. This assembly-driven environment persists until cells have a pool of ordered, adhesive desmosomes at which point assembly and disassembly equilibrate to maintain a stable and adhesive population at steady state. Reduced DSG raft association alters this dynamic such that protein–protein interactions force the assembly of nonstable desmosomes. Cells attain desmosomal steady state faster due to increased DSG and DSC turnover that favors disassembly. (B) Monolayer adhesion in the presence of raft-associated DSG1 versus nonraft associated DSG1: fewer, poorly adhesive desmosomes are insufficient for robust mechanical strength. (C) Zoomed-in representation of the arrangement of palmitoylated desmosomal proteins, cholesterol, sphingolipid, and saturated phospholipids in the presence of wildtype DSG1 versus palmitoylation-deficient, short, or bulky DSG1. Shortened or bulked DSG1 TMDs disrupt lipid order. Boxes indicate the figure containing supporting relevant data.

Update of

References

    1. Al-Amoudi A, Castaño-Diez D, Devos DP, Russel RB, Johnson GT, Frangakis AS (2011). The three-dimensional molecular structure of the desmosomal plaque. Proc Natl Acad Sci U S A 108(16), 6480–6485. - PMC - PubMed
    1. Baddam SR, Arsenovic PT, Narayanan V, Duggan NR, Mayer CR, Newman ST, Abutaleb DA, Mohan A, Kowalczyk AP, Conway DE (2018). The desmosomal cadherin desmoglein-2 experiences mechanical tension as demonstrated by a FRET-based tension biosensor expressed in living cells. Cells 7(7), 66. - PMC - PubMed
    1. Bartle EI, Urner TM, Raju SS, Mattheyses AL (2017). Desmoglein 3 order and dynamics in desmosomes determined by fluorescence polarization microscopy. Biophys J 113(11), 2519–2529. - PMC - PubMed
    1. Beggs RR, Rao TC, Dean WF, Kowalczyk AP, Mattheyses AL (2022). Desmosomes undergo dynamic architectural changes during assembly and maturation. Tissue Barriers 10(4), e2017225. - PMC - PubMed
    1. Bharathan NK, Giang W, Hoffman CL, Aaron JS, Khuon S, Chew T, Preibisch S, Trautman ET, Heinrich L, Bogovic J, et al. (2023). Architecture and dynamics of a desmosome-endoplasmic reticulum complex. Nat Cell Biol 25(6), 823–835. - PMC - PubMed

LinkOut - more resources