. 2024 Dec:90:102052.
doi: 10.1016/j.molmet.2024.102052. Epub 2024 Nov 5.

GLIS3: A novel transcriptional regulator of mitochondrial functions and metabolic reprogramming in postnatal kidney and polycystic kidney disease

Affiliations

GLIS3: A novel transcriptional regulator of mitochondrial functions and metabolic reprogramming in postnatal kidney and polycystic kidney disease

Justin B Collier et al. Mol Metab. 2024 Dec.

Abstract

Objectives: Deficiency in the transcription factor (TF) GLI-Similar 3 (GLIS3) in humans and mice leads to the development of polycystic kidney disease (PKD). In this study, we investigate the role of GLIS3 in the regulation of energy metabolism and mitochondrial functions in relation to its role in normal kidney and metabolic reprogramming in PKD pathogenesis.

Methods: Transcriptomics, cistromics, and metabolomics were used to obtain insights into the role of GLIS3 in the regulation of energy homeostasis and mitochondrial metabolism in normal kidney and PKD pathogenesis using GLIS3-deficient mice.

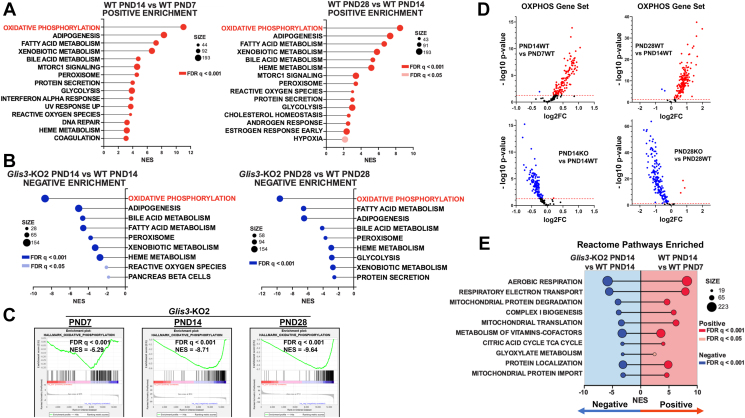
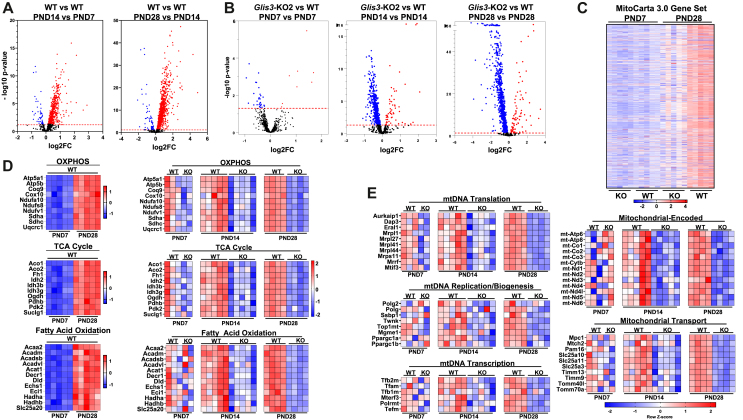
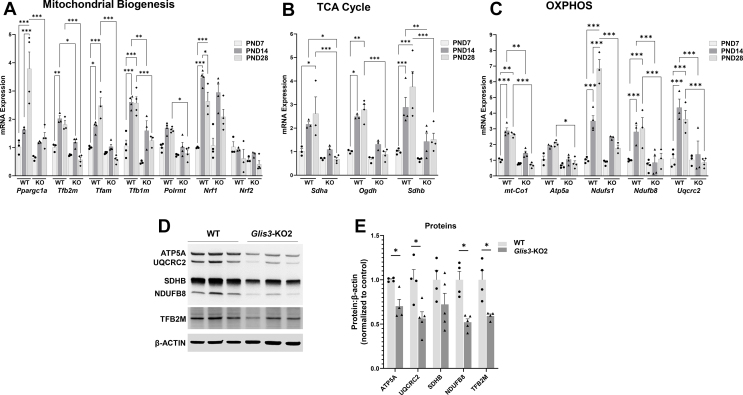
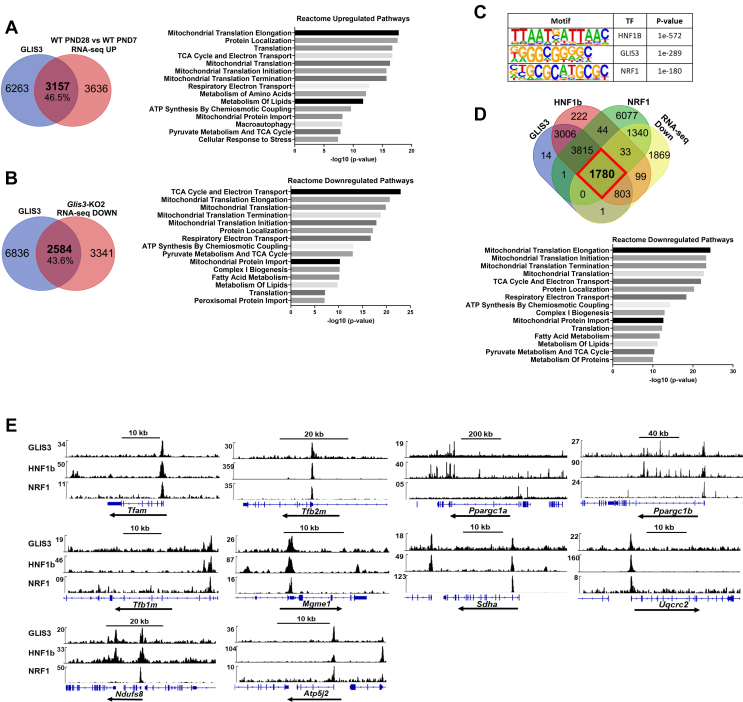
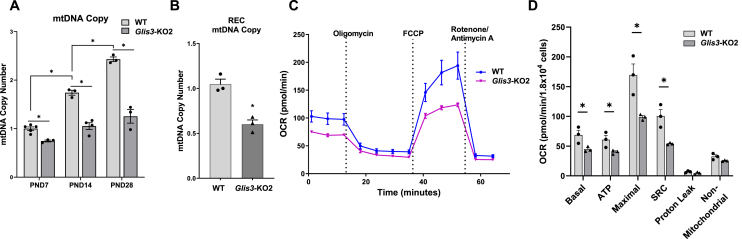
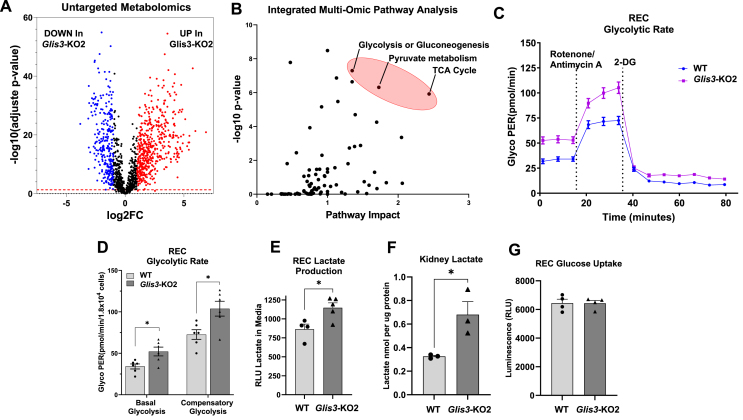
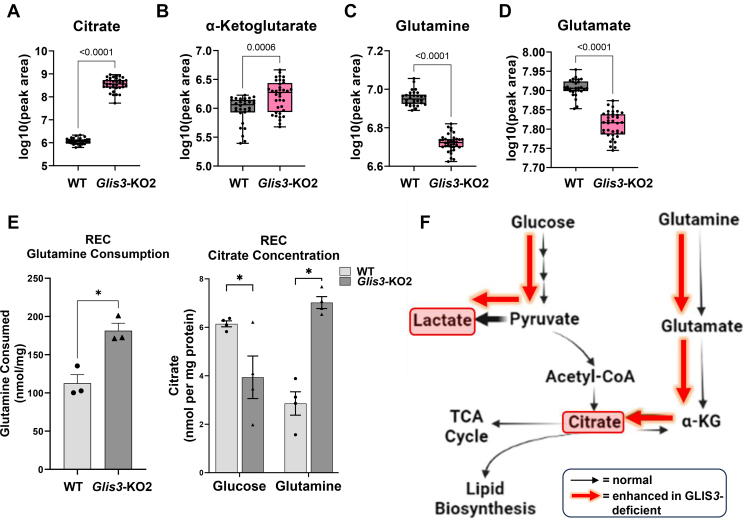
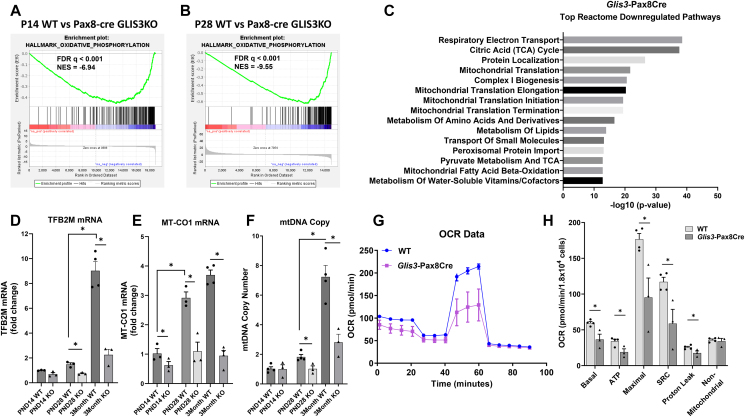
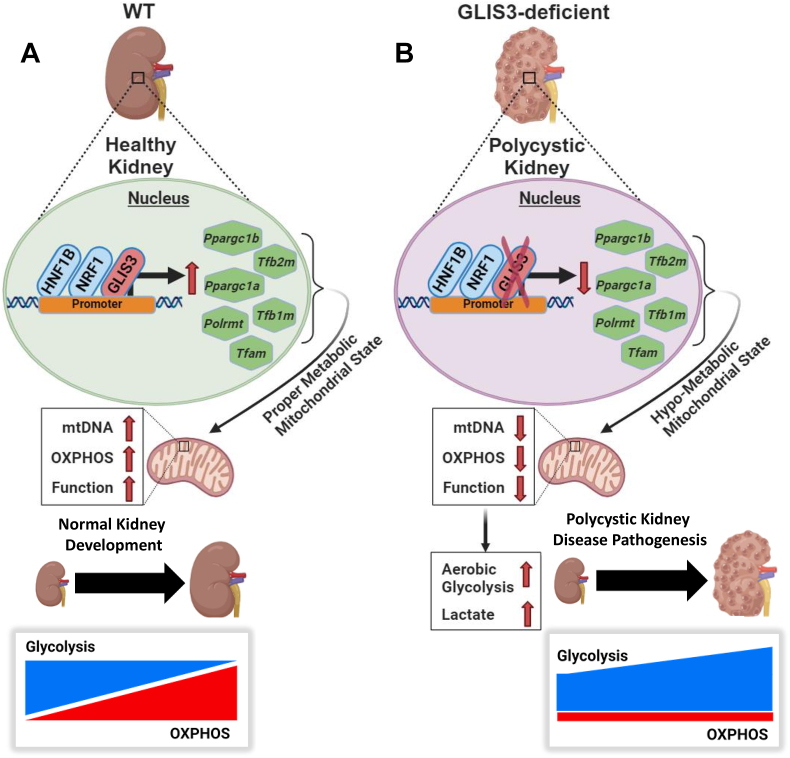
Results: Transcriptome analysis showed that many genes critical for mitochondrial biogenesis, oxidative phosphorylation (OXPHOS), fatty acid oxidation (FAO), and the tricarboxylic acid (TCA) cycle, including Tfam, Tfb1m, Tfb2m, Ppargc1a, Ppargc1b, Atp5j2, Hadha, and Sdha, are significantly suppressed in kidneys from both ubiquitous and tissue-specific Glis3-deficient mice. ChIP-Seq analysis demonstrated that GLIS3 is associated with the regulatory region of many of these genes, indicating that their transcription is directly regulated by GLIS3. Cistrome analyses revealed that GLIS3 binding loci frequently located near those of hepatocyte nuclear factor 1-Beta (HNF1B) and nuclear respiratory factor 1 (NRF1) suggesting GLIS3 regulates transcription of many metabolic and mitochondrial function-related genes in coordination with these TFs. Seahorse analysis and untargeted metabolomics corroborated that mitochondrial OXPHOS utilization is suppressed in GLIS3-deficient kidneys and showed that key metabolites in glycolysis, TCA cycle, and glutamine pathways were altered indicating increased reliance on aerobic glycolysis and glutamine anaplerosis. These features of metabolic reprogramming may contribute to a bioenergetic environment that supports renal cyst formation and progression in Glis3-deficient mice kidneys.

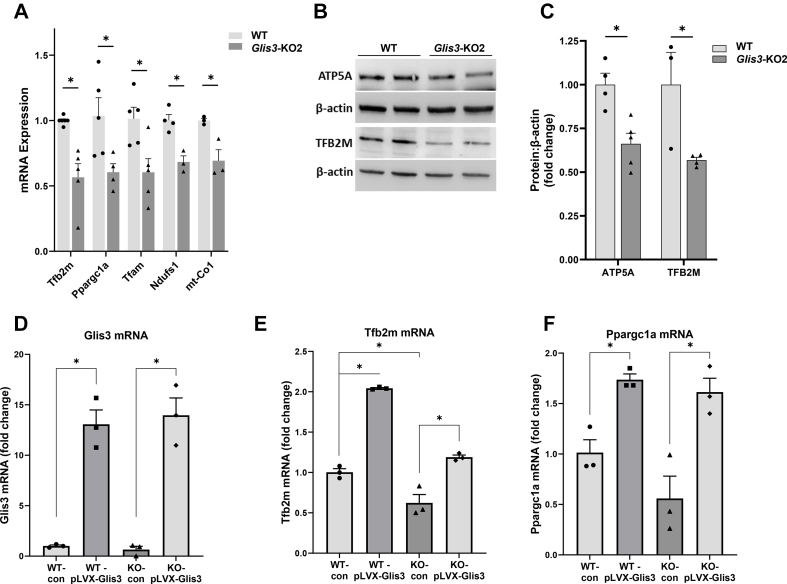
Conclusions: We identify GLIS3 as a novel positive regulator of the transition from aerobic glycolysis to OXPHOS in normal early postnatal kidney development by directly regulating the transcription of mitochondrial metabolic genes. Loss of GLIS3 induces several features of renal cell metabolic reprogramming. Our study identifies GLIS3 as a new participant in an interconnected transcription regulatory network, that includes HNF1B and NRF1, critical in the regulation of mitochondrial-related gene expression and energy metabolism in normal postnatal kidneys and PKD pathogenesis in Glis3-deficient mice.

Keywords: Aerobic glycolysis; GLIS3; Metabolic reprogramming; Oxidative phosphorylation; Polycystic kidney disease; Transcription.


Conflict of interest statement

Declaration of competing interest All the authors declared no competing interests.

Figures

Figure 1
Figure 1
Mitochondrial-related pathways are suppressed in Glis3-KO2 kidneys. (A) GSEA Hallmark pathway showing the top positively enriched age-associated pathways for WT kidneys ranked by the normalized enrichment score (NES) and showing FDR and gene set size. The topmost enriched pathways are in red. (B) GSEA Hallmark pathway showing the top negatively enriched age-associated pathways for Glis3-KO2 kidneys ranked by NES and showing FDR and gene set size. The topmost enriched pathways are in blue. (C) GSEA OXPHOS enrichment plots showing negative enrichment in the Glis3-KO2 kidneys at PND7, 14, and 28. (D) Volcano plots of all Hallmark OXPHOS genes showing upregulation with age (red) in the WT PND14 vs WT PND7 and WT PND28 vs WT PND14 and downregulation of the OXPHOS gene set (blue) in Glis3-KO2 PND14 vs WT PND14 and Glis3-KO2 vs WT PND28 kidneys. (E) GSEA pathway analysis depicting the top enriched Reactome pathways in the WT PND14 vs WT PND7 compared to the Glis3-KO2 PND14 vs WT PND14 showing opposite enrichment. For WT the pathways show positive enrichment, and for the Glis3-KO2 showing negative enrichment. Reactome pathways ranked by NES in the Glis3-KO2 PND14, and showing FDR and gene set size. (For interpretation of the references to color in this figure legend, the reader is referred to the Web version of this article.)
Figure 2
Figure 2
The expression of mitochondria-related genes is decreased in Glis3-KO2 kidneys. (A) Visualization of differential gene expression in WT kidneys. Volcano plots of DEGS of WT PND14 vs WT PND7 and WT PND28 vs WT PND14 kidney RNA-seq data against the MitoCarta 3.0 gene dataset. (B) Visualization of differential gene expression in Glis3-KO2 kidneys. Volcano plots of DEGS of PND7, 14, and 28 Glis3-KO2 and WT kidney RNA-seq data against the MitoCarta 3.0 gene dataset. (C) Heatmap of the MitoCarta 3.0 gene set in alphabetical order. Gene expression is compared between PND7 and PND28 WT and Glis3-KO2. Upregulated genes are represented in red and downregulated genes in blue. Expression values are shown as z-scores of the rlog-transformed values for each gene. (D, E) Heatmaps of DEGs in Glis3-KO2 versus WT kidneys at PND7, 14, and 28 labeled with mitochondria-associated pathways. For OXPHOS, TCA Cycle, and FAO a heat map of WT PND28 vs WT PND7 is included showing the increase in expression with age. Upregulated genes are represented in red and downregulated genes in blue. Expression values are shown as z-scores of the rlog-transformed values for each gene. (For interpretation of the references to color in this figure legend, the reader is referred to the Web version of this article.)
Figure 3
Figure 3
GLIS3 is required for the upregulation of mitochondria-related gene expression during early postnatal kidney development. (A–C) RT-qPCR analysis of the expression of several genes related to mitochondrial biogenesis, TCA cycle, and OXPHOS in PND7, 14, and 28 WT and Glis3-KO2 kidneys. Data are represented as mean ± SEM, n ≥ 3. ∗∗∗ represents p < 0.001; ∗∗ represents p < 0.01; ∗ represents p < 0.05. (D–E) Representative immunoblot of ATP5A, UQCRC2, SDHB, NDUFB8, and TFB2M protein expression in WT and Glis3-KO2 kidneys. Protein expression was quantified by densitometric analysis. Data are represented as mean ± SEM, n ≥ 4. ∗ Represents p < 0.05.
Figure 4
Figure 4
Suppression of mitochondria-related gene expression in primary Glis3-KO2 RECs and increased expression by exogenous GLIS3. (A) RT-qPCR analysis of the expression of mitochondria-related genes in WT and Glis3-KO2 RECs. Data are represented as mean ± SEM, n ≥ 3. (B) Immunoblot analysis of ATP5A and TFB2M expression in WT and KO primary RECs. (C) Densitometric analysis of ATP5A and TFB2M proteins in WT and KO primary RECs. Data are represented as mean ± SEM, n ≥ 4. (D) Overexpression of GLIS3 in WT and Glis3-KO2 RECs increased Tfb2m and Ppargc1a mRNA expression. RECs were infected with Glis3 lentivirus for 36 h and gene expression analyzed by RT-qPCR. Data are represented as mean ± SEM, n = 3. ∗ Represents p < 0.05.
Figure 5
Figure 5
GLIS3 regulates several metabolic and mitochondria-related genes in mouse kidneys in coordination with HNF1B and NRF1. (A) Venn diagram showing that GLIS3 was bound to 46.5% of the genes upregulated between PND7-28 in WT kidneys. Reactome pathway analysis of this gene set identified mitochondrial/biogenesis-related genes as the topmost significantly up-regulated pathways. Venn diagram was generated with PND7 GLIS3 ChIP-seq and WT PND28 vs WT PND7 RNA-seq datasets. GLIS3 binding peaks within 5 kb from TSS. (B) Venn diagram showing that GLIS3 was bound to 43.6% of the genes suppressed in PND28 Glis3-KO2 kidneys compared to WT kidneys. Reactome pathway analysis of this gene set identified mitochondrial/biogenesis-related genes as the topmost significantly down-regulated pathways. Venn diagram was generated with GLIS3 ChIP-seq and PND28 Glis3-KO2 vs WT RNA-seq datasets. (C) HOMER de novo motif analysis of GLIS3 ChIP-Seq data identified the GLIS3 binding site (GLISBS) as a top binding site among consensus binding sequences. HNF1B and NRF1 binding sequences are frequently localized near GLISBS. (D) Venn diagram showing overlaps between genes downregulated in Glis3-KO2 kidneys and genes with GLIS3, HNF1B, and NRF1 peaks (at 5 kb from TSS) (outlined in red in diagram). Reactome pathway analysis of the 1780 overlapping genes showing mitochondrial-related pathways among the top pathways potentially regulated by all three TFs. (E) Genome browser tracks of several mitochondrial-related genes showing localization of GLIS3, HNF1B, and NRF1 binding peaks within the same regulatory regions supporting the hypothesis that GLIS3 regulates these genes in coordination with HNF1B and NRF1. (For interpretation of the references to color in this figure legend, the reader is referred to the Web version of this article.)
Figure 6
Figure 6
Mitochondrial DNA and mitochondrial respiration are decreased in Glis3-KO2 kidneys. (A) Analysis of mtDNA copy number in PND7, 14, and 28 WT and Glis3-KO2 kidneys. Data are represented as mean ± SEM, n ≥ 3. (B) mtDNA copy number in primary WT and Glis3-KO2 RECs. Data are represented as mean ± SEM, n = 3. (C) Oxygen consumption rate (OCR) was measured in primary RECs isolated from WT and Glis3-KO2 kidneys with a Seahorse analyzer. OCR was analyzed at the basal rate and after sequential injections of oligomycin (ATP synthase inhibitor), FCCP (proton uncoupler), and rotenone/antimycin A (Complex I and III inhibitor). Basal, ATP-linked (ATP), and maximal OCR, spare respiratory capacity (SCR), proton leak, and nonmitochondrial related OCR were then calculated and plotted. n ≥ 3. Primary RECS were isolated and cultured from individual mice and analyzed separately.
Figure 7
Figure 7
Glis3-KO2 kidneys have altered metabolites and an increase in aerobic glycolysis. (A) Changes in metabolites identified by untargeted metabolomics. Volcano plot showing metabolites that are decreased (blue) or increased (red) in PND28 Glis3-KO2 kidneys. (B) Integrated multi-omic pathway analysis of RNA-seq DEGs and significantly changed metabolites identifying TCA cycle and glycolysis among the top altered pathways. (C) Glycolytic rate was measured in primary RECs isolated from WT and Glis3-KO2 kidneys with Seahorse analyzer after sequential injections of rotenone/antimycin A and 2-DG. (D) Basal and compensatory glycolysis were calculated and plotted. Primary RECS were isolated and cultured from three individual mice and analyzed separately. n = 3. (E) Analysis of lactate production in media from primary WT and Glis3-KO2 RECs. (F) Analysis of the lactate concentration in PND28 WT and Glis3-KO2 whole kidneys. (G) Analysis of the glucose uptake between primary WT and Glis3-KO2 RECs. Data are represented as mean ± SEM, n ≥ 3. (For interpretation of the references to color in this figure legend, the reader is referred to the Web version of this article.)
Figure 8
Figure 8
Loss of GLIS3 function causes rewiring of glutamine and citrate metabolism in Glis3-KO2 kidneys. (A–D) Untargeted metabolomic analysis of WT and Glis3-KO2 kidneys showed that citrate and α-ketoglutarate levels are increased, and glutamine and glutamate levels decreased (as log10, peak area). 5 biological replicates each with technical replicates. (E) Glutamine consumption is increased in the Glis3-KO2 RECs and citrate metabolism is altered in the primary Glis3-KO2 RECs. Glutamine consumption and citrate concentration measurements were analyzed as described in Methods. Data are represented as mean ± SEM, n ≥ 3. (F) Enhanced effect of GLIS3 deficiency in kidneys shown in red arrows on glucose and glutamine metabolic pathways. Loss of GLIS3 function in renal cells alters the utilization of glutamine and citrate levels consistent with enhanced glutamine anaplerosis. (For interpretation of the references to color in this figure legend, the reader is referred to the Web version of this article.)
Figure 9
Figure 9
Kidney-selective knockout Glis3-Pax8Cre mice mimic the ubiquitous Glis3-KO2 renal metabolic reprogramming features. (A–B) Enrichment plots of the Hallmark OXPHOS gene set showing negative enrichment in Glis3-Pax8Cre kidneys at PND14 and PND28. (C) Reactome pathway analysis of downregulated genes in Glis3-Pax8Cre kidneys showed that mitochondrial-related pathways are among the top downregulated pathways. (D–E) RT-qPCR analysis of the expression of Tfb2m and mt–CO1 genes in WT and Glis3-Pax8Cre kidneys at the ages indicated. Data are represented as mean ± SEM, n ≥ 4. (F) Comparison of mtDNA copy number between kidneys from PND14, 28, and 3-month WT and Glis3-Pax8Cre mice. Data are represented as mean ± SEM, n ≥ 3. (G–H) Profile of mitochondria stress test of primary RECs isolated from WT and Glis3-Pax8Cre kidneys. OCR was analyzed with a Seahorse analyzer. Basal, ATP-linked, and maximal OCR, SCR, proton leak, and nonmitochondrial related OCR were calculated and plotted. n ≥ 3. Primary RECS were isolated and cultured from individual mice and analyzed separately.
Figure 10
Figure 10
Schematic of the transcriptional regulation of mitochondrial and metabolic genes by GLIS3 likely in coordination with HNF1B and NRF1. (A) GLIS3 activates the transcription of several mitochondrial and metabolic genes during postnatal kidney development in coordination with HNF1B and NRF1. However, some genes are likely regulated indirectly via the increased expression of other key regulators of transcription (e.g., Tfam, Tfb1/2m, Ppargc1a/b, Polrmt) that themselves are GLIS3 transcriptional targets. Together this enhances mitochondrial-related gene expression and OXPHOS. (B) Loss of GLIS3 function suppresses the normal induction of these mitochondrial-related genes leading to a decrease in mtDNA and OXPHOS compared to WT, and an increase in aerobic glycolysis and lactate production.

References

    1. Kim Y.S., Nakanishi G., Lewandoski M., Jetten A.M. GLIS3, a novel member of the GLIS subfamily of Kruppel-like zinc finger proteins with repressor and activation functions. Nucleic Acids Res. 2003;31:5513–5525. doi: 10.1093/nar/gkg776. - DOI - PMC - PubMed
    1. Scoville D.W., Kang H.S., Jetten A.M. Transcription factor GLIS3: critical roles in thyroid hormone biosynthesis, hypothyroidism, pancreatic beta cells and diabetes. Pharmacol Ther. 2020 doi: 10.1016/j.pharmthera.2020.107632. - DOI - PMC - PubMed
    1. Kang H.S., Kumar D., Liao G., Lichti-Kaiser K., Gerrish K., Liao X.H., et al. GLIS3 is indispensable for TSH/TSHR-dependent thyroid hormone biosynthesis and follicular cell proliferation. J Clin Invest. 2017;127:4326–4337. doi: 10.1172/JCI94417. - DOI - PMC - PubMed
    1. Senee V., Chelala C., Duchatelet S., Feng D., Blanc H., Cossec J.C., et al. Mutations in GLIS3 are responsible for a rare syndrome with neonatal diabetes mellitus and congenital hypothyroidism. Nat Genet. 2006;38:682–687. doi: 10.1038/ng1802. - DOI - PubMed
    1. Kang H.S., Beak J.Y., Kim Y.S., Herbert R., Jetten A.M. Glis3 is associated with primary cilia and Wwtr1/TAZ and implicated in polycystic kidney disease. Mol Cell Biol. 2009;29:2556–2569. doi: 10.1128/MCB.01620-08. - DOI - PMC - PubMed