. 2024 Nov 6;15(1):9600.
doi: 10.1038/s41467-024-53430-y.

Enhancing glymphatic fluid transport by pan-adrenergic inhibition suppresses epileptogenesis in male mice

Affiliations

Enhancing glymphatic fluid transport by pan-adrenergic inhibition suppresses epileptogenesis in male mice

Qian Sun et al. Nat Commun. .

Abstract

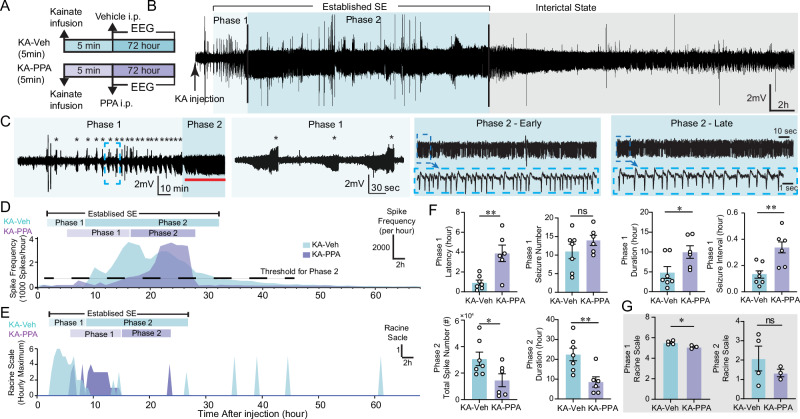
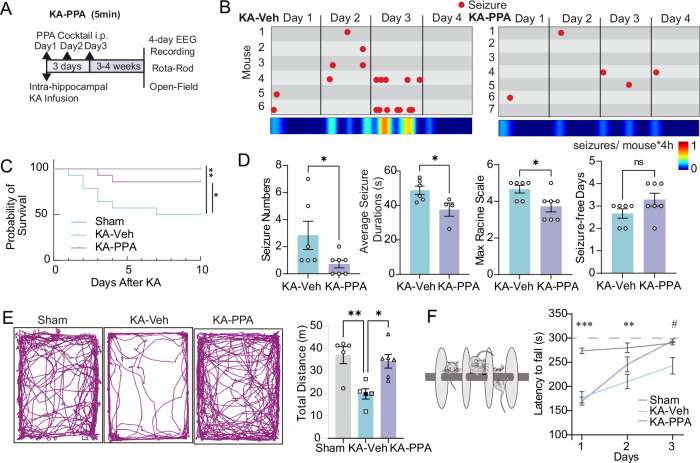
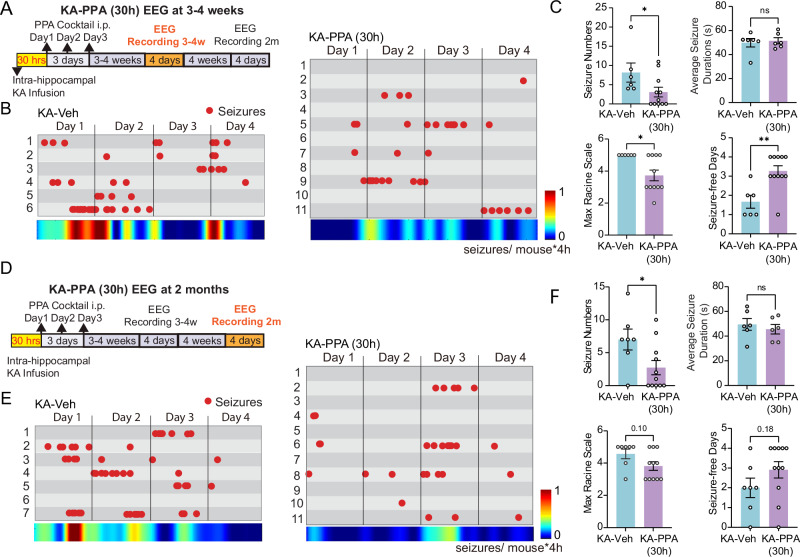
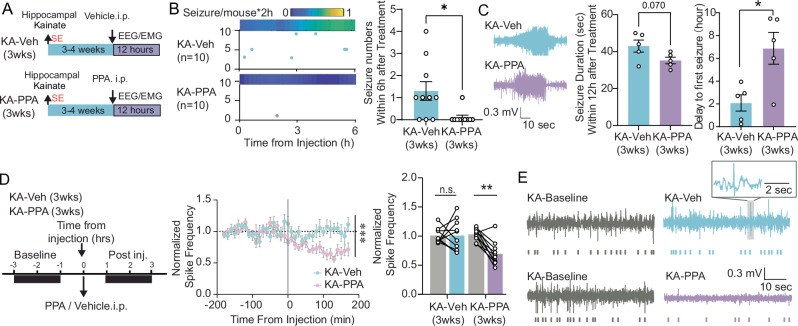
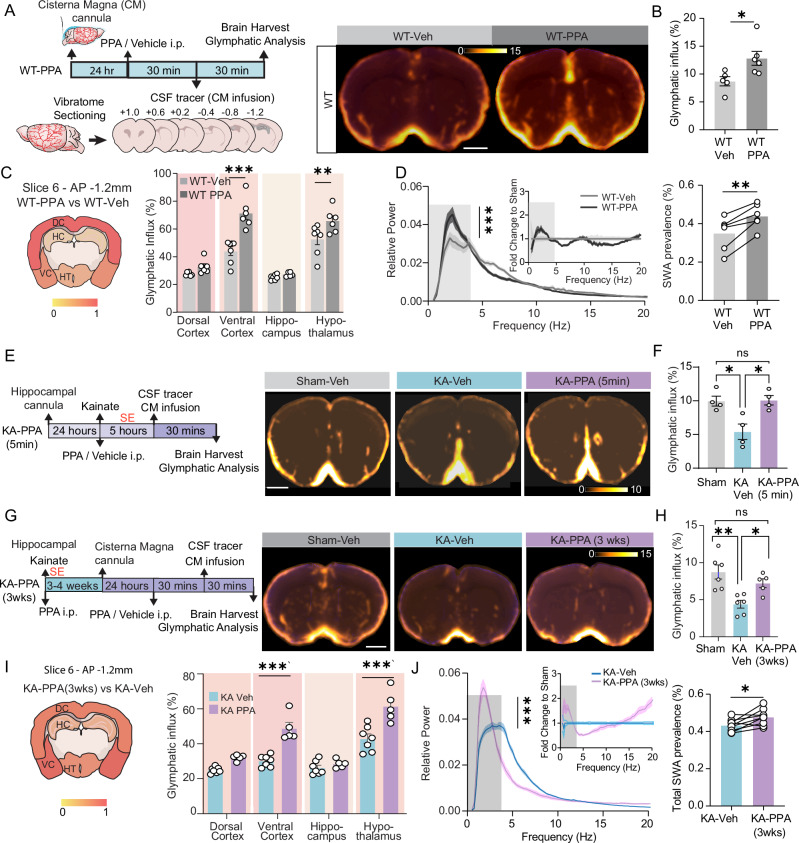
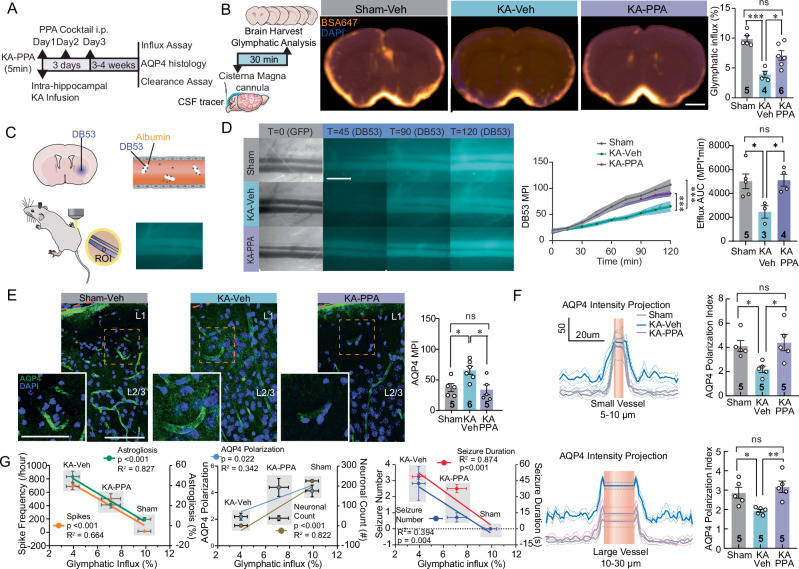
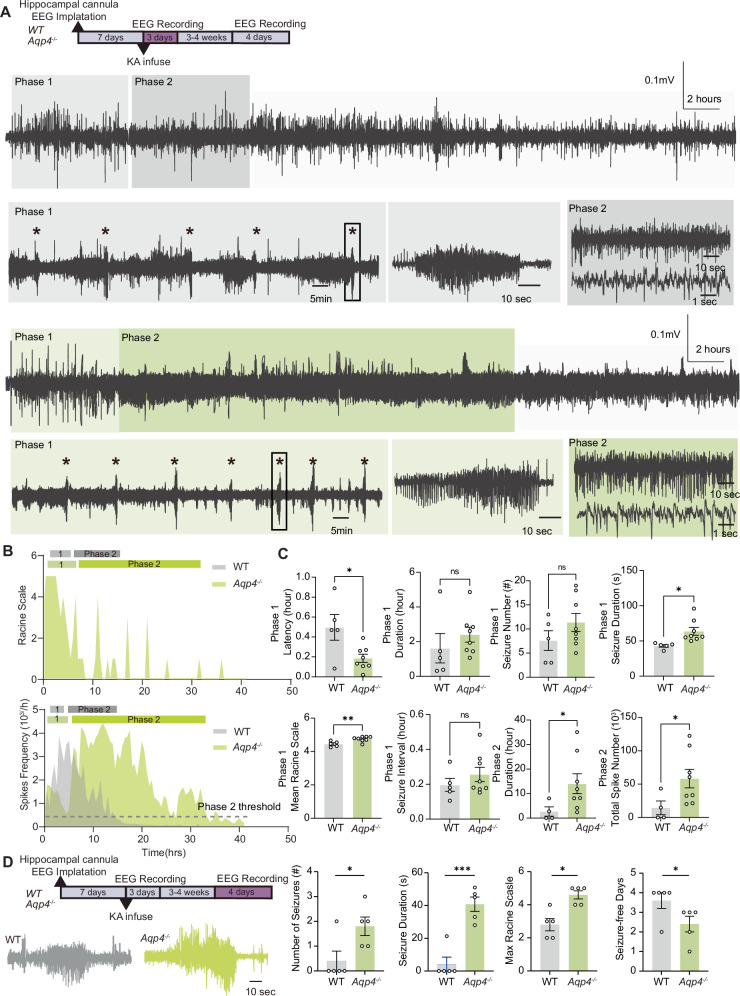
Epileptogenesis is the process whereby the previously normally functioning brain begins to generate spontaneous, unprovoked seizures. Status epilepticus (SE), which entails a massive release of neuronal glutamate and other neuroactive substances, is one of the best-known triggers of epileptogenesis. We here asked whether pharmacologically promoting glymphatic clearance during or after SE is beneficial and able to attenuate the subsequent epileptogenesis. We induced SE in adult male mice by intrahippocampal kainic acid (KA) infusion. Acute administration of a cocktail of adrenergic receptor antagonists (propranolol, prazosin, and atipamezole: PPA), enhanced glymphatic flow and effectively reduced the severity of spontaneous seizures in the chronic phase. The PPA treatment also reduced reactive gliosis and inhibited the loss of polarized expression of AQP4 water channels in the vascular endfeet of astrocytes. Administration of PPA after cessation of SE (30 hours post KA) also effectively suppressed epileptogenesis and improved outcome. Conversely, mice with constitutively low glymphatic transport due to genetic deletion of the aquaporin 4 (AQP4) water channel showed exacerbation of KA-induced epileptogenesis. We conclude that the pharmacological modulation of glymphatic fluid transport may represent a potential strategy to dampen epileptogenesis and the occurrence of spontaneous seizures following KA-induced SE.


Conflict of interest statement

The authors declare no competing interests.

Figures

Fig. 1
Fig. 1. PPA changes the pattern of status epilepticus after intrahippocampal KA infusion.
A Mice received an intrahippocampal infusion of KA (20 mM, 50 nl, 10 nl/min, right CA1 region) followed by continuous 72-hour EEG recordings. B EEG trace shows a representative example of KA-induced status epilepticus. C The epileptiform activity was subdivided into two characteristic phases: phase 1, the initial period, is characterized by recurrent seizures (stars), followed by phase 2 of continuous epileptiform spiking discharges (red line segment) with high frequency of spiking. Epileptiform discharges of phase 1 and phase 2 at higher temporal resolution are shown on the right. D Time-course spike frequency analysis of the KA-induced status epilepticus from representative vehicle and PPA-treated mice over 72 hours after intrahippocampal KA infusion. PPA is an i.p. pan-adrenergic receptor blocker cocktail consisting of prazosin (6 mg/kg), propranolol (6 mg/kg) and atipamezole (0.6 mg/kg). We chose a threshold of 0.1 Hz spike frequency for the termination of phase 2 (horizontal dash line). E Hourly maximum Racine scale by video inspection of KA-induced status epilepticus from representative vehicle- and PPA-treated mice after intrahippocampal KA infusion. F Histogram comparing the durations of the two phases of KA-induced status epilepticus in vehicle and PPA treated KA mice. KA-Veh (n = 7) versus KA-PPA (n = 6): Phase 1 latency of the first seizure post KA infusion, **P = 0.004 (unpaired two-tailed t-test); seizure number, P = 0.148 (two-tailed Mann–Whitney test); Phase 1 duration, *P = 0.038. (unpaired two-tailed t-test); Seizure interval, **P = 0.0011 (unpaired two-tailed t-test). Phase 2, Total spike number, *P = 0.043 (unpaired two-tailed t test); Phase 2 duration, **P = 0.007 (unpaired two-tailed t-test). G In a subset of the mice, Racine scale was quantified from analysis of videotape recordings. KA-Veh (n = 4) versus KA-PPA (n = 3): Racine scores of Phase 1, *P = 0.029 (unpaired two-tailed t-test); Racine scores of phase 2, P = 0.380 (unpaired two-tailed t-test). Data are presented as mean ± SEM.
Fig. 2
Fig. 2. Pan-adrenergic inhibition improves behavioral outcomes of KA-induced chronic epilepsy.
A Timeline of the experimental design. Five minutes after intrahippocampal KA infusion, mice were randomly divided into two groups that received daily injections of either PPA or vehicle for three consecutive days. After 3–4 weeks, cortical EEG electrodes were implanted in a subgroup of mice and EEG recordings obtained one week later. In parallel, we measured open-field and Rota-rod behavioral scores in a separate group of mice. B Seizure event plots show each convulsive seizure (red dot) onset time for individual mice in four-day recordings from the KA (left) and PPA-treated KA (right) groups. Heatmap (below) indicates the frequency of seizure onsets per mouse per four-hour recording in each group. C Kaplan–Meier survival curve of Sham, KA-Veh and KA-PPA (5 min) groups after KA infusion (n = 12 each, Sham vs KA-Veh *P = 0.039, KA-Veh vs KA-PPA **P = 0.003, Log-rank test). D The numbers of seizures in 4-day recordings, duration of spontaneous seizures, maximum Racine scale in four days, and number of seizure-free days contrasted between KA-Veh and KA-PPA mice. KA-Veh (n = 6) versus KA-PPA (n = 7). Seizure numbers, *P = 0.044 (two-tailed Mann–Whitney test); seizure duration, *P = 0.031 (unpaired two-tailed t-test); maximal Racine scale, *P = 0.048 (two-tailed Mann–Whitney test) and seizure-free days, P = 0.237 (unpaired two-tailed t-test). E The representative traces of motion trails in the open-field test among Sham, KA-Veh and KA-PPA groups (left). The comparisons of total distances traveled are presented on the right. (one-way ANOVA, Tukey’s multiple comparisons test, Sham (n = 5) vs KA-Veh (n = 5) **P = 0.006, KA-Veh (n = 5) vs KA-PPA (n = 6) *P = 0.013). F Motor coordination and motor learning by the Rota-Rod test showing partial recovery with PPA treatment. Comparison of the latency to fall among Sham, KA-Veh and KA-PPA groups (two-way ANOVA, Tukey’s multiple comparisons test, Sham (n = 7) vs KA-Veh (n = 8), ***P < 0.001, **P = 0.005; KA-Veh (n = 8) vs KA-PPA (n = 8) #P < 0.05). Data are presented as mean ± SEM.
Fig. 3
Fig. 3. 30-hour delayed pan-adrenergic inhibition reduces rate of spontaneous seizures in a chronic epilepsy model.
A Timeline of experimental design. At 30 h after intrahippocampal KA infusion, mice were randomly divided into two groups that received either a daily injection of PPA or vehicle for three consecutive days. After 3–4 weeks, cortical EEG electrodes were implanted and recordings were obtained one week later. B Seizure event plots show each convulsive seizure (red dot) onset time for individuals in four-day recordings from the KA-Veh (left) and KA-PPA (30 h) (right) groups. Heatmap (below) indicates the frequency of seizure onsets per mouse per four-hour recording in each group. C The analysis of seizure numbers, duration of spontaneous seizures, maximum Racine scale in the four-day recordings, and seizure-free days between the KA-Veh and KA-PPA (30 h) mouse groups at 3–4 weeks. KA-Veh (n = 6) versus KA-PPA (n = 11), maximal Racine scale, *P = 0.031 (two-tailed Mann–Whitney test); seizure numbers, *P = 0.042 (two-tailed Mann–Whitney test); average seizure duration, P = 0.719 (unpaired two-tailed t-test), and seizure-free days, **P = 0.004 (two-tailed Mann–Whitney test). D Timeline of experimental design. At two months post-KA infusion, four-day EEG recordings were obtained from the KA-Veh and KA-PPA (30 h) groups. E Seizure event plots show each convulsive seizure (red dot) onset time for individuals in the 4-day recordings from the KA-Veh (left) and KA-PPA (30 h) (right) groups at two months. F The heatmap (below) indicates the frequency of seizure onset per mouse during the four-hour recordings in each mouse group. The analysis of seizure numbers, duration of spontaneous seizures, maximum Racine scale in the four-day recordings, and seizure-free days between the KA-Veh and KA-PPA (30 h) mouse groups at two months. KA-Veh (n = 7) versus KA-PPA (n = 11), maximum Racine scale, P = 0.100 (two-tailed Mann–Whitney test), seizure numbers, *P = 0.035 (unpaired two-tailed t-test); average seizure duration, P = 0.535 (unpaired two-tailed t-test), and seizure-free days, P = 0.181 (unpaired two-tailed t-test). Data are presented as mean ± SEM.
Fig. 4
Fig. 4. Delayed administration of PPA at 3 weeks post-KA transiently reduces seizure burden.
A Timeline of experimental design of 3-week delayed PPA treatment. At 3–4 weeks post KA infusion, mice received a single intraperitoneal dose of PPA or saline vehicle. (B) Representative plot of seizures onset distributions  during the first six hours after  PPA or vehicle i.p. Each horizontal line represents a mouse and each dot indicates a seizure. The heatmap above indicates the seizure frequency of each group (left). The number of spontaneous convulsive seizures (middle), N = 10 each, *P = 0.013, two-tailed Mann–Whitney test. C For both KA-Veh and KA-PPA groups, five out of ten mice had convulsive seizures during 12-hour recording session. The average duration of convulsive seizures (left) and the delay to the first seizure (right) is summarized (n = 5 each, seizure duration, P = 0.070, unpaired two-tailed t-test; delay to the first seizure, *P = 0.016, unpaired two-tailed t-test). D Timeline and normalized spike frequency is calculated based on the pre-PPA or -vehicle baseline (left). Quantification between two-hour window preceding and after PPA or vehicle injection. (Middle, n = 10 each, time-treatment interaction, 2-way ANOVA, *P < 0.001. Right, n = 10 each, 2-way ANOVA, Sidak’s multiple comparisons test. **P = 0.002). E Representative traces demonstrating interictal spikes before and after PPA or vehicle treatment in epileptic mice. Data are presented as mean ± SEM.
Fig. 5
Fig. 5. PPA treatment enhances acute and chronic glymphatic tracer influx, while increasing EEG slow wave activity.
A Experimental design (Left) and population-based average images of tracer distribution (right). B The CSF tracer influx area in brain slices (AP + 0.6 mm), WT-Veh (n = 5) vs WT-PPA (n = 6), unpaired two-tailed t-test, *P = 0.028. C Regional influx analysis in brain slices (left, AP −1.2 mm) after PPA in wildtype mice. Histograms summarizing the glymphatic influx area fractions in multiple brain regions (right, AP -1.2 mm). WT-Veh (n = 7) vs WT-PPA (n = 6), two-way ANOVA, Sidak’s multiple comparisons test. Ventral cortex, ***P < 0.001, hypothalamus, **P = 0.008. D EEG power spectrum analysis in wildtype mice. Left, raw EEG spectrum, n = 6 each, ***< 0.001, time-treatment interaction, two-way ANOVA. Insert, fold change to WT-Veh. Right, slow wave activity (SWA, 0.5–4 Hz), n = 6 each, **P = 0.004, paired two-tailed t-test. E Experimental design (left) and population-based images of coronal sections (right, AP + 0.6 mm). F The glymphatic influx area fractions in slices (AP + 0.6 mm), n = 4 each, Sham-Veh vs KA-Veh, *P = 0.014, KA-Veh vs KA-PPA, *P = 0.012, one-way ANOVA, Tukey’s multiple comparisons test. G Experimental design (left) and Population-based images of brain coronal sections (right, AP + 0.6 mm). H The glymphatic influx area fractions in slices (AP + 0.6 mm), Sham-Veh (n = 6) vs KA-Veh (n = 6) **P = 0.002, KA-Veh (n = 6) vs KA-PPA (3 wks) (n = 5) *P = 0.043, one-way ANOVA, Tukey’s multiple comparisons test. I Regional influx analysis in brain slice (AP −1.2 mm) after PPA in chronic epileptic mice. KA-Veh (n = 7) vs KA-PPA (n = 5). Ventral cortex, ***< 0.001, hypothalamus, ***P < 0.001, two-way ANOVA, Sidak’s multiple comparisons test. J EEG power spectrum in KA mice. Left, raw EEG spectrum, n = 6 each, ***P < 0.001, time-treatment interaction, two-way ANOVA. Insert, fold change to KA-Veh. Right, the total SWA power (0.5–4 Hz). Scale bar = 1 mm. Data are presented as mean ± SEM.
Fig. 6
Fig. 6. Early PPA treatment results in improved glymphatic transport in the epilepsy chronic phase.
A At 3–4 weeks, AQP4 immunostaining, CSF tracer influx and clearance were analyzed. B Glymphatic analysis (left). Population-based average images of CSF tracer distribution in coronal sections (AP + 0.6 mm) (middle). The tracer influx area fractions (right), sham-Vehicle vs KA-Vehicle ***P < 0.001, KA-Vehicle vs KA-PPA *P = 0.020, One-way ANOVA, Tukey’s multiple comparisons test. C Schematic showing striatal cannula implantation and in vivo DB53 measurement. D Representative in vivo femoral vein images. (Left, scale-bar,1 mm). Time-course fluorescent intensity of DB53 in the femoral vein (middle, Sham (n = 5) vs KA-Veh (n = 3), ***P < 0.001; KA-Veh (n = 3) vs KA-PPA (n = 4), ***P < 0.001). Quantification of efflux (area under curve, AUC, 0-120 min) (right, Sham vs KA-Veh *P = 0.035, KA-Veh vs KA-PPA *P = 0.037, one-way ANOVA, Tukey’s multiple comparisons test). E AQP4 expression in somatosensory cortex, insert show higher magnification images (scale bar, 80 µm, insert, 50 µm). Quantification of AQP4 immunoreactivity (Sham-Veh KA-Veh *P = 0.032, KA-Veh vs KA-PPA *P = 0.017, one-way ANOVA, Tukey’s multiple comparisons test). F Quantification of AQP4 polarization index around small and large vessels (Upper panel, small vessels, sham-Veh vs KA-Veh, *P = 0.040; KA-Veh vs KA-PPA, *P = 0.020. Lower panel, large vessels, Sham-Veh vs KA-Veh *P = 0.042, KA-Veh vs KA-PPA **P = 0.008. One-way ANOVA, Tukey’s multiple comparisons test). G Glymphatic tracer influx correlates with the severity of epilepsy. Left, Correlations of CSF tracer influx with interictal spike frequency (R2 = 0.664, ***P < 0.001), and with the severity of astrogliosis by CA1 GFAP expression (R2 = 0.827, ***P < 0.001). Middle, correlations of influx with CA1 neuronal count (R2 = 0.822, ***P < 0.001), and cortical AQP4 polarization index (R2 = 0.342 *P = 0.022). Right, Correlations of influx with seizure duration (R2 = 0.874, ***P < 0.001) and seizure number (R2 = 0.394, **P = 0.004). Linear least squares regression. MPI, mean pixel intensity. Mice/group n are indicated on the graph. Data are presented as mean ± SEM.
Fig. 7
Fig. 7. AQP4 deletion aggravates KA-induced seizures.
A AQP4-KO and C57 wildtype control mice received an intrahippocampal infusion of KA followed by continuous 72-hour EEG recordings. After 3–4 weeks, the same groups of mice underwent four-day EEG recordings. EEG trace shows a representative example of KA-induced status epilepticus (stars: seizures). As in Fig. 1, the epileptiform activity was subdivided into two phases, with depiction of recurrent seizure onsets in phase 1 (middle in light-colored box). Epileptiform discharges of phase 2 are displayed at higher temporal resolution (right in dark-colored box). B Time-course spike frequency and hourly maximal Racine scale of the KA-induced status epilepticus from representative WT and Aqp4-KO mice. C Histogram comparing the durations of the two phases of KA-induced status epilepticus in control and AQP4-KO mice. Phase 1, latency of the first seizure post KA infusion, WT (n = 5) versus Aqp4-KO (n = 8), *P = 0.019, unpaired two-tailed t-test test; number of seizures, WT (n = 5) versus Aqp4-KO (n = 8), P = 0.302, unpaired Mann–Whitney’s test; Phase 1 duration, WT (n = 5) versus Aqp4-KO (n = 8), P = 0.378, unpaired two-tailed t-test; seizure duration, WT (n = 5) versus Aqp4-KO (n = 8), *P = 0.017, unpaired two-tailed t-test; seizure interval, WT (n = 5) versus Aqp4-KO (n = 8), P = 0.343, unpaired two-tailed t-test; mean Racine Scale, **P = 0.007, unpaired two-tailed t-test. Phase 2, duration, WT (n = 4) versus Aqp4-KO (n = 8), *P = 0.026, two-tailed Mann–Whitney’s test; total spike number, WT (n = 4) versus Aqp4-KO (n = 8), *P = 0.047, two-tailed Mann–Whitney’s test. D The seizure numbers in the four-day recordings, duration of spontaneous seizures, maximal Racine scale in the four-day recordings, and seizure-free days compared between control and AQP4-KO mice during chronic epilepsy (3–4 weeks after intrahippocampal KA infusion). N = 5 each, seizure numbers, *P = 0.040 (two-tailed Mann–Whitney’s test); seizure duration, ***P < 0.001 (unpaired two-tailed t-test); maximal Racine scale, *P = 0.024 (two-tailed Mann–Whitney’s test) and seizure-free days, *P = 0.040 (two-tailed Mann–Whitney’s test). Data are presented as mean ± SEM.

References

    1. Fisher, R. S. et al. ILAE official report: a practical clinical definition of epilepsy. Epilepsia55, 475–482 (2014). - PubMed
    1. Blumenfeld, H. New strategies for preventing epileptogenesis: perspective and overview. Neurosci. Lett.497, 153–154 (2011). - PMC - PubMed
    1. Piccenna, L., Shears, G. & O’Brien, T. J. Management of post-traumatic epilepsy: an evidence review over the last 5 years and future directions. Epilepsia Open2, 123–144 (2017). - PMC - PubMed
    1. Roberg, L. E. et al. Prediction of long-term survival after status epilepticus using the ACD score. JAMA Neurol.79, 604–613 (2022). - PMC - PubMed
    1. Rogawski, M. A., Löscher, W. & Rho, J. M. Mechanisms of action of antiseizure drugs and the ketogenic diet. Cold Spring Harb. Perspect. Med.6, a022780 (2016). - PMC - PubMed

Publication types

MeSH terms

LinkOut - more resources