. 2024 Nov 6;15(1):9575.
doi: 10.1038/s41467-024-53700-9.

Induction of a distinct macrophage population and protection from lung injury and fibrosis by Notch2 blockade

Affiliations

Induction of a distinct macrophage population and protection from lung injury and fibrosis by Notch2 blockade

Mayra Cruz Tleugabulova et al. Nat Commun. .

Abstract

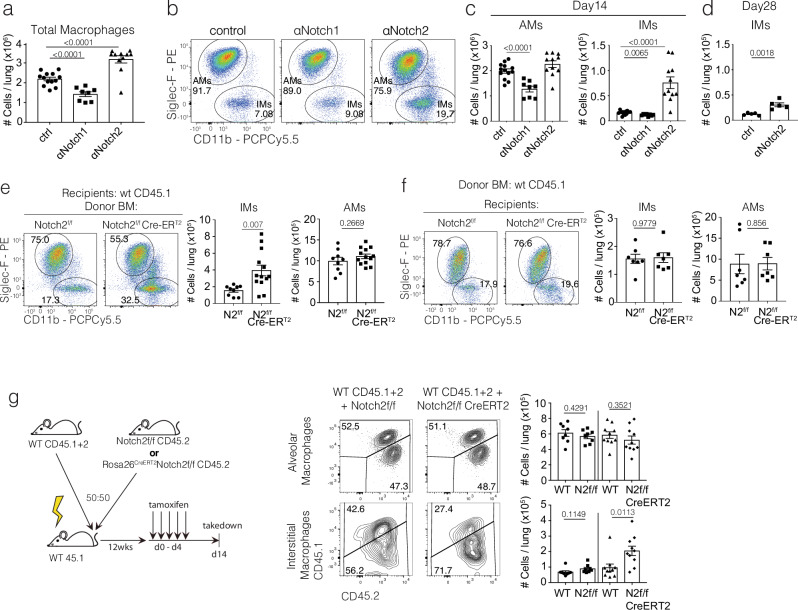
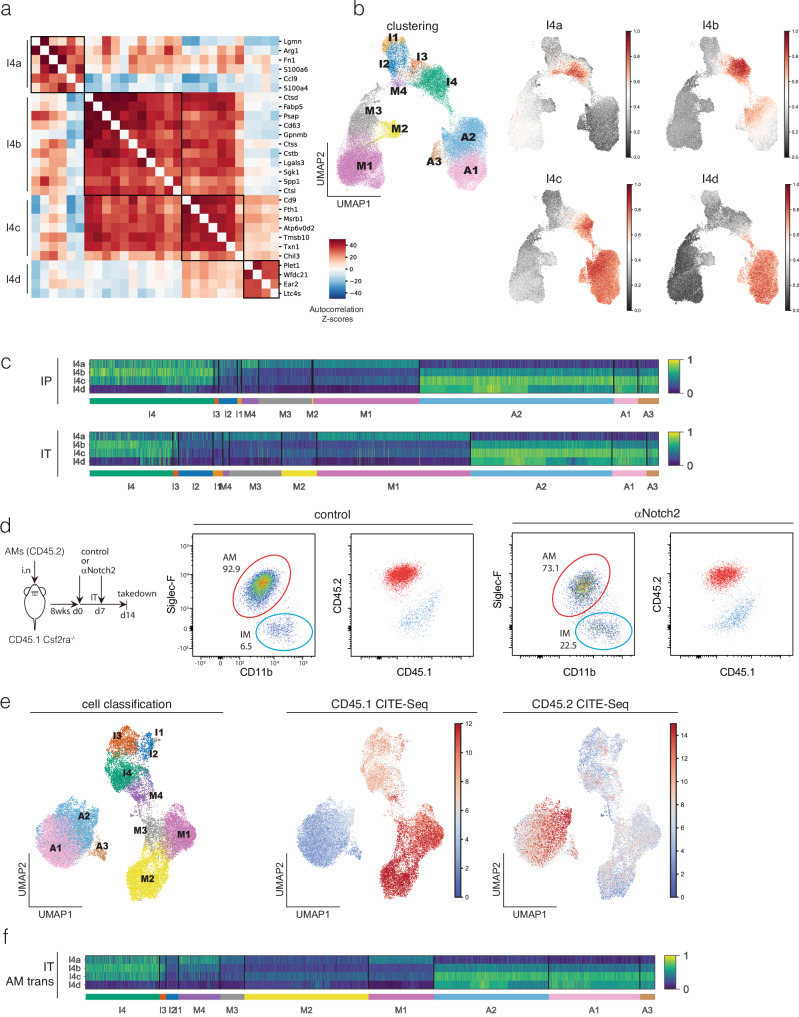
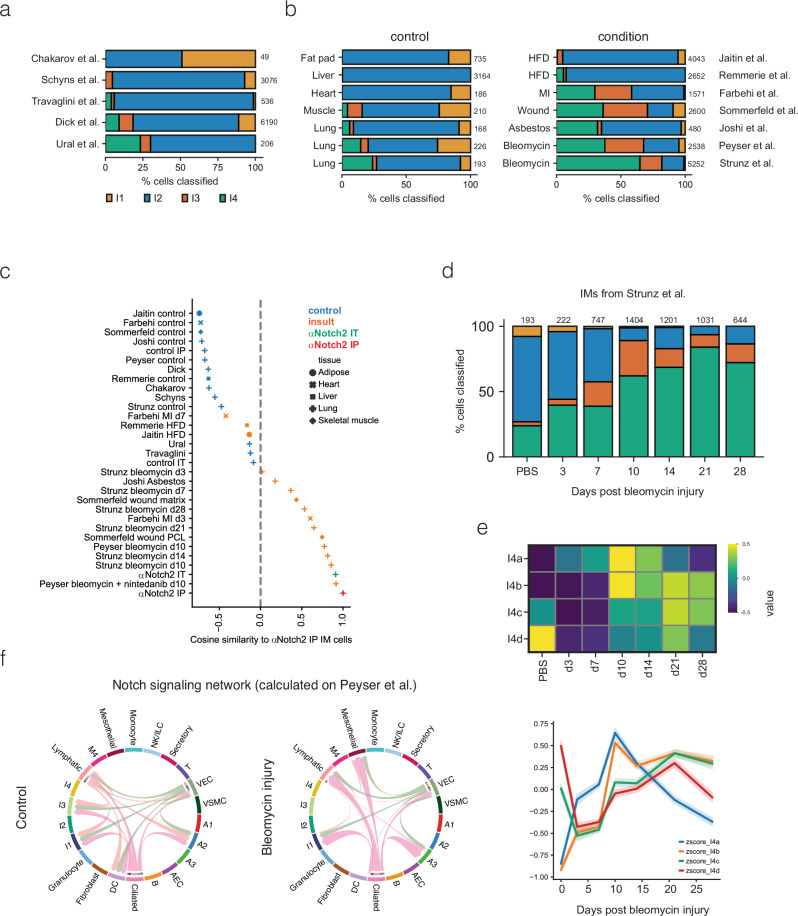
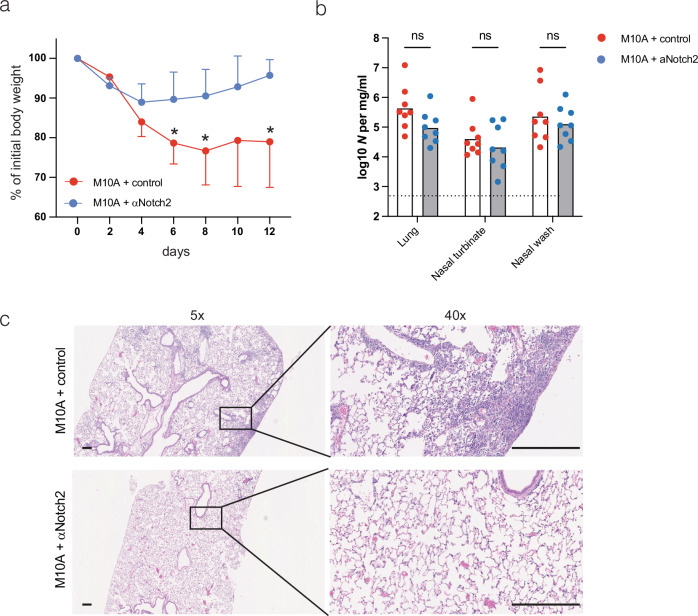
Macrophages are pleiotropic and diverse cells that populate all tissues of the body. Besides tissue-specific resident macrophages such as alveolar macrophages, Kupffer cells, and microglia, multiple organs harbor at least two subtypes of other resident macrophages at steady state. During certain circumstances, like tissue insult, additional subtypes of macrophages are recruited to the tissue from the monocyte pool. Previously, a recruited macrophage population marked by expression of Spp1, Cd9, Gpnmb, Fabp5, and Trem2, has been described in several models of organ injury and cancer, and has been linked to fibrosis in mice and humans. Here, we show that Notch2 blockade, given systemically or locally, leads to an increase in this putative pro-fibrotic macrophage in the lung and that this macrophage state can only be adopted by monocytically derived cells and not resident alveolar macrophages. Using a bleomycin and COVID-19 model of lung injury and fibrosis, we find that the expansion of these macrophages before lung injury does not promote fibrosis but rather appears to ameliorate it. This suggests that these damage-associated macrophages are not, by themselves, drivers of fibrosis in the lung.


Conflict of interest statement

M.C.T., S.P.M., A.W., A.A., J.D.W., J.La, J.J.H., V.S.G., M. De S. B.K., S.A., J. Lu, S.J., A.R., H.B., C.D.A., S.Da, Z.M., H.B., S.Du, A.S.S., and M.N. are employees of Genentech/Roche. The remaining authors declare no other competing interests.

Figures

Fig. 1
Fig. 1. Notch2 but not Notch1 inhibition expands lung interstitial macrophages.
ad Analysis of lung macrophages after intraperitoneal (IP) administration of 20 mg/kg of αRagweed (control), αNotch2 or αNotch1 antibodies once per week for two weeks and analyzed at day 14 (a-c) or at day 28 (d). Mononuclear cells were isolated and analyzed by flow cytometry for a total number of macrophages (CD64+MerTK+ cells) (a), as well as the proportion and number of alveolar (CD64+MerTK+ SiglecF+/CD11bint) vs interstitial (CD64+MerTK+ SiglecF-/CD11b+) subsets after Notch1 or Notch2 antibody blockade (b, c). n = 13, 3 experiments. d Absolute numbers of AMs and IMs after 28 days of αNotch2 antibody blockade (20 days after the last antibody dose). n = 5, 1 experiment. e, f The Notch2 effect is intrinsic to the hematopoietic compartment. Bone marrow from CD45.2 mice expressing either Notch2f/f or Notch2f/fCreERT2 was used to generate bone marrow chimeras with CD45.1 mice as the hosts, n = 9 Notch2f/f-> WT, n = 13 Notch2f/fCreERT2 -> WT, 3 experiments (e) as well as the converse n = 7 WT -> Notch2f/f, n = 7 WT-> Notch2f/fCreERT2, 2 experiments (f). g Mixed bone marrow chimeras demonstrate that the Notch2 effect is cell intrinsic. Congenically marked WT (CD45.1/2) bone marrow cells were mixed together with Notch2f/f or Notch2f/fCreERT2 bone marrow (CD45.2) in equal ratios, and transferred intravenously (i.v.) into wild-type mice (CD45.1) as diagrammed in the left panel. After tamoxifen treatment, flow cytometry was used to analyze the contribution of each bone marrow (45.1/2 vs 45.2) to AMs (upper middle panel) and IMs (lower middle panel). The absolute number of alveolar and interstitial macrophages per lung is shown in the right panel. n = 10, 2 experiments. An unpaired parametric two-tailed t-test was applied in all graphs where statistical data is shown. Data is graphed as the mean +/- standard error of the mean (SEM).
Fig. 2
Fig. 2. Notch2 inhibition expands a population of Spp1, Gpnmb, Fabp5 expressing macrophages in the lung.
a scRNAseq analysis of sorted monocytes, AMs, and IMs from mice treated IP with αNotch2 (2 mice) or control antibody (4 mice), shown as a UMAP with clusters generated by unsupervised clustering. Cells, colored on the basis of antibody treatment, are shown on the right. b The distribution of cells (IMs – left, AMs – middle, monocytes – right) comparing the effect of αNotch2 antibody treatment as a percentage of the total. c Bubble plots show differentially expressed genes identified as markers for each population. Their average expression is normalized across columns (color-coded), and the percentage of cells expressing the genes within each cluster is shown by the size of the bubble. d Clustermap depicting pairwise cosine similarities between each of the defined clusters shows high similarity of the M4 cluster to IMs and monocytes.
Fig. 3
Fig. 3. Cluster I4 macrophages are derived from monocytes.
a Separate UMAP representation of cells from mice treated with control (left) or ɑNotch2 antibody (right). Intravascular CITE-Seq αCD45 antibody labels only monocytes in both conditions. After Notch2 blockade the lack of CITE-Seq intravascular αCD45 antibody staining of M4 monocytes (see b, and Supplementary Fig. 3) suggests that they have emigrated into tissue. b RNA-Velocity analysis of clustered cells after control (left) and ɑNotch2 (right) antibody treatment suggests that I4 macrophages derive from M4 monocytes. c Attenuation of IM expansion after Notch2 blockade in CCR2 KO mice. αNotch2 or control antibodies were administered to WT or CCR2 KO mice as shown in Supplementary Fig. 1b. Proportions of AMs compared to IMs determined by flow cytometry in WT and CCR2 KO mice are shown on the left. Absolute numbers of IMs are shown on the right. n = 9 WT-Ctrl, n = 10 WT-αNotch2, n = 11 CCR2ko-Ctrl, n = 12 CCR2ko-αNotch2. An unpaired parametric two-tailed t-test was applied for statistical analysis. Data is graphed as the mean +/- standard error of the mean (SEM).
Fig. 4
Fig. 4. Intra-tracheal (IT) αNotch2 administration induces I4 macrophages that are similar to alveolar macrophages.
IT Notch2 antibody treatment induces I4 macrophages. αNotch2 antibody (n = 5) or control antibody (n = 5) was given IT, in two doses, once a week for two weeks before the lungs were harvested. Myeloid cells were prepared for scRNAseq as described in Supplementary Fig. 2a, b. a scRNAseq analysis and unsupervised clustering of sorted AMs, IMs, and monocytes is shown as a UMAP. Colors represent cell clusters (left) or the treatment status of the mice (right). b Proportions of individual subclusters of IMs, AMs, and monocytes before and after treatment are shown in the bar graph. I4 IMs represent the majority of IMs seen after IT Notch2 blockade. The presence of M2 patrolling monocytes suggests that there is little systemic effect of IT administration. c Quantitation of IM numbers after IT Notch2 antibody blockade. Unpaired parametric two-tailed t-test was applied as statistical analysis. Data is graphed as the mean +/- SEM. d RNA-Velocity analysis suggests a potential connection between I4 macrophages and AMs. After control antibody treatment, AMs, IM, and monocytes are distributed separately (left Umap). After IT Notch2 blockade, I4 cells are positioned between AMs and IMs (right Umap). RNA-Velocity analysis shows potential transitions between AMs and I4 cells. Colors reflect unsupervised clustering identity (a). e Cosine similarity analysis of all AM, IM, and monocyte clusters in IT treatment showing a high similarity of cluster I4 to AMs.
Fig. 5
Fig. 5. Hotspot analysis identifies an I4 core gene module (I4b).
Hotspot analysis of IP and IT IM subclusters identified 28 genes with significant pairwise local correlation that could be divided into four modules. a Heatmap showing the Z-scores for the local correlation values for the 28 genes in the four modules, I4a, I4b, I4c, and I4d. b Gene scoring for each of the modules projected on the joint IP/IT UMAP. Joint UMAP colored by cluster identification is shown on the left. The I4a module is expressed in cluster M4 and a subset of I4 cells. The I4b module is mainly expressed in cluster I4. Module I4c is expressed in cluster I4 and all AM subclusters. I4d is expressed primarily in AMs and in the AMs that bridge between cluster I4 and AMs. c Heatmap representation of I4a-d module expression in all monocyte, AM, and IM clusters, separated by the route of antibody application (IP - upper, IT - lower). d Schematic depiction of the experimental timeline (left) and flow cytometry analysis of AM-transplant model (right). CD45.2 AMs were transferred intranasally into CD45.1+ Csf2ra-/- mice at neonatal state. Eight weeks later control or αNotch2 antibody was instilled IT as before. Mice were taken down 2 weeks after initial antibody instillation. Flow cytometry analysis confirms CD45.2 expression in AMs and CD45.1 expression in IMs. Cells from AM gate are shown in red in CD45.1/CD45.2 plot. Cells from IM gate are shown as blue in CD45.1/CD45.2 plot. Ungated cells from AM/IM gate are represented in gray. e scRNAseq analysis and unsupervised clustering of sorted AMs, IMs, and monocytes is shown as a UMAP. Colors represent cell clusters (left) or CITE-Seq antibody staining (right). CITE-Seq antibody counts were de-noised and scaled by background (dsb) and normalized counts were projected on scRNAseq UMAP. f Heatmap representation of I4a-d module expression in all monocyte, AM, and IM clusters in AM-transplant mice after IT αNotch2 antibody.
Fig. 6
Fig. 6. Comparison of macrophages generated in this study to macrophages in 12 previously published studies.
a Cell classification of IMs from five published datasets,,,, based on the clusters in our IP and IT datasets using pySinglecellNet. Analysis of steady-state IMs identified in three IM subsets as well as a small fraction of I4 cells (green). Numbers on the right show the total number of analyzed cells in each study. b Analysis of IMs from insulted tissue from seven published studies as noted,,–. Label transfer using pySinglecellNet as in (a) identified variable numbers of I4 macrophages (green) with significant numbers in multiple lung injury studies. Control conditions are shown on the left and insulted conditions on the right. c Pairwise cosine similarity between aggregated IM cells from each study according to the experimental condition and compared to aggregated IMs after Notch2 antibody blockade. IMs after IP Notch2 application showed higher similarity to IM cells derived from insult conditions (in orange) and IT Notch2 antibody application (in green) than baseline or control samples across several tissues (in blue). d Proportion of cells classified as I4 increase in a lung bleomycin time-course study by Strunz et al. e Hotspot module expression in all cells classified as AMs, IMs, or monocytes over a bleomycin lung injury time course from Strunz et al. shows the progressive change in module expression over time. Data is presented as a heatmap (top) and xy-graph (bottom). f Decreased Notch receptor/ligand interactions detected in interstitial macrophages after bleomycin injury. CellChat analysis was performed from the whole lung scRNASeq data from Peyser et al. focusing on Notch receptor-Notch ligand interactions.
Fig. 7
Fig. 7. Notch2 antibody blockade ameliorates bleomycin induced lung fibrosis.
a Schematic depiction of experimental timeline. b Mice pre-treated with αNotch2 antibodies exhibited decreased weight loss after bleomycin treatment. c Histological analysis shows that pre-treatment with αNotch2 antibodies ameliorates lung inflammation and fibrosis as assessed by H&E (upper panels) and trichrome (lower panels) staining. Scale bar = 100 μm. d Inflammation (left) and fibrosis (right) scoring. Sections were scored blindly using a scoring scale described in the Methods section. e Deuterated hydroxyproline levels (New OHP (ug/3 right lobes), mean + SD) were measured by mass spectroscopy (MS/MS) as an indicator of newly synthesized collagen. f Analyzed AMs, IMs, and monocytes were isolated from mice at day 9 according to the experimental layout depicted in (a). Integrated UMAP after Harmony batch correction of IM cells classified according to the cell populations defined in this study, colored by cluster identity (left), or colored in blue by experimental condition (right). g Pairwise cosine similarity of total aggregated IM space (Supplementary Fig. 6a, b) shows high similarity of total IMs in bleomycin-injured lungs and lungs treated with αNotch2 antibody. Mixed-effects model with Geisser-Greenhouse correction followed by a Tukey’s multiple comparison test (b) or Kruskal Wallis test followed by Dunn’s multiple comparison test vs. control antibody + bleomycin group. b For clarity only one asterisk is shown (*p = 0.0006 (day −3), 0.0068 (d10), 0.0001 (d15), 0.0002 (d18), <0.0001 (d23)) and only for the comparison of the control and αNotch2 groups in the bleomycin arm. Data are presented as mean values +/- SD. Each dot represents one mouse. Sample size b, d, e: Control antibody + saline (n = 5); αNotch2 + saline (n = 4); Control antibody + bleomycin (day 0: n = 30 (b), day 24: n = 21 (d, e)); αNotch2 + bleomycin (day 0: n = 30 (b), day 24: n = 29 (d, e)). One representative of two independent experiments.
Fig. 8
Fig. 8. Notch2 antibody blockade ameliorated COVID-19 induced lung injury and fibrosis.
a Mice pre-treated with control or ɑNotch2 antibodies were infected with the MA-10 mouse-adapted strain of COVID virus and were weighed every other day until mice were sacrificed on day 12. b Viral titers in mice treated with control or ɑNotch2 antibodies were measured by PCR. c Attenuation of inflammation in M10A infected animals after ɑNotch2 antibody treatment. H&E sections of lungs from mice pretreated with control or αNotch2 antibodies at 5X and 40X magnification. Scale bar = 100 μm. Mixed-effects model with Geisser-Greenhouse correction followed by Šidák’s multiple comparison test (a); or unpaired parametric two-tailed t-test (b) were performed. a For clarity only one asterisk is shown (*p = 0.0022 (day 6), 0.0010 (d8), 0.0281 (d12)). Data are presented as mean values (a, b) +/- SD (a). Each dot represents one mouse. Sample sizes: a Control antibody + M10A infection (n = 15); αNotch2 + M10A infection (n = 11). b Control antibody + M10A infection (n = 8); αNotch2 + M10A infection (n = 8). Combined data from two independent experiments.

References

    1. Davies, L. C., Jenkins, S. J., Allen, J. E. & Taylor, P. R. Tissue-resident macrophages. Nat. Immunol.14, 986–995 (2013). - PMC - PubMed
    1. Guilliams, M., Thierry, G. R., Bonnardel, J. & Bajénoff, M. Establishment and maintenance of the macrophage niche. Immunity52, 434–451 (2020). - PubMed
    1. Alliot, F., Godin, I. & Pessac, B. Microglia derive from progenitors, originating from the yolk sac, and which proliferate in the brain. Dev. Brain Res.117, 145–152 (1999). - PubMed
    1. Ginhoux, F. et al. Fate mapping analysis reveals that adult microglia derive from primitive macrophages. Science330, 841–845 (2010). - PMC - PubMed
    1. Schulz, C. et al. A lineage of myeloid Cells independent of Myb and hematopoietic stem cells. Science336, 86–90 (2012). - PubMed

Publication types

MeSH terms