. 2024 Nov 6;15(1):9592.
doi: 10.1038/s41467-024-53824-y.

Electron-donable heterojunctions with synergetic Ru-Cu pair sites for biocatalytic microenvironment modulations in inflammatory mandible defects

Affiliations

Electron-donable heterojunctions with synergetic Ru-Cu pair sites for biocatalytic microenvironment modulations in inflammatory mandible defects

Mingru Bai et al. Nat Commun. .

Abstract

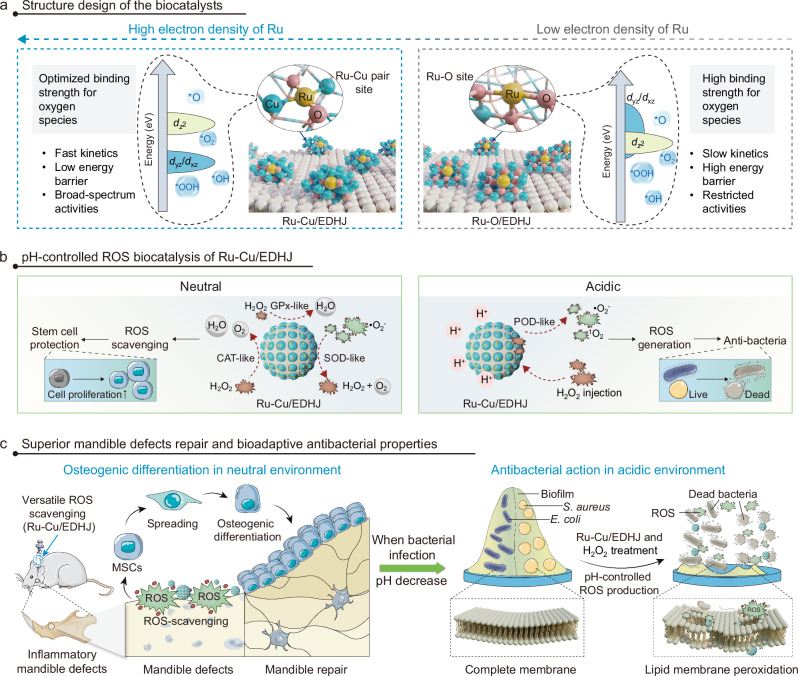
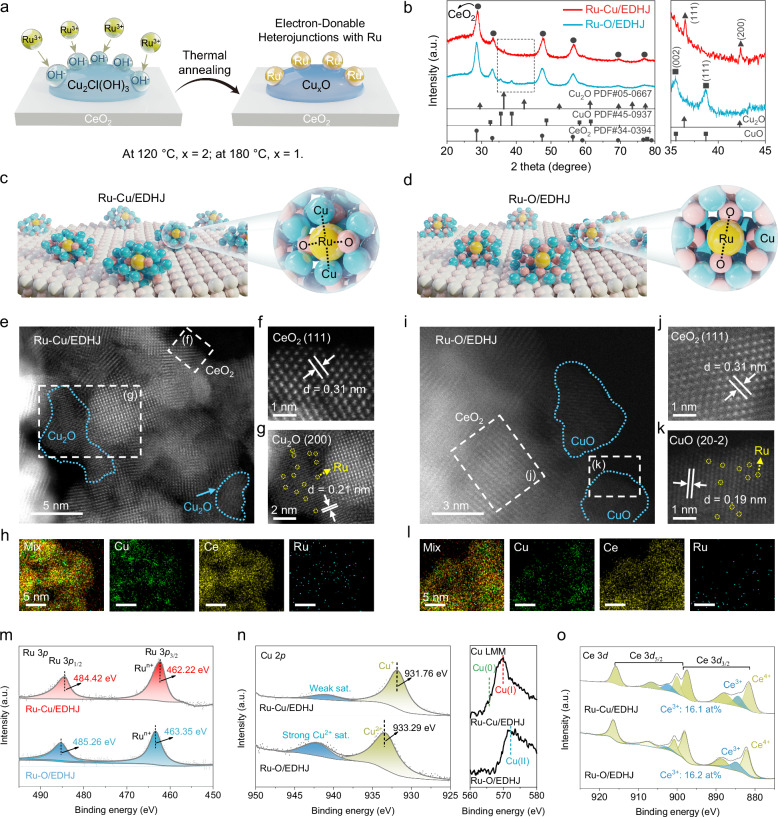
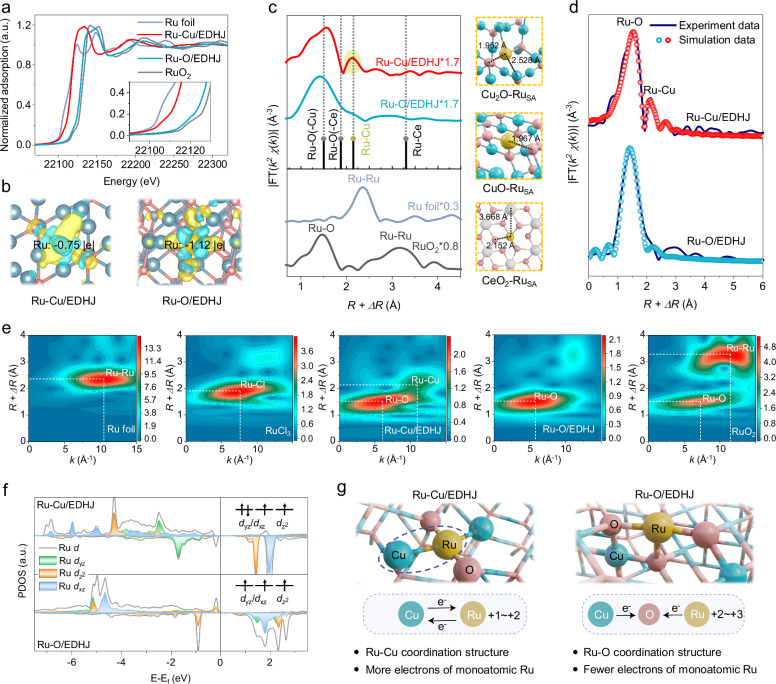
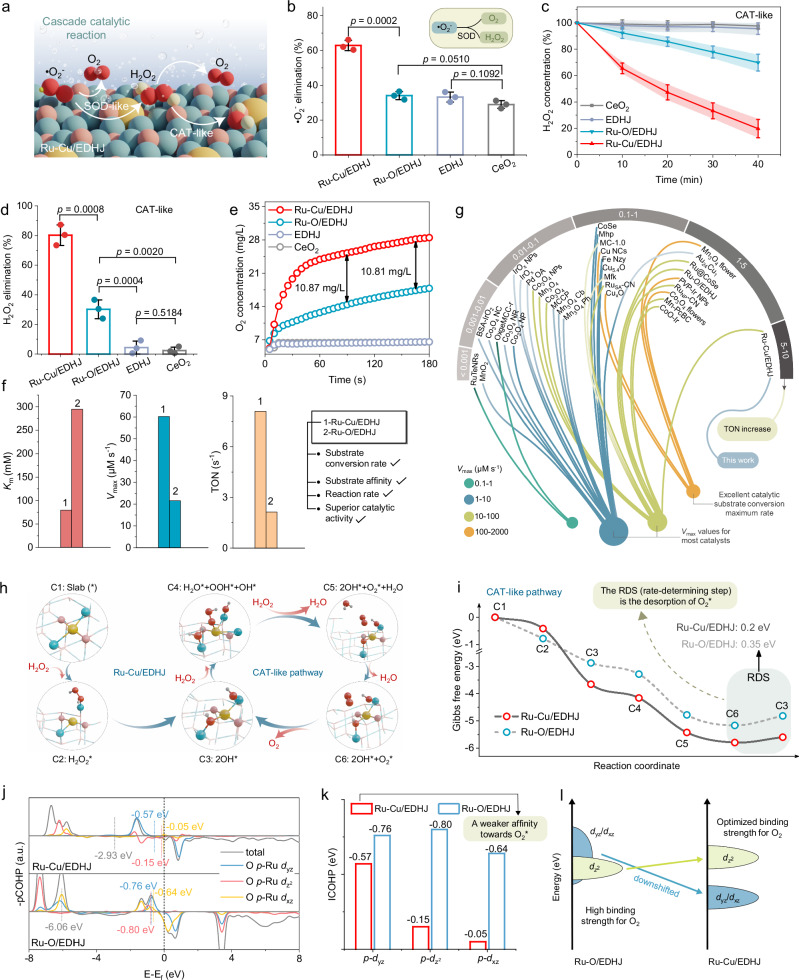
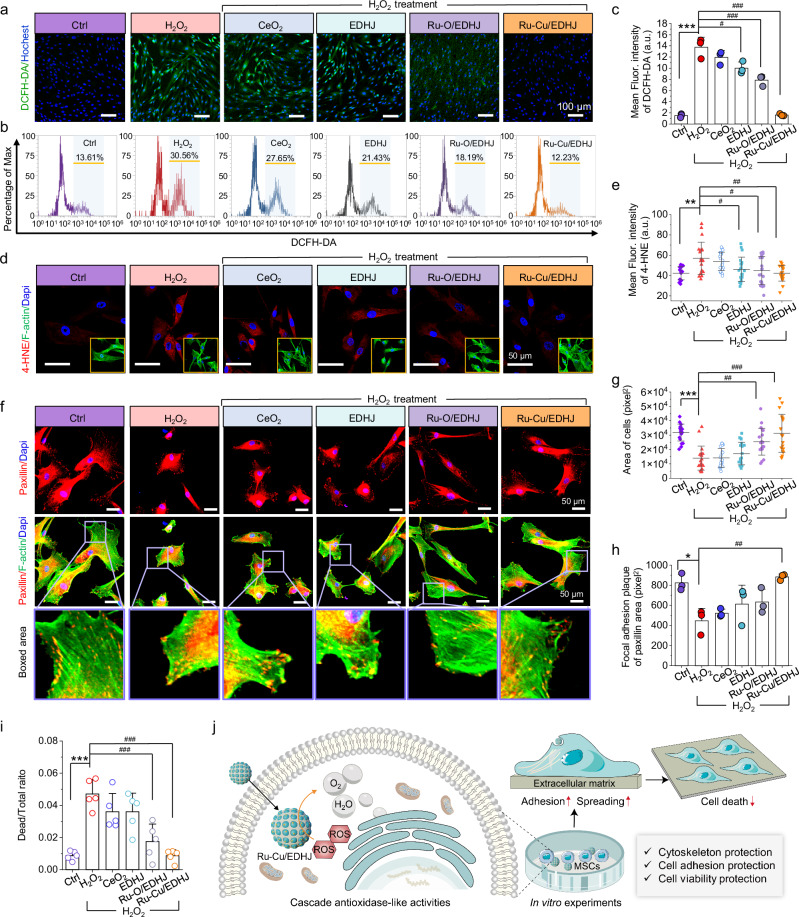
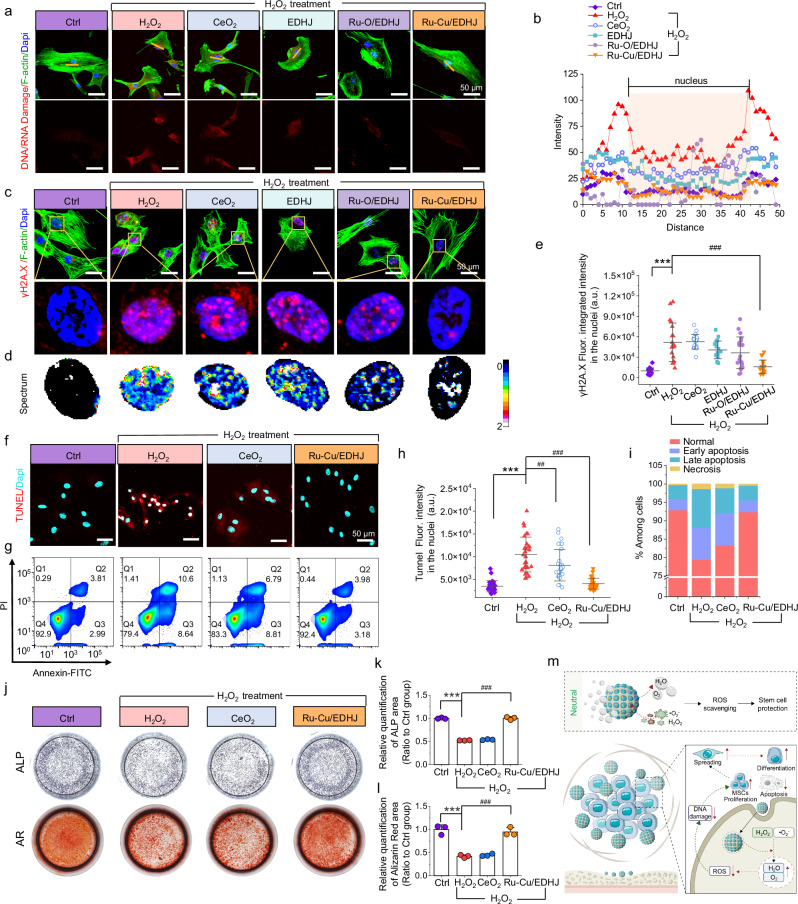
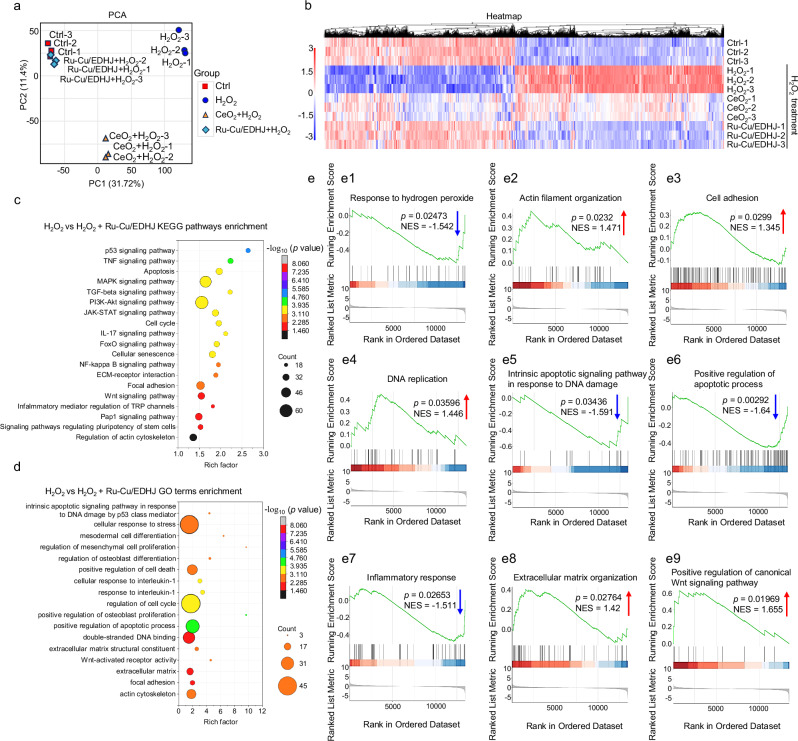
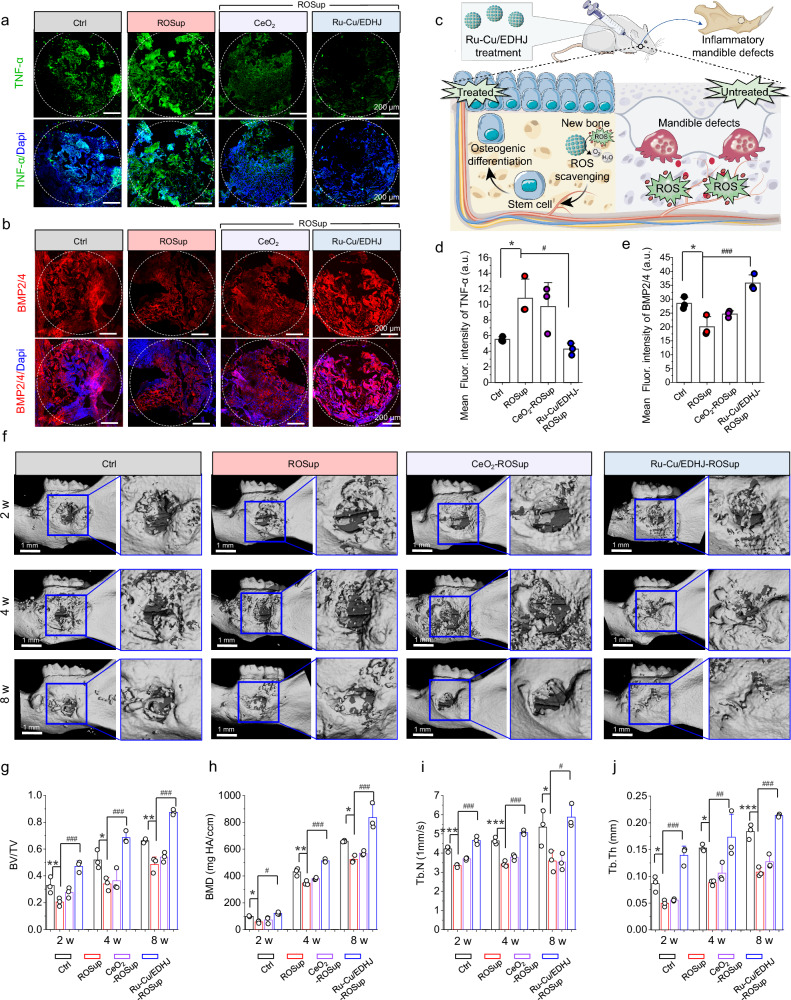
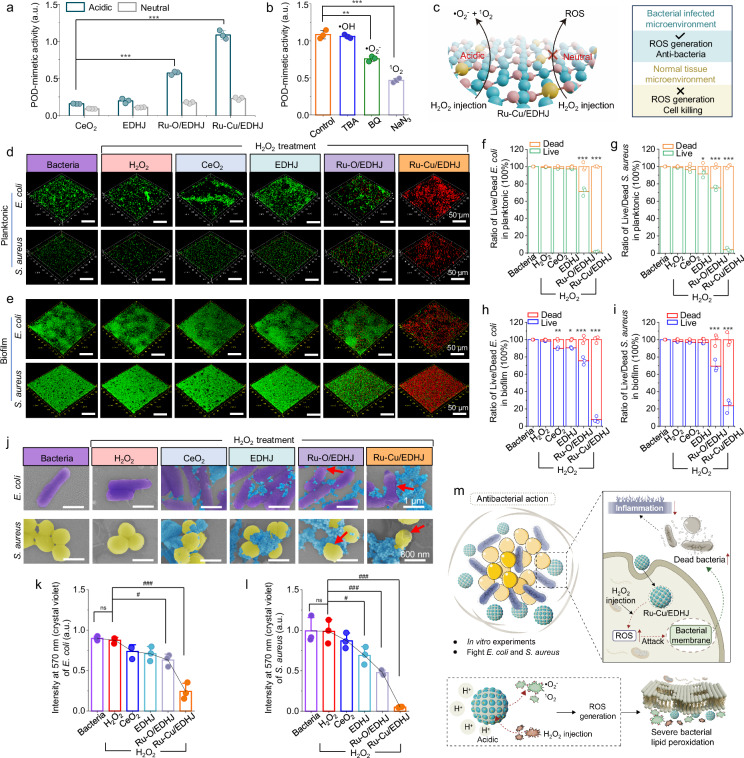
The clinical treatments of maxillofacial bone defects pose significant challenges due to complex microenvironments, including severe inflammation, high levels of reactive oxygen species (ROS), and potential bacterial infection. Herein, we propose the de novo design of an efficient, versatile, and precise electron-donable heterojunction with synergetic Ru-Cu pair sites (Ru-Cu/EDHJ) for superior biocatalytic regeneration of inflammatory mandible defects and pH-controlled antibacterial therapies. Our studies demonstrate that the unique structure of Ru-Cu/EDHJ enhances the electron density of Ru atoms and optimizes the binding strength of oxygen species, thus improving enzyme-like catalytic performance. Strikingly, this biocompatible Ru-Cu/EDHJ can efficiently switch between ROS scavenging in neutral media and ROS generation in acidic media, thus simultaneously exhibiting superior repair functions and bioadaptive antibacterial properties in treating mandible defects in male mice. We believe synthesizing such biocatalytic heterojunctions with exceptional enzyme-like capabilities will offer a promising pathway for engineering ROS biocatalytic materials to treat trauma, tumors, or infection-caused maxillofacial bone defects.


Conflict of interest statement

The authors declare no competing interests.

Figures

Fig. 1
Fig. 1. Structure design and biocatalytic properties of Ru-Cu/EDHJ.
a Structural and biocatalytic advantages of Ru-Cu/EDHJ when compared with Ru-O/EDHJ. b Graphical illustration for pH-controlled ROS biocatalysis of Ru-Cu/EDHJ. c The superior mandible defects repair and bioadaptive antibacterial properties of Ru-Cu/EDHJ.
Fig. 2
Fig. 2. Crystal structure characterizations of biocatalytic heterojunctions.
a Schematic preparation processes for Ru-Cu/EDHJ and Ru-O/EDHJ. b XRD spectra of Ru-Cu/EDHJ and Ru-O/EDHJ. The atomic structure difference of (c) Ru-Cu/EDHJ and (d) Ru-O/EDHJ. Atomic color coding in the structure: Ru, yellow; Cu, blue; Ce, gray; and O, pink. Atomic-scale HAADF-STEM images of (eg) Ru-Cu/EDHJ and (ik) Ru-O/EDHJ, atomically dispersed Ru atoms are marked in (g, k) by yellow circles. Elemental mapping of (h) Ru-Cu/EDHJ and (l) Ru-O/EDHJ. The high-resolution XPS of (m) Ru 3p, (n) Cu 2p, Cu LMM, and (o) Ce 3d of Ru-Cu/EDHJ and Ru-O/EDHJ. Experiments were repeated independently (e, f, g, h, i, j, k, l) three times with similar results. In (b, m, n, o), a.u. indicates the arbitrary units. In (n), sat. indicates the satellite peaks. In (o), at% indicates the atomic percent. Source data are provided as a Source Data file.
Fig. 3
Fig. 3. Analysis of precise atomic coordination environments of biocatalytic heterojunctions.
a Ru K-edge XANES spectra of Ru-Cu/EDHJ, Ru-O/EDHJ, and references (Ru foil and RuO2). b Differential charge density analysis of Ru centers (yellow and cyan represent charge accumulation and depletion, respectively, with a cutoff value of 0.006 e·Bohr-3 for the density-difference isosurface). Atomic color coding in the structure: Ru, yellow; Cu, blue; and O, pink. c Fourier-transformed k2-weighted EXAFS spectra. Right: optimized structure models for a Ru atom that anchors on different metal oxide surfaces. Atomic color coding in the structure: Ru, yellow; Cu, blue; Ce, gray; and O, pink. d Experimental and fitting EXAFS results of Ru-Cu/EDHJ and Ru-O/EDHJ. e WT analysis at the Ru K-edge of different samples. f PDOS analysis and molecular orbital diagrams of Ru 4d orbital of Ru-Cu/EDHJ and Ru-O/EDHJ. g Schematic diagram of the coordination environments and electronic states of Ru centers of Ru-Cu/EDHJ and Ru-O/EDHJ. Atomic color coding in the structure: Ru, yellow; Cu, blue; and O, pink. In (a, f), a.u. indicates the arbitrary units. Source data are provided as a Source Data file.
Fig. 4
Fig. 4. Experimental analysis and theoretical calculation on antioxidase-mimetic activities.
a Schematic diagram of the cascaded catalysis of SOD-like and CAT-like reactions. Atomic color coding in the structure: Ru, yellow; Cu, blue; O in Ru-Cu/EDHJ, pink; O in substrates, red; and H, white. b SOD-like activity of different materials (if not specifically stated, EDHJ group refers to CeO2@Cu2O; n = 3 independent experiments, data are presented as mean ± SD). c Time-dependent CAT-like performances via TiSO4-based method with the presence of biocatalysts and H2O2 (n = 3 independent experiments, data are presented as mean ± SD). d H2O2 elimination ratio of different materials (n = 3 independent experiments, data are presented as mean ± SD). e The produced O2 concentration was measured by an oxygen dissolving meter with the presence of biocatalysts and H2O2. f Vmax, Km, and TON values of Ru-Cu/EDHJ and Ru-O/EDHJ. g Comparative analysis of the Vmax and TON with previously reported biocatalysts. h CAT-like pathways (atomic color coding in the structure: Ru, yellow; Cu, blue; O in Ru-Cu/EDHJ, pink; O in substrates, red; and H, white) and (i) Gibbs free energy diagram of Ru-Cu/EDHJ and Ru-O/EDHJ. j Calculated-pCOHP of O 2p orbital and Ru 4d orbital in O2* and (k) corresponding ICOHP values of Ru-O bonds. l Schematic illustration of d orbital energy levels varies with coordination configurations. Vmax is the maximal reaction velocity, Km is the Michaelis constant, TON is the turnover number. In (b, d), statistical significance was calculated using a two-tailed Student’s t-test; all tests were two-sided. In (j), a.u. indicates the arbitrary units. Source data are provided as a Source Data file.
Fig. 5
Fig. 5. In vitro ROS clearance and stem cell protection by Ru-Cu/EDHJ.
a Fluorescence images, Ctrl (PBS), (b) flow cytometry, and (c) mean fluorescence intensity of DCFH-DA staining (n = 3 independent replicates), p(H2O2) < 0.0001, compared with Ctrl group; p(EDHJ-H2O2) = 0.0118, p(Ru-O/EDHJ-H2O2) = 0.0003, p(Ru-Cu/EDHJ-H2O2) < 0.0001, compared with H2O2 group. Scale bar: 100 μm. d Fluorescence images of 4-HNE (Green: F-actin, Red: 4-HNE, Blue: Dapi). Scale bar: 50 μm. e Quantitative analysis of mean fluorescence intensity of 4-HNE staining (n = 20 independent replicates), p(H2O2) = 0.0011, compared with Ctrl group; p(EDHJ-H2O2) = 0.0359, p(Ru-O/EDHJ-H2O2) = 0.0121, p(Ru-Cu/EDHJ-H2O2) =  0.0010, compared with H2O2 group. f Fluorescence images of paxillin (Green: F-actin, Red: paxillin, Blue: Dapi). Scale bar: 50 μm. g Quantitative analysis of the area of cells (n = 20 independent replicates), p(H2O2) < 0.0001, compared with Ctrl group; p(Ru-O/EDHJ-H2O2) = 0.0011, p(Ru-Cu/EDHJ-H2O2) < 0.0001, compared with H2O2 group. h Quantitative analysis of focal adhesion plaque of paxillin area (n = 3 independent replicates), p(H2O2) = 0.0144, compared with Ctrl group; p(Ru-Cu/EDHJ-H2O2) = 0.0050, compared with H2O2 group. i The dead cell ratio counted with the treatment of materials and H2O2 after live/dead staining (n = 5 independent replicates), p(H2O2) = 0.0001, compared with Ctrl group; p(Ru-O/EDHJ-H2O2) = 0.0003, p(Ru-Cu/EDHJ-H2O2) < 0.0001, compared with H2O2 group. j Schematic illustration of cell effects upon the addition of high-concentration H2O2 and Ru-Cu/EDHJ protection. Data are presented as means ± SD., *p < 0.05, **p < 0.01, ***p < 0.001, #p < 0.05, ##p < 0.01, ###p < 0.001, ns, no significance; statistical significance was calculated using one-way ANOVA followed by Tukey’s post-hoc test for multiple comparisons, all tests were two-sided. In (c, e, h), a.u. indicates the arbitrary units. Experiments were repeated independently (a, b, d, f) three times with similar results. Source data are provided as a Source Data file.
Fig. 6
Fig. 6. Prevention of ROS-related DNA damage and apoptosis in MSCs by Ru-Cu/EDHJ.
a Fluorescence images and (b) linear distribution of fluorescence intensity from DNA/RNA damage staining. Scale bar: 50 μm. c Fluorescence images, (d) spectrum images, and (e) quantitative analysis of fluorescence intensity from γ-H2A.X (n = 20 independent replicates), p(H2O2) < 0.0001, compared with Ctrl group; p(Ru-Cu/EDHJ-H2O2) < 0.0001, compared with H2O2 group. Scale bar: 50 μm. f Confocal scanning images from TUNEL. Scale bar: 50 μm. g Apoptosis analysis was performed using flow cytometry of Annexin V-FITC/PI stained hMSCs. h Quantitative fluorescence analysis from TUNEL (n = 30 independent replicates), p(H2O2) <0.0001, compared with Ctrl group; p(CeO2-H2O2) = 0.0052, p(Ru-Cu/EDHJ-H2O2) < 0.0001, compared with H2O2 group. i The cell percentages in stages of normal, early apoptosis, late apoptosis, and necrosis. j ALP staining after 3-day in vitro osteo-induction and AR staining after 21-day in vitro osteo-induction using the hMSCs. Quantitative analysis of (k) ALP (n = 3 independent replicates), p(H2O2) < 0.0001, compared with Ctrl group; p(Ru-Cu/EDHJ-H2O2) < 0.0001, compared with H2O2 group. Quantitative analysis of (l) AR (n = 3 independent replicates) in H2O2 treated hMSCs, p(H2O2) < 0.0001, compared with Ctrl group; p(Ru-Cu/EDHJ-H2O2) < 0.0001, compared with H2O2 group. m Schematic illustration of apoptosis and osteogenesis effects with Ru-Cu/EDHJ in high ROS-level microenvironment. Data are presented as means ± SD., *p < 0.05, **p < 0.01, ***p < 0.001, #p < 0.05, ##p < 0.01, ###p < 0.001, ns, no significance; statistical significance was calculated using one-way ANOVA followed by Tukey’s post-hoc test for multiple comparisons, all tests were two-sided. Experiments were repeated independently (a, c, d, f, g, j, l) three times with similar results. Source data are provided as a Source Data file.
Fig. 7
Fig. 7. RNA sequencing analysis of hMSCs in high ROS-level microenvironment.
a PCA analysis between samples. b Hierarchical clustering of differentially expressed genes from the hMSCs after different treatments. c Enriched KEGG pathways of H2O2 versus Ru-Cu/EDHJ + H2O2. d Enriched GO terms of H2O2 versus Ru-Cu/EDHJ + H2O2. e (e1e9) GSEA analysis of H2O2 versus Ru-Cu/EDHJ + H2O2. In (c, d), p-value obtained from one-sided Hypergeometric test without multiple comparisons. In (e), p-value obtained from one-sided Permutation test without multiple comparisons. In (e), NES indicates the normalized enrichment score. Experiments were repeated independently three times with similar results. Source data are provided as a Source Data file.
Fig. 8
Fig. 8. In vivo mandibular regeneration enhanced by Ru-Cu/EDHJ.
Fluorescence staining images of (a) TNF-α and (b) BMP2/4 at week 1 after treatments. Scale bar: 200 μm. c Schematic illustration of Ru-Cu/EDHJ for ROS scavenging and promoting bone formation. Quantitative results of fluorescence intensity of (d) TNF-α (n = 3 independent replicates), p(ROSup) = 0.0499, compared with Ctrl group; p(Ru-Cu/EDHJ-ROSup) = 0.0175, compared with ROSup group. Quantitative results of fluorescence intensity of (e) BMP2/4 (n = 3 independent replicates), p(ROSup) = 0.0202, compared with Ctrl group; p(Ru-Cu/EDHJ-ROSup) = 0.0004, compared with ROSup group. f 3D reconstruction of micro-CT images. Scale bar: 1 mm. New bone formation quantitative result of (g) BV/TV (n = 3 independent replicates), p(ROSup, 2w) = 0.0013, p(ROSup, 4w) = 0.0348, p(ROSup, 8w) = 0.0013, compared with Ctrl group; p(Ru-Cu/EDHJ-ROSup, 2w) < 0.0001, p(Ru-Cu/EDHJ-ROSup, 4w) < 0.0001, p(Ru-Cu/EDHJ-ROSup, 8w) < 0.0001, compared with ROSup group. New bone formation quantitative result of (h) bone mineral density (BMD) (n = 3 independent replicates), p(ROSup, 2w) = 0.0295, p(ROSup, 4w) = 0.0018, p(ROSup, 8w) = 0.0461, compared with Ctrl group; p(Ru-Cu/EDHJ-ROSup, 2w) = 0.0112, p(Ru-Cu/EDHJ-ROSup, 4w) < 0.0001, p(Ru-Cu/EDHJ-ROSup, 8w) = 0.0003, compared with ROSup group. New bone formation quantitative result of (i) Tb.N (n = 3 independent replicates), p(ROSup, 2w) = 0.0003, p(ROSup, 4w) < 0.0001, p(ROSup,8w) = 0.0435, compared with Ctrl group; p(Ru-Cu/EDHJ-ROSup, 2w) < 0.0001, p(Ru-Cu/EDHJ-ROSup, 4w) < 0.0001, p(Ru-Cu/EDHJ-ROSup, 8w) = 0.0115, compared with ROSup group. New bone formation quantitative result of (j) Tb.Th (n = 3 independent replicates), p(ROSup,2w) = 0.0206, p(ROSup,4w) = 0.0401, p(ROSup, 8w) < 0.0001, compared with Ctrl group; p(Ru-Cu/EDHJ-ROSup, 2w) < 0.0001, p(Ru-Cu/EDHJ-ROSup, 4w) = 0.0096, p(Ru-Cu/EDHJ-ROSup, 8w) < 0.0001, compared with ROSup group. Ctrl (mandible defects with PBS treatment). Data are presented as means ± SD., *p < 0.05, **p < 0.01, ***p < 0.001, #p < 0.05, ##p < 0.01, ###p < 0.001, ns, no significance; statistical significance was calculated using one-way ANOVA followed by Tukey’s post-hoc test for multiple comparisons, all tests were two-sided. Experiments were repeated independently (a, b, f) three times with similar results. Source data are provided as a Source Data file.
Fig. 9
Fig. 9. pH-controlled bioadaptive antibacterial action of Ru-Cu/EDHJ.
a POD-like activity of different biocatalysts (n = 3 independent replicates), p(Ru-O/EDHJ) <0.0001, p(Ru-Cu/EDHJ) <0.0001, compared with CeO2 group. b Tert-butanol (TBA) to quench •OH, benzoquinone (BQ) to quench •O2, and NaN3 to quench 1O2 during the biocatalytic process (n = 3 independent replicates). p(BQ) = 0.0011, p(NaN3) <0.0001, compared with Control group. c Schematic illustration of Ru-Cu/EDHJ converting H2O2 to ROS in acidic conditions but not in neutral environments. Fluorescence images from live/dead staining of (d) planktonic E. coli and S. aureus, and (e) E. coli and S. aureus biofilms. f The live/dead bacteria ratios of E. coli (n = 3 independent replicates, p(Ru-O/EDHJ-H2O2) < 0.0001, p(Ru-Cu/EDHJ-H2O2) < 0.0001, compared with bacteria in H2O2 group) and (g) S. aureus (n = 3 independent replicates, p(EDHJ-H2O2) = 0.0245, p(Ru-O/EDHJ-H2O2) < 0.0001, p(Ru-Cu/EDHJ-H2O2) < 0.0001, compared with bacteria in H2O2 group). h The live/dead bacteria ratios from E. coli biofilms (n = 3 independent replicates, p(CeO2-H2O2) = 0.0093, p(EDHJ-H2O2) = 0.0150, p(Ru-O/EDHJ-H2O2) < 0.0001, p(Ru-Cu/EDHJ-H2O2) < 0.0001, compared with bacteria in H2O2 group) and (i) S. aureus biofilms (n = 3 independent replicates, p(Ru-O/EDHJ-H2O2) < 0.0001, p(Ru-Cu/EDHJ-H2O2) < 0.0001, compared with bacteria in H2O2 group). j SEM images of E. coli and S. aureus after treatments. Blue: materials, purple: E. coli, yellow: S. aureus. k Quantitative analysis of the crystal violet-stained E. coli biofilms (n = 3 independent replicates, p(Ru-O/EDHJ-H2O2) = 0.0147, p(Ru-Cu/EDHJ-H2O2) < 0.0001, compared with H2O2 group) and (l) S. aureus biofilms (n = 3 independent replicates, p(EDHJ-H2O2) = 0.0483, p(Ru-O/EDHJ-H2O2) = 0.0009, p(Ru-Cu/EDHJ-H2O2) < 0.0001, compared with H2O2 group). m Schematic illustration of the pH-controlled antibacterial action of Ru-Cu/EDHJ in bone infections with added H2O2. Data are presented as means ± SD., *p < 0.05, **p < 0.01, ***p < 0.001, #p < 0.05, ##p < 0.01, ###p < 0.001, ns, no significance; statistical significance was calculated using one-way ANOVA followed by Tukey’s post-hoc test for multiple comparisons, all tests were two-sided. Experiments were repeated independently (d, e, j) three times with similar results. Source data are provided as a Source Data file.

Similar articles

Cited by

References

    1. Kang, H. W. et al. A 3D bioprinting system to produce human-scale tissue constructs with structural integrity. Nat. Biotechnol.34, 312–319 (2016). - PubMed
    1. Murphy, S. V., De Coppi, P. & Atala, A. Opportunities and challenges of translational 3D bioprinting. Nat. Biomed. Eng.4, 370–380 (2019). - PubMed
    1. Ge, J. et al. The combination of eddy thermal effect of biodegradable magnesium with immune checkpoint blockade shows enhanced efficacy against osteosarcoma. Bioact. Mater.25, 73–85 (2023). - PMC - PubMed
    1. Li, Y. F. et al. 3D printing titanium grid scaffold facilitates osteogenesis in mandibular segmental defects. npj. Regen. Med.8, 38 (2023). - PMC - PubMed
    1. Zhao, Z. Y. et al. Three-dimensional printed titanium mesh combined with iliac cancellous bone in the reconstruction of mandibular defects secondary to ameloblastoma resection. BMC Oral. Health23, 681 (2023). - PMC - PubMed

Publication types

Associated data

LinkOut - more resources