. 2024 Nov 6;15(1):9590.
doi: 10.1038/s41467-024-53453-5.

3D chromatin maps of a brown alga reveal U/V sex chromosome spatial organization

Affiliations

3D chromatin maps of a brown alga reveal U/V sex chromosome spatial organization

Pengfei Liu et al. Nat Commun. .

Abstract

Nuclear three dimensional (3D) folding of chromatin structure has been linked to gene expression regulation and correct developmental programs, but little is known about the 3D architecture of sex chromosomes within the nucleus, and how that impacts their role in sex determination. Here, we determine the sex-specific 3D organization of the model brown alga Ectocarpus chromosomes at 2 kb resolution, by mapping long-range chromosomal interactions using Hi-C coupled with Oxford Nanopore long reads. We report that Ectocarpus interphase chromatin exhibits a non-Rabl conformation, with strong contacts among telomeres and among centromeres, which feature centromere-specific LTR retrotransposons. The Ectocarpus chromosomes do not contain large local interactive domains that resemble TADs described in animals, but their 3D genome organization is largely shaped by post-translational modifications of histone proteins. We show that the sex determining region (SDR) within the U and V chromosomes are insulated and span the centromeres and we link sex-specific chromatin dynamics and gene expression levels to the 3D chromatin structure of the U and V chromosomes. Finally, we uncover the unique conformation of a large genomic region on chromosome 6 harboring an endogenous viral element, providing insights regarding the impact of a latent giant dsDNA virus on the host genome's 3D chromosomal folding.


Conflict of interest statement

The authors declare no competing interests.

Figures
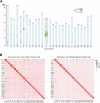
Fig. 1
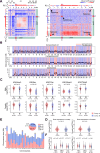
Fig. 1. Ectocarpus sp. 7 whole-genome assembly.
A Schematic representation of the near telomere-to-telomere assembly of the 27 Ectocarpus sp. 7 chromosomes, in haploid male (blue) and female (orange). Telomeres are represented as violet caps, sub-telomeres in brown. Centromeric regions are represented by the constrictions in the center of the chromosomes. The chromosomes are filled by variant density between the male and female haploid genomes used for the assembly (darker color means more differences). Violet dotted boxes represent the genomic region where a dsDNA virus is inserted, green dotted boxes represent the SDRs, and the red dotted box shows the rDNA array. Black arrowheads depict gaps. See methods for details. B Normalized genome-wide Hi-C contact map showing frequencies of pairwise 3D genome contacts at a 100 kb resolution in the male and female haploid genomes. The stripes seen in the contact map indicate regions of high contact frequency, corresponding to A/B compartments where regions within the same compartments interact more frequently with each other than with regions in other compartments. The dots scattered across the contact map represent specific loci that have higher contacts than the rest of the genome, often suggesting interactions between telomeres and centromeres or loops between these regions.
Fig. 2
Fig. 2. 3D chromatin architecture of Ectocarpus revealed by Hi-C data.
A Pair-wise averaged log-transformed observed/expected inter-chromosome contacts of Ectocarpus male at 10 k resolution. This scale represents the relative density of interactions between different chromosomes, with darker colors representing higher contact frequencies compared to what is expected by chance. B Analysis of aggregated intra- and inter-chromosomal contacts (Aggregate Chromosomal Analysis, ACA), where individual chromosomes are linearly transformed to have the same length, and the centromere is placed at the center. The adjusted chromosomes are subsequently used to compute average intra- and inter-chromosomal contacts. The analysis shows how centromeres and telomeres of these chromosomes interact both within themselves and with each other. T-T: telomere to telomere interactions; C-C: centromere to centromere interactions. C Global folding patterns of each of the male Ectocarpus chromosomes reflected by contact frequency as a function of genomic distance (Ps). D IDEs of each autosome and sex chromosome region in Ectocarpus male and female. Normalized Hi-C matrices at a resolution of 10 kb at a distance range of 10 kb to 500 kb were used to calculate IDEs.
Fig. 3
Fig. 3. High-resolution contact probability map reveals the higher-order organization of the Ectocarpus genome.
A Compartment A/B annotation based on principal component analysis. PC1 stands for the first principal component. The right panel shows inter-chromosomal contact patterns of A/B compartment regions between chromosomes 1 and 2. B Inter-chromosomal contacts of selected chromosome 1 regions with other chromosomes. The plots describe inter-chromosomal contacts belonging to the compartments A3 (top), B3 (middle), and centromere regions (bottom). The A/B compartment annotation of individual chromosomes is indicated with different colors. C Comparison of histone modifications, represented as log2(IP/H3) of regions enriched with selected histone marks. For each histone mark, the enriched regions are grouped according to the A/B compartments of Ectocarpus male and female. The mean value of log2(IP/H3) is represented by a red dot in each boxplot. Numbers in brackets represent the number of peaks of the corresponding histone ChIP-seq data. D Levels of gene expression in compartments (A) and (B) in males and females, represented as logs2(Transcripts Per Million + 1). p-values represent Wilcoxon tests. Numbers in brackets represent the number of genes. E Lengths of conserved and switching A/B compartment regions in male and female Ectocarpus genomes. “X - > Y” indicates compartment annotation in males (“X”) and females (“Y”). The pie chart indicates pooled data from all chromosomes. F Expression of sex-biased genes (SBG) in compartment A/B regions. MBG: male-biased gene; FBG: female-biased gene; Unb, unbiased gene. Numbers in brackets represent the number of genes. The lower and upper hinges of the box correspond to the first and third quartiles (the 25th and 75th percentiles). The upper whisker extends from the hinge to the largest and smallest values no further than 1.5x IQR from the hinge (Inter-Quartile Range, distance between the first and third quartiles). P-values represent a two-sample Wilcoxon rank sum test.
Fig. 4
Fig. 4. U and V sex chromosome 3D architecture.
A Plot showing gene density, GC content, and TE density in 100 kb windows and compartment A/B (PC1, red indicates positive values corresponding to compartment A, and blue indicates negative values corresponding to compartment B) in 10 kb windows across the Ectocarpus chromosomes. Chromosome 13 is the sex chromosome. B Hi-C map and simulated 3D configurations of sex chromosomes at 10 k resolution, employing a maximum likelihood approach, chromosomal structures were constructed from Hi-C data with a default setting of 3D Max. SDRs in the simulated male and female chromosomes are colored in blue and red, respectively, and telomeres are labeled with black triangles. In each panel, the black arrowhead indicates the centromere. The tracks above each Hi-C map show A/B compartment annotation (PC1), gene expression (RNA-seq), and various histone modification ChIP-seq.
Fig. 5
Fig. 5. Ectocarpus centromeres and centromere-specific retrotransposons.
A The centromeric regions of select chromosomes and the ECR retrotransposons. Putative centromeres and flanking regions for four chromosomes, including the U chromosome from the female genome assembly. The centromere (green box) is defined as the region from the first to the last copy of ECR elements. The repeats panel is shown as a stacked area plot, and the percentage of each repeat type is plotted in 5 kb windows. Coding sequence (CDS) density is plotted in 5 kb windows, and GC content is plotted in 100 bp windows. For all chromosomes, see Supplementary Fig. 9, and for genomic coordinates, see Supplementary Data 6. B Schematics of the ECR retrotransposons. The light blue boxes highlight the conserved region between ECR-1 and ECR-2, and a partial alignment of this region is shown (PPT = polypurine tract). Only 5’ and 3’ fragments of ECR-2 were recovered, and the dashed line represents a protein-coding sequence that is presumably missing. The domains shown on the ECR-1 protein are: PR = protease, RT = reverse transcriptase, RH = RNaseH, INT = integrase, CD = chromodomain. C Alignment of ECR-1 chromodomain and SMART chromodomain curated model (smart00298). Conserved amino acids are colored green, and the three aromatic amino acids that are responsible for the recognition of histone-methylated lysines are highlighted in yellow. D Histone mark signal (log2(IP/input)) in the putative centromeres and the surrounding regions (30 kb). Profiles of histone marks around the centromeres. The solid line represents the log2 of the ChIP-seq signal relative to the input, while the shading represents the 95% confidence interval (CI) of the center for the error bands. Heatmaps showing the chromatin state of each centromere using both uniquely and multi-mapped reads are shown in Supplementary Fig. 10.
Fig. 6
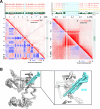
Fig. 6. Virus insertion region (EVE) is insulated and shows strong interactions with telomeres.
A Hi-C map of chromosome 6. The zoomed-in region to the right contains the EVE (4.2–4.6 Mb). The tracks above each Hi-C map show A/B compartment annotation (PC1), gene expression (RNA-seq), and histone PTMs ChIP-seq tracks. A blue shade marks the region of the Ec32EVE. B Simulated 3D configurations of chromosome 6 at 10 k resolution, generated using 3DMax. The EVE region is colored in aquamarine, and the telomeres are labeled with black triangles. To the right, the Ec32EVE region is zoomed in to highlight the long-range contacts with the telomeres.

References

    1. Bachtrog, D. et al. Are all sex chromosomes created equal? Trends Genet.27, 350–357 (2011). - PubMed
    1. Charlesworth, D. Plant Sex Chromosomes. Annu. Rev. Plant Biol.67, 397–420 (2016). - PubMed
    1. Abbott, J. K., Nordén, A. K. & Hansson, B. Sex chromosome evolution: historical insights and future perspectives. Proc. R. Soc. B Biol. Sci.284, 20162806 (2017). - PMC - PubMed
    1. Ponnikas, S., Sigeman, H., Abbott, J. K. & Hansson, B. Why do sex chromosomes stop recombining? Trends Genet.34, 492–503 (2018). - PubMed
    1. Umen, J. & Coelho, S. Algal sex determination and the evolution of anisogamy. Annu. Rev. Microbiol.73, 267–291 (2019). - PubMed

Publication types

Associated data

LinkOut - more resources