. 2024 Nov 6;15(1):9587.
doi: 10.1038/s41467-024-52472-6.

A PSA SNP associates with cellular function and clinical outcome in men with prostate cancer

Srilakshmi Srinivasan  1   2   3 Thomas Kryza #  4 Nathalie Bock #  1   2 Brian W C Tse  5 Kamil A Sokolowski  5 Panchadsaram Janaththani  1   2   6 Achala Fernando  1   2   3 Leire Moya  1   2 Carson Stephens  1   2 Ying Dong  1   2 Joan Röhl  1   7 Saeid Alinezhad  1   2 Ian Vela  1   8 Joanna L Perry-Keene  9 Katie Buzacott  9 Robert Nica  10 IMPACT StudyManuela Gago-Dominguez  11 PROFILE Study Steering CommitteeJohanna Schleutker  12   13 Christiane Maier  14 Kenneth Muir  15 Catherine M Tangen  16 Henrik Gronberg  17 Nora Pashayan  18   19 Demetrius Albanes  20 Alicja Wolk  21 Janet L Stanford  22   23 Sonja I Berndt  20 Lorelei A Mucci  24 Stella Koutros  20 Olivier Cussenot  25   26 Karina Dalsgaard Sorensen  27   28 Eli Marie Grindedal  29 Ruth C Travis  30 Christopher A Haiman  31 Robert J MacInnis  32   33 Ana Vega  34   35   36 Fredrik Wiklund  17 David E Neal  37   38   39 Manolis Kogevinas  40   41   42   43 Kathryn L Penney  44 Børge G Nordestgaard  45   46 Hermann Brenner  47   48   49 Esther M John  50 Marija Gamulin  51 Frank Claessens  52 Olle Melander  53 Anders Dahlin  53 Pär Stattin  21 Göran Hallmans  54 Christel Häggström  55 Robert Johansson  55 Elin Thysell  56 Ann-Charlotte Rönn  57 Weiqiang Li  58 Nigel Brown  59 Goce Dimeski  59 Benjamin Shepherd  60 Tokhir Dadaev  61 Mark N Brook  61 Amanda B Spurdle  62 Ulf-Håkan Stenman  63 Hannu Koistinen  63   64 Zsofia Kote-Jarai  61   65 Robert J Klein  58 Hans Lilja  66   67   68 Rupert C Ecker  1   2   10 Rosalind Eeles  61   65 Practical ConsortiumAustralian Prostate Cancer BioResourceJudith Clements  1   2 Jyotsna Batra  69   70   71
Collaborators, Affiliations

A PSA SNP associates with cellular function and clinical outcome in men with prostate cancer

Srilakshmi Srinivasan et al. Nat Commun. .

Abstract

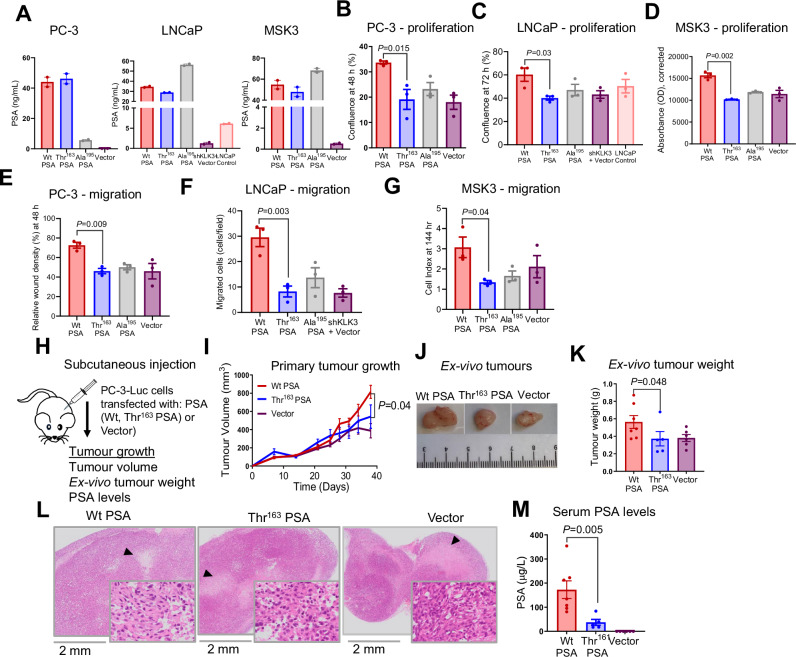
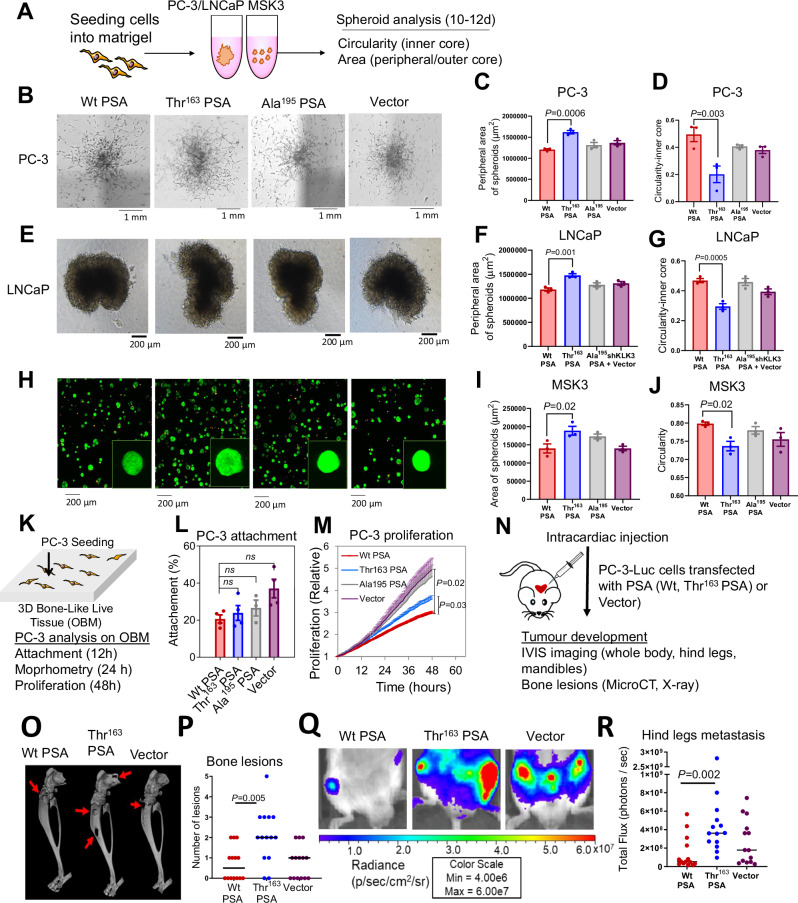
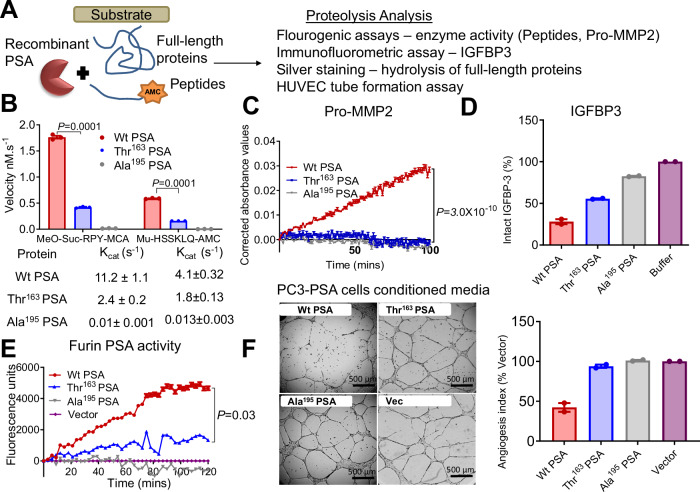
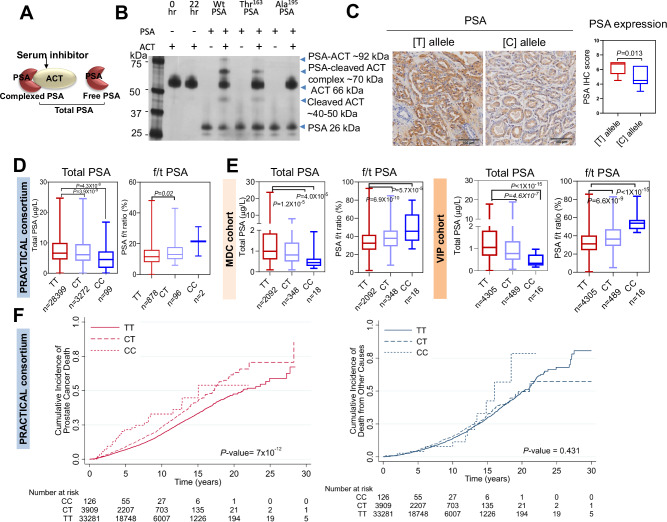
Genetic variation at the 19q13.3 KLK locus is linked with prostate cancer susceptibility in men. The non-synonymous KLK3 single nucleotide polymorphism (SNP), rs17632542 (c.536 T > C; Ile163Thr-substitution in PSA) is associated with reduced prostate cancer risk, however, the functional relevance is unknown. Here, we identify that the SNP variant-induced change in PSA biochemical activity mediates prostate cancer pathogenesis. The 'Thr' PSA variant leads to small subcutaneous tumours, supporting reduced prostate cancer risk. However, 'Thr' PSA also displays higher metastatic potential with pronounced osteolytic activity in an experimental metastasis in-vivo model. Biochemical characterisation of this PSA variant demonstrates markedly reduced proteolytic activity that correlates with differences in in-vivo tumour burden. The SNP is associated with increased risk for aggressive disease and prostate cancer-specific mortality in three independent cohorts, highlighting its critical function in mediating metastasis. Carriers of this SNP allele have reduced serum total PSA and a higher free/total PSA ratio that could contribute to late biopsy decisions and delay in diagnosis. Our results provide a molecular explanation for the prominent 19q13.3 KLK locus, rs17632542 SNP, association with a spectrum of prostate cancer clinical outcomes.


Conflict of interest statement

The patents mentioned herewith are not directly related to this study. H.L. is named on a patent for a statistical method to detect prostate cancer. The patent for the statistical model has been licensed and commercialised as the 4Kscore by OPKO Diagnostics. H.L. receives royalties from sales of this test and owns stock in OPKO. H.L. serves on SAB for Fujirebio Diagnostics. R.E. has the following conflicts of interest to declare: Honoraria from GU-ASCO, Janssen, University of Chicago, Dana Farber Cancer Institute USA as a speaker. Educational honorarium from Bayer and Ipsen, member of external expert committee to Astra Zeneca UK and Member of Active Surveillance Movember Committee. She is a member of the SAB of Our Future Health. She undertakes private practice as a sole trader at The Royal Marsden NHS Foundation Trust and 90 Sloane Street SW1X 9PQ and 280 Kings Road SW3 4NX, London, UK. All the other authors declare no conflict of interest.

Figures

Fig. 1
Fig. 1. Thr163 PSA abolishes the effect of PSA on PC-3, LNCaP and patient-derived organoid MSK3 cell proliferation and migration and is associated with reduced growth of primary tumours in-vivo.
PC-3, LNCaP and patient-derived organoid MSK3 cells were transfected with furin-activable Wt PSA, Thr163 PSA, Ala195 PSA or control plasmid (vector). A Expression of PSA from engineered PSA constructs quantified by immunoassay (n = 2 independent experiments). B, C Proliferation rate (confluence %) measured in the IncuCyte live cell imaging system for PC-3 and LNCaP cells expressing PSA variants and vector control at 72 h (n = 3 independent experiments). D Proliferation of MSK3-PSA and vector control cells, measured by PrestoBlue cell viability assay at 144 h (n = 3 independent experiments). E Cell migration rate (relative wound density %) measured by the IncuCyte live cell imaging system for PC-3 cells expressing PSA variants compared to vector control at 48 h (n = 3 independent experiments). F Cell migration of PSA variants expressing LNCaP cells loaded in Boyden chambers at 48 h (n = 3 independent experiments). G Cell migration measured using the xCELLigence system for the PSA variant expressing MSK3 cells as compared to vector control (n = 3 independent experiments). H Preclinical subcutaneous xenograft tumour model of PC-3-Luc cells transfected with furin-activable Wt PSA, Thr163 PSA or vector. I Mean volume of subcutaneous tumours throughout the experiment, based on caliper measurements (Wt: n = 7 mice, Thr163: n = 5 mice, Vec: n = 6 mice). J Representative photographs of resected subcutaneous tumours. K Scatter plot of post-mortem weight of subcutaneous tumours at day 38; horizontal line indicates mean value (Wt: n = 7 mice, Thr163: n = 5 mice, Vec: n = 6 mice). L H&E staining of resected subcutaneous tumours. M Serum concentration of total PSA at endpoint. All error bars represent mean ± SEM. Statistical analyses were determined by one-way ANOVA (B-G, I) or or two-sided Student’s t test (K, M). Source data are provided as a Source Data file.
Fig. 2
Fig. 2. Thr163 PSA increases cancer cell invasive ability and increases metastasis in-vivo.
A Schematic workflow of spheroid assay. B Representative brightfield microscope images (4× magnification) of 3D spheroids formed by transfected PC-3 cells after 10 days of culture. C Peripheral area (µm)2 of invading cells outside the outer core. Also see Supplementary Fig. 2A. D Measure of invasiveness of the spheroid from 0 to 1 (1 = circular, least invasive; <1 = less circular spheroids). E Representative brightfield microscope images (4×) of LNCaP spheroids after 10 days of culture, F Peripheral area (µm)2 and G circularity. H Representative fluorescent microscopy overlay images (10×) of transfected MSK3 cells at 10 days with a magnified view, stained with calcein-AM (live cells, green) and ethidium heterodimer (dead cells, orange) and spheroid, I Area (µm)2 and J circularity (n = 3 independent experiments for (BJ)). Also see Supplementary Fig. 2B, C. K Schematic of a 3D osteoblast-derived bone matrix (OBM) co-culture with PC-3 cells. L Attachment of PC-3-mKO2-PSA cells to OBM constructs after 12 h co-culture. M PC-3 proliferation on OBM constructs. Also see Supplementary Fig. 3A, B. For (L, M), n = 3 OBM groups from independent patient cells were made and included 2 technical replicates, 4–5 fields of view/replicate, for a total of 120–230 cells per condition. N Intracardiac injection of PC-3-Luc-PSA cells in mice (n = 7 mice/group). O Reconstructed 3D microCT images of tumour-bearing hind legs from representative mice of each group; red arrows showing areas of significant bone degradation, indicating presence of tumour. P Quantification of bone lesions per hind leg based on visual inspection of planar X-ray images; horizontal line indicates median value (n = 14 derived from two hind legs of 7 mice). Q Representative bioluminescence images of tumour-bearing hind legs of mice (week 4). R Scatter plots of tumour bioluminescence based on region of interest (ROI) drawn over individual hind legs (at week 4); horizontal line indicates median value (n = 14). Also see Supplementary Fig. 4. All error bars represent mean ± SEM; one-way ANOVA followed by Dunnett’s multiple comparisons test (C, D, F, G, I, J), Dunn’s multiple comparison test (L, P, R) or Games-Howell post hoc analysis (M). Source data are provided as a Source Data file.
Fig. 3
Fig. 3. Biochemical characterisation of the effect of the Thr163 variant on PSA activity.
A Schematic for PSA proteolytic activity analysis. B Rate of hydrolysis by mature PSA proteins (Wt PSA, Thr163 PSA, and catalytically inactive mutant control Ala195 PSA, all at 0.1 µM) were compared using the peptide substrates MeO-Suc-RPY-MCA (10 µM) and Mu-HSSKLQ-AMC (1 µM) over 4 h at 37 °C. Proteolytic activity derived from assaying a constant amount of PSA with increasing concentration (0–250 mM) for these two substrates were used to estimate Kcat values using nonlinear regression analysis in Graphpad Prism. (n = 3 independent experiments). Also see Supplementary Fig. 5B. C Time (mins) versus relative absorbance (OD) corrected to the substrate alone controls was plotted indicating the activity of pro-MMP2 (0.14 µM) when pre-incubated with PSA protein variants (Wt, Thr163 and Ala195 at 0.07 µM) and then the activity analysed with the chromogenic substrate (Ac-PLG-[2-mercapto-4-methyl-pentanoyl]-LG-OC2H5, 40 µM) for active MMP2 over 2 h. (n = 3 independent experiments). D Intact/total IGFBP-3 (2.2 µM) after 24 h incubation with PSA variants (0.25 µM) as shown relative to IGFBP-3 control without added PSA. Also see Supplementary Fig. 5C. (n = 2 independent experiments). E Fluorescent activity observed for the furin generated active PSA captured from serum free conditioned media of furin-PSA overexpressing PC-3 cells (Wt, Thr163, inactive mutant Ala195 and vector) using the peptide substrate MeO-Suc-RPY-MCA (n = 3 independent experiments). F Inhibition of HUVEC tube formation on Matrigel by treatment of HUVECs with serum free conditioned media from the PC-3 cells overexpressing (Wt, Thr163 and Ala195 PSA) and Vector control. Scale bar is 500 µm. The graph to the right represents the effect of these PSA protein variants on HUVEC tube formation expressed as an angiogenesis index, is shown in relation to the control (n = 2 independent experiments). This is complemented by the same assay using recombinant PSA. Also see Supplementary Fig. 5D. All error bars represent mean ± SEM. Statistical analyses were determined by two-sided Student’s t test (B) or one-way ANOVA followed by Dunn’s multiple comparison test (C, E). Source data are provided as a Source Data file.
Fig. 4
Fig. 4. rs17632442 SNP association with PSA levels and prostate cancer survival.
A PSA-inhibitor (ACT) complex, free and total PSA. B A representative silver stain analysis of recombinant wild type (Wt) and Thr163 and Ala195 PSA (0.1 µM) incubated with ACT (0.5 µM) at room temperature for 3 h before resolving on gel showed lower complexing potential of Thr163 PSA with ACT compared to the Wt PSA. Inactive mutant Ala195 does not complex with ACT (n = 3 independent experiments). C Representative immunohistochemical results for Gleason Grade 4 adenocarcinoma tissues, showing strong staining for PSA for the TT compared to the CC genotype. Graph on the right shows difference in PSA expression scores between [T] and [C] allele (CC: n = 2, CT: n = 10, TT: n = 10) for the immunohistochemical samples. The box plot centre line represents median, the boundaries represent interquartile range (IQR) and min and max are shown. D, E Genotype correlation of total PSA (tPSA) levels and f/t PSA ratio in prostate cancer cases (PRACTICAL consortium) and disease-free controls (MDC and VIP cohorts). D PRACTICAL consortium. n = 31,770; genotype status TT = 28,399, CT = 3272 and CC = 99 for tPSA levels comparison. n = 976; genotype status TT = 878, CT = 96 and CC = 2 for f/t PSA ratio comparison. E MDC cohort with genotype status TT = 2092, CT = 348 and CC = 18; and VIP cohort with genotype status TT = 4305, CT = 489 and CC = 16. For box plots (D, E), median, inter-quartile range (IQR), min and max are shown. F Survival analysis for the rs17632542 SNP (c.536 T > C) in 37,316 cases of PRACTICAL consortium with follow-up on cause specific death. Of these, 4629 died of prostate cancer, 3,456 died of other causes. Cases by carrier status, TT = 33,281, CT = 3909 and CC = 126. The cumulative incidence of death from prostate cancer, Hazards ratio (HR) = 1.33, 95% CI = 1.24–1.45, P < 0.001 (left panel) and all causes other than prostate cancer, HR = 1.08, 95% CI = 0.98–1.19, P = 0.431 (right panel) are indicated. Number at risk are also indicated. All error bars represent mean ± SEM. Statistical analyses were determined by two-sided Student’s t test (C) or one-way ANOVA followed by Dunn’s multiple comparison test (D, E). Source data are provided as a Source Data file.

Update of

  • Biochemical activity induced by a germline variation in KLK3 (PSA) associates with cellular function and clinical outcome in prostate cancer.
    Srinivasan S, Kryza T, Bock N, Tse BW, Sokolowski KA, Panchadsaram J, Moya L, Stephens C, Dong Y, Röhl J, Alinezhad S, Vela I, Perry-Keene JL, Buzacott K; IMPACT Study; Gago-Dominguez M; PROFILE Study Steering Committee; Schleutker J, Maier C, Muir K, Tangen CM, Gronberg H, Pashayan N, Albanes D, Wolk A, Stanford JL, Berndt SI, Mucci LA, Koutros S, Cussenot O, Sorensen KD, Grindedal EM, Key TJ, Haiman CA, Giles GG, Vega A, Wiklund F, Neal DE, Kogevinas M, Stampfer MJ, Nordestgaard BG, Brenner H, Gamulin M, Claessens F, Melander O, Dahlin A, Stattin P, Hallmans G, Häggström C, Johansson R, Thysell E, Rönn AC, Li W, Brown N, Dimeski G, Shepherd B, Dadaev T, Brook MN, Spurdle AB, Stenman UH, Koistinen H, Kote-Jarai Z, Klein RJ, Lilja H, Ecker RC, Eeles R; Practical Consortium; Australian Prostate Cancer BioResource; Clements J, Batra J. Srinivasan S, et al. Res Sq [Preprint]. 2023 Mar 28:rs.3.rs-2650312. doi: 10.21203/rs.3.rs-2650312/v1. Res Sq. 2023. Update in: Nat Commun. 2024 Nov 6;15(1):9587. doi: 10.1038/s41467-024-52472-6. PMID: 37034758 Free PMC article. Updated. Preprint.

References

    1. Carter, H. B. Prostate-Specific Antigen (PSA) Screening for Prostate Cancer: Revisiting the Evidence. JAMA319, 1866–1868 (2018). - PubMed
    1. de Vos, I. I. et al. A Detailed Evaluation of the Effect of Prostate-specific Antigen-based Screening on Morbidity and Mortality of Prostate Cancer: 21-year Follow-up Results of the Rotterdam Section of the European Randomised Study of Screening for Prostate Cancer. Eur. Urol.84, 426–434 (2023). - PubMed
    1. Martin, R. M. et al. Prostate-Specific Antigen Screening and 15-Year Prostate Cancer Mortality: A Secondary Analysis of the CAP Randomized Clinical Trial. JAMA 331, 1460–1470 (2024). - PMC - PubMed
    1. Kovac, E. et al. Association of Baseline Prostate-Specific Antigen Level With Long-term Diagnosis of Clinically Significant Prostate Cancer Among Patients Aged 55 to 60 Years A Secondary Analysis of a Cohort in the Prostate, Lung, Colorectal, and Ovarian (PLCO) Cancer Screening Trial. Jama Netw. Open3, e1919284 (2020). - PMC - PubMed
    1. Catalona, W. J. et al. Use of the percentage of free prostate-specific antigen to enhance differentiation of prostate cancer from benign prostatic disease: a prospective multicenter clinical trial. JAMA279, 1542–1547 (1998). - PubMed

Publication types