. 2024 Nov 6;15(1):9580.
doi: 10.1038/s41467-024-53858-2.

Constructing organoid-brain-computer interfaces for neurofunctional repair after brain injury

Affiliations

Constructing organoid-brain-computer interfaces for neurofunctional repair after brain injury

Nan Hu et al. Nat Commun. .

Abstract

The reconstruction of damaged neural circuits is critical for neurological repair after brain injury. Classical brain-computer interfaces (BCIs) allow direct communication between the brain and external controllers to compensate for lost functions. Importantly, there is increasing potential for generalized BCIs to input information into the brains to restore damage, but their effectiveness is limited when a large injured cavity is caused. Notably, it might be overcome by transplantation of brain organoids into the damaged region. Here, we construct innovative BCIs mediated by implantable organoids, coined as organoid-brain-computer interfaces (OBCIs). We assess the prolonged safety and feasibility of the OBCIs, and explore neuroregulatory strategies. OBCI stimulation promotes progressive differentiation of grafts and enhances structural-functional connections within organoids and the host brain, promising to repair the damaged brain via regenerating and regulating, potentially directing neurons to preselected targets and recovering functional neural networks in the future.


Conflict of interest statement

The authors declare no competing interests.

Figures
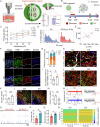
Fig. 1
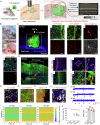
Fig. 1. The stimulated parameter was explored based on the organoid-electrode complex.
A Schematic illustrating the organoid-electrode complex (brain organoid and dual-shank flexible electrodes). The red squares represent the stimulated sites. The red dotted square on the right shows the details of electrode parameters. SVZ, subventricular zone; (B) Schematic illustration of the timeline of regulating, fixating, and recording; (C) The firing rate is a function of amplitude or frequency for all stimulation frequencies, n = 3 organoids; (D) Histogram plots of inter-spike intervals (ISIs) pre- and post-stimulus are shown from organoid in vitro; (E) σ is plotted as a function of µ across all channels for organoid pre- and post-stimulus; (F) Markers for laminar structure of organoids for SATB2 (blue), CTIP2 (red), TBR1(green) at D120 in the Ctrl and ES group. Scale bar: 50 μm; (G) The quantification of TBR1+, CTIP+, and SATB2+ cells at D120 in different groups, n = 6 organoids; (H) Immunostaining for SYN (red) and PSD95 (green) is displayed at D120. Scale bar: 10 μm; (I) Co-labeling number of SYN+ PSD95+ puncta are quantified, n = 7 organoids, *P < 0.05; (J) VGLUT1 and MAP2 are shown at D120. Scale bar: 30 μm; (K) Quantification of VGLUT1 puncta are shown, n = 5 organoids, **P < 0.01; (L) Immunostaining for astrocyte (GFAP, green) and NeuN (red) is shown at D120. Scale bar: 100 μm; (M) Quantitative data of the expression of GFAP, n = 6 organoids, **P < 0.01; (N) High-pass trace of a representative 3-second recording (left) and detected spike waveform (right) in the two groups at D120; (O) Raster plot in the ES (bottom) and Ctrl group (top) at D120; (P, Q) Quantification of firing rate and synchrony index in the ES and Ctrl group at D120, n = 4 organoids, *P < 0.05, **P < 0.01; (R) Spectrograms were derived from the entire electrodes in the ES and Ctrl group (left) at D120. Mean ± SD is shown for each condition. Statistical significance was tested with an unpaired two-tailed t-test for two-group comparisons. A, B was created with BioRender.com (BioRender.com/y26f932) released under a CC-BY 4.0 International license.
Fig. 2
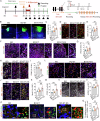
Fig. 2. Organoid brain-computer interface was constructed in vivo.
A Schematic illustration of the organoid-brain-computer interfaces (OBCIs) in vivo. The red squares represent the stimulated sites. M1, primary motor cortex; S1, primary sensory cortex; Fig. 2A (the third figure) was created with BioRender.com; (B) Brightfield micrographs of grafts and mice brains with or without electrode insertion; (C) Overview of the OBCIs at 60 dpt. The white dotted line marks the electrode trace. The grafted organoid is shown in green. Scale bar: 500 μm. (a-d) represents the position relative to the electrode, which displayed protein expression in different regions. (C-a) Immunostaining for microglia (red) and graft (green) are shown at 60 dpt. The red dotted line marks the electrode traces. Scale bar: 50 μm. (C-b) Homeostatic microglia (P2RY12). Scale bar: 10 μm. (C-c) The activated microglia are marked with iNOS (red). Scale bar: 50 μm. (C-d) Markers for astrocyte (GFAP) at 60 dpt. Scale bar: 50 μm; (D) Overview of the electrode insertions in mouse brain at 60 dpt. Scale bar: 500 μm. Markers for microglia (D-a), astrocytes (GFAP, D-b), endothelial cells (CD31, D-c), and MAP2/SYN (D-d) at 60 dpt in mice brains are shown. Scale bar: 100 μm in D-a, b, 50 μm in D-c, 30 μm (left) and 10 μm (right) in D-d; (E) Markers for human nuclei (HN, red) and CD31 (green) at 120 dpt. Scale bar: 50 μm; (FH) Immunostaining for MAP2 (F), DCX (G), and synapse (H) at 120 dpt in the grafts. Scale bar: 50 μm in F, 100 μm in G, 20 μm in H; (I) High-pass trace of electrophysiology in organoid in vivo at 30, 60, and 90 dpt. The red arrow indicates the identified spike; (J) Spectrograms derived from the entire electrodes in vivo at 30, 60, and 90 dpt; (K) The survival rate of grafted mice in the BO, BO-ET, and BO-ET-ES groups was calculated; (L) SNR analysis for the flexible electrodes at 60, 120, and 180 dpt, n = 9 (60, 120 180 dpt) mice, **P < 0.01. Mean ± SD is shown for each condition. Statistical significance was tested by One-way ANOVA with Tukey’s multiple comparison.
Fig. 3
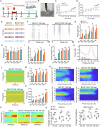
Fig. 3. Early-stage stimulation promoted the differentiation of organoid grafts via OBCIs.
A This schematic illustrates the timeline for organoid implantation (0 dpt), electrode insertion, 1 M stimulation, and recording signals. The right figure shows detailed parameters of electrical stimulation; (B) Coronal sections of mice brains demonstrate organoid growth in the BO, BO-ET, and BO-ET-ES group at 60 dpt. BO, organoid implantation; BO-ET, organoid and electrode implantation without regulation; BO-ET-ES, BO-ET with electrical stimulation. Scale bar: 500 μm; (C) The organoid volumes are quantified in different groups, n = 6 grafts, **P < 0.01; (D) The immunofluorescence staining for Ki67 (green) and human nuclei (HN, red) in three groups at 60 dpt. Scale bar: 50 μm; (E) Quantification of Ki67+ cells show an increase in BO-ET-ES, n = 6 grafts, **P < 0.01; (F) Immunofluorescence for HN and CD31 in different groups at 60 dpt. Scale bar: 100 μm (left) and 30 μm (right); (G)The vascular structures (CD31) are quantified, n = 6 grafts, **P < 0.01; (H, J) Neural progenitors and mature neurons are identified with PAX6 (H) and NeuN (J) at 120 dpt. Scale bar: 50 μm in H, and 100 μm in J. (I, K) The expression of PAX6+ and NeuN+ cells are quantified, n = 3 grafts, *P < 0.05, **P < 0.01; (L) Immunofluorescence staining for CTIP2 (L) and SATB2 (N) at 120 dpt. Scale bar: 50 μm in L, and 100 μm in N; (M, O) Quantification of the CTIP2+HN+ cells and SATB2+/GFP+ cells are shown, n = 3 grafts, **P < 0.01; (P) hSYN (red) and PSD95 (green) is displayed in the three groups at 180 dpt. Scale bar: 10 μm (left), and 3 μm (right); (Q) Quantification of the number of hSYN/PSD95 colocalized puncta at 180 dpt in the three groups, n = 3 grafts, *P < 0.05, **P < 0.01. Data are shown as mean ± SD, n = 8 images/6 mice in (C, E, G), n = 5 images/3 mice in (I, M, O, Q). n = 6 images/3 mice in (K). Statistical significance was tested by One-way ANOVA with Tukey’s multiple comparison for C, E, G, I, K, M, O, Q.
Fig. 4
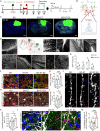
Fig. 4. Early-stage stimulation promoted functional maturation of organoids via OBCIs.
A This schematic illustrates the timeline for early-stage stimulation; (B) Images of behavioral tests; (C, D) Electrophysiology of stimulated organoids in vivo at intervals of the day; (C) firing rate and (D) energy of Gamma band for LFP, n = 6 mice, *P < 0.05 and **P < 0.01; (E) High-pass trace of a representative 3-second recording at 120 dpt; (F) Raster plot for 60 seconds at 120 dpt; (GJ) Electrophysiology of organoids in vivo after stimulation at 40, 60, 90, 120, and 180 dpt. (G) firing rate, (H) spike amplitude, (I) burst number per min, and (J) burst duration, n = 6 mice (40, 60, 90 and 120 dpt) and n = 3 mice (180 dpt), *P < 0.05 and **P < 0.01; (KL) Power spectral density and spectrogram from the entire recordings at 120 dpt. (K) Power spectral density and (L) Spectrogram; (M) Quantifying total power percentage of Gamma in vivo at 40, 60, 90, 120, and 180 dpt, n = 6 mice (40, 60, 90 and 120 dpt) and 3 (180 dpt), *P < 0.05 and **P < 0.01; (N) Intensity distribution of PAC at 60 and 120 dpt; (O) Theta-Gamma PAC quantifications of organoids in vivo after stimulation at 40, 60, 90, 120, and 180 dpt, n = 6 mice (40, 60, 90 and 120 dpt) and n = 3 mice (180 dpt), **P < 0.01; (P) Spectrograms derived from the entire electrodes in the Naïve, BO-ET-ES and BO-ET groups during withdrawal in the von Frey test at 180 dpt; (Q) Change of total power percentage of Gamma and high Gamma and Theta-Gamma coupling post withdrawal compared to baseline in the Naïve, BO-ET-ES and BO-ET groups in the von Frey test at 60, 120, and 180 dpt, n = 9 withdraws (60 dpt in Naïve), 10 withdraws (120 dpt in Naïve), 9 withdraws (180 dpt in Naïve), 10 withdraws (60 dpt in BO-ET), 9 withdraws (120 dpt in BO-ET), 9 withdraws (180 dpt in BO-ET), 10 withdraws (60 dpt in BO-ET-ES), 12 withdraws (120 dpt in BO-ET-ES) and 9 withdraws (180 dpt in BO-ET-ES) from 3 mice in each group, *P < 0.05 and **P < 0.01. Data is shown as Mean ± SD. Statistical significance was tested with Two-way ANOVA for C, GJ, O, and Q.
Fig. 5
Fig. 5. Late-stage stimulation promoted the structural integration between organoids and the host via OBCIs.
A This schematic illustrates the timeline for late-stage stimulation (60 dpt, left), and detailed parameter (right); (B) This schematic establishes the graft-host or host-graft synaptic structure; (C) Coronal sections of mice brains are shown at 120 dpt in the different groups. Scale bar: 500 μm; (D)(a-j) High magnification views of the transplanted organoid on a coronal section show a high density of GFP+ projections. (a) contralateral cortex; (b-c) ipsilateral cortex, adjacent graft; (d) ipsilateral corpus callosum; (e-f) contralateral cortex; (g) contralateral corpus callosum and hippocampus; (h) ipsilateral hippocampus; (i) contralateral ventral posterolateral thalamus nucleus (VPL); (j) ipsilateral VPL. Scale bar: 50 μm in (a), (c-e) and (g-h),10 μm in (b), 20 μm in (f, i, j); (E) The GFP+ projections are quantified in ipsilateral brain regions at 120 dpt in BO-ET and BO-ET-ES, n = 3 grafts; (F, H) Staining for MAP2/ VGLUT1 and MAP2/GAD65/67 in grafts at 120 dpt. Scale bar: 20 μm; (G, I) VGLUT1 and GAD65/67 density is quantified at 120 dpt in three groups, n = 3 grafts, *P < 0.05, **P < 0.01, ***P < 0.001; (J) Dendritic branches from BO, BO-ET, and BO-ET-ES grafts at 120 dpt are shown. The red triangle marks the dendritic spines. Scale bar: 5 μm; (K) Dendritic spine density is quantified at 120 dpt, n = 3 grafts, *P < 0.05; (L) Staining for hSYN (red), PSD95 (green), and GFP (white) at 120 dpt. The red arrow indicates the colocalization of hSYN and PSD95. Scale bar: 5 μm; (M) Quantification of the number of hSYN/PSD95 colocalized puncta at 120 dpt, n = 3 grafts, ***P < 0.001. Data are shown as mean ± SD, n = 5 images/3 mice in (G, I, K, M). Statistical significance was tested by One-way ANOVA with Tukey’s multiple comparison for G, I, K, M. The schematic illustrates in Fig. 5B (BioRender.com/d87u058) and 5D (BioRender.com/t24s318) were created with BioRender.com.
Fig. 6
Fig. 6. Late-stage stimulation promoted the functional integration between organoids and the host via OBCIs.
A This schematic illustrates the timeline for 2 M stimulation; (BE) Spiking quantifications of stimulated organoids in vivo at intervals of the day. (B) firing rate, (C) burst number, (D) burst duration, and (E) spike amplitude, n = 4 mice, *P < 0.05 and **P < 0.01; (F) Energy of frequency band at Gamma of stimulated organoids in vivo at intervals of the day, n = 4 mice, *P < 0.05 and **P < 0.01; (G) Power spectral density at 150 dpt; (HI) Correlation coefficient quantifications of organoids in vivo after stimulation at approximately monthly intervals initiating at day 60. (H) auto-correlation inside organoids, and (I) cross-correlation between organoids and host, n = 4 mice, *P < 0.05 and **P < 0.01; (J) Coefficient distribution of correlation at 60, 90, 120, and 150 dpt in the BO-ET-ES group; (K) The BO-ET-ES group has an intense distribution of PAC at 60, 90, 120, and 150 dpt; (LN) Change of total power percentage of Gamma and high Gamma, and Theta-amma coupling post withdrawal compared to baseline in the Naïve, BO-ET-ES and BO-ET groups in vivo at 120, and 150 dpt, n = 14 withdraws (Naïve), 17 withdraws (BO-ET) and 18 withdraws (BO-ET-ES) from 4 mice (120 dpt) and n = 20 withdraws (Naïve), 16 withdraws (BO-ET) and 18 withdraws (BO-ET-ES) from 3 mice (150 dpt), *P < 0.05 and **P < 0.01. Mean ± SD is shown for each condition. Statistical significance was tested with Two-way ANOVA for multiple comparisons in BF, I, and K.

References

    1. Hankey, G. J., Jamrozik, K., Broadhurst, R. J., Forbes, S. & Anderson, C. S. Long-term disability after first-ever stroke and related prognostic factors in the Perth Community Stroke Study, 1989–1990. Stroke33, 1034–1040 (2002). - PubMed
    1. Kempermann, G. et al. Human adult neurogenesis: evidence and remaining questions. Cell Stem Cell23, 25–30 (2018). - PMC - PubMed
    1. Wolpaw, J. R., Birbaumer, N., McFarland, D. J., Pfurtscheller, G. & Vaughan, T. M. Brain-computer interfaces for communication and control. Clin. Neurophysiol.113, 767–791 (2002). - PubMed
    1. Chaudhary, U., Birbaumer, N. & Ramos-Murguialday, A. Brain-computer interfaces for communication and rehabilitation. Nat. Rev. Neurol.12, 513–525 (2016). - PubMed
    1. Patel, S. R. & Lieber, C. M. Precision electronic medicine in the brain. Nat. Biotechnol.37, 1007–1012 (2019). - PMC - PubMed

Publication types

LinkOut - more resources