. 2024 Nov 6;15(1):9593.
doi: 10.1038/s41467-024-52334-1.

Phenotypic and genetic characteristics of retinal vascular parameters and their association with diseases

Affiliations

Phenotypic and genetic characteristics of retinal vascular parameters and their association with diseases

Sofía Ortín Vela et al. Nat Commun. .

Abstract

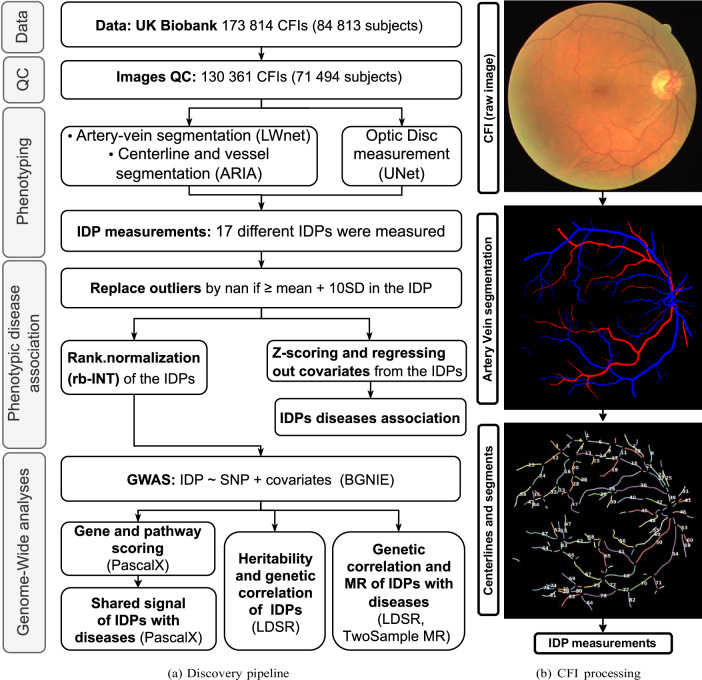
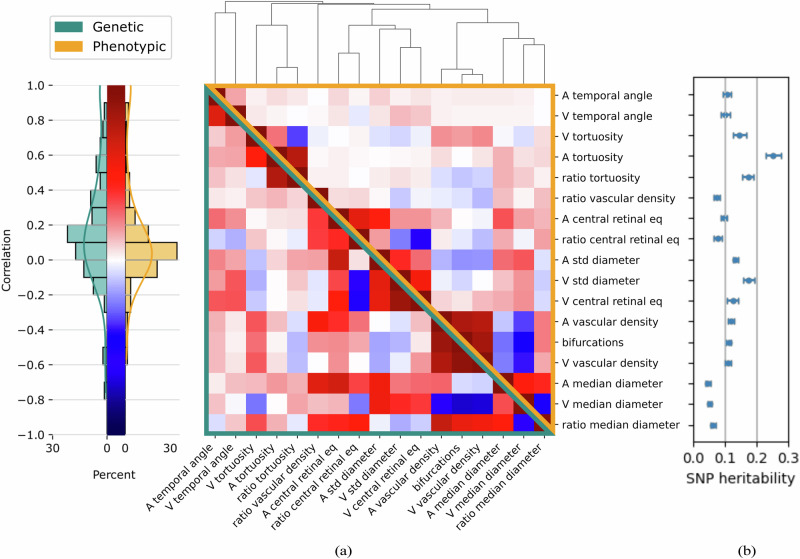
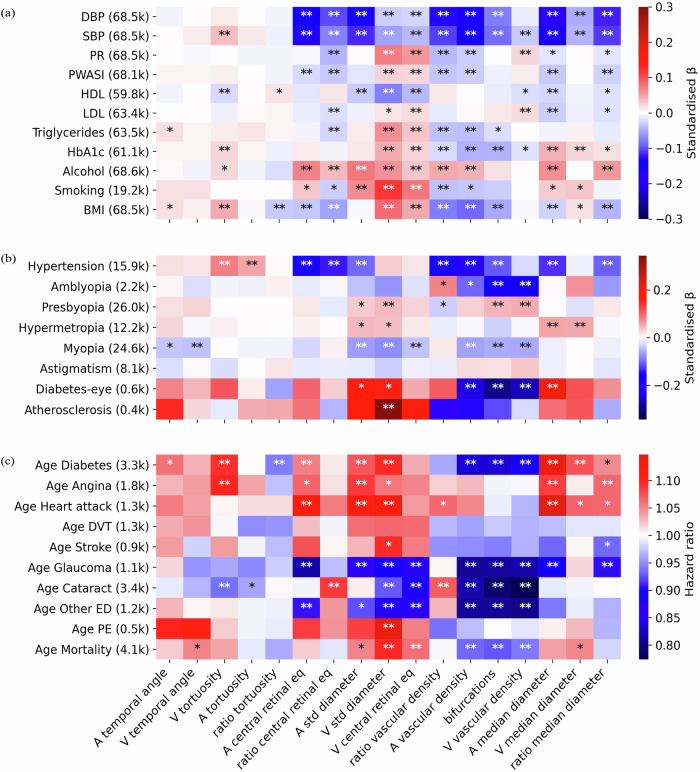
Fundus images allow for non-invasive assessment of the retinal vasculature whose features provide important information on health. Using a fully automated image processing pipeline, we extract 17 different morphological vascular phenotypes, including median vessels diameter, diameter variability, main temporal angles, vascular density, central retinal equivalents, the number of bifurcations, and tortuosity, from over 130,000 fundus images of close to 72,000 UK Biobank subjects. We perform genome-wide association studies of these phenotypes. From this, we estimate their heritabilities, ranging between 5 and 25%, and genetic cross-phenotype correlations, which mostly mirror the corresponding phenotypic correlations, but tend to be slightly larger. Projecting our genetic association signals onto genes and pathways reveals remarkably low overlap suggesting largely decoupled mechanisms modulating the different phenotypes. We find that diameter variability, especially for the veins, associates with diseases including heart attack, pulmonary embolism, and age of death. Mendelian Randomization analysis suggests a causal influence of blood pressure and body mass index on retinal vessel morphology, among other results. We validate key findings in two independent smaller cohorts. Our analyses provide evidence that large-scale analysis of image-derived vascular phenotypes has sufficient power for obtaining functional and causal insights into the processes modulating the retinal vasculature.


Conflict of interest statement

The authors declare no competing interests.

Figures

Fig. 1
Fig. 1. Discovery pipeline and measurement of retinal vascular image-derived phenotypes (IDPs).
a Overview of discovery pipeline. Subjects’ basic and medical information, genotypes, and CFIs were collected from the UKBB. Applying the Image QC method of removed 25% of all CFIs. Pixel-wise vessel segmentation and classification were performed using LWNET. ARIA was used to identify vessel segment objects. A DL network was used to measure the position of the OD. Based on this primary information our bespoke algorithms measured vascular IDPs. IDPs (z-scored and corrected for covariates) were associated with diseases through linear and logistic regressions, and Cox models. GWAS was performed on all IDPs after rank-based inverse normal transformation (rb-INT) and correction for covariates, and the resulting summary statistics were used to estimate heritabilities and genetic correlations, to identify relevant genes and pathways, and to study the genetic association and potential causal relationships between the IDPs and some of the disease phenotypes. b Overview of IDP measuring process. Top: original CFI from DRIVE dataset. Middle: Pixel-wise segmented vasculature with artery-vein classification using LWNET. Bottom: Vessel segment objects in terms of centrelines and diameters were identified using ARIA, providing the starting point for measuring vascular IDPs (see Supplementary Methods “Vesssel segmentation”, “Optic disc segmentation”, and “Phenotype extraction” for details).
Fig. 2
Fig. 2. Phenotypic and genetic correlations of retinal vascular IDPs and their heritabilities.
a Phenotypic (upper-right orange triangle) and genetic (lower-left green triangle) correlations between retinal vascular phenotypes, clustered by absolute phenotypic correlation distance, 1 |corr | . The 17 phenotypes are (A: artery, V: vein): main temporal angles (‘A/V temporal angle’), median tortuosities and their ratio (‘A/V tortuosity’ and ‘ratio tortuosity’), central retinal equivalents and their ratio (‘A/V central retinal eq’ and ‘ratio central retinal eq’), diameter variabilities (‘A/V std diameter’), vascular densities and their ratio (‘A/V vascular density’ and ‘ratio vascular density’), median diameters and their ratio (‘A/V median diameter’ and ‘ratio median diameter’), and the number of bifurcations (‘bifurcations’). Phenotypes were corrected for age, sex, eye geometry, batch effects, and ethnicity before phenotypic clustering and before GWAS (see Methods). b Corresponding phenotype SNP heritabilities, h2, and their standard error, estimated using LDSR. In LDSR, heritabilities are estimated as the OLS slope from regressing the mean Chi-squared statistics of SNPs onto their corresponding LD scores, while accounting for the sample size and the total number of SNPs. Sample sizes (phenotypic and genetic respectively): A temporal angle [55.3 k, 54.9 k], V temporal angle [57.9 k, 57.5 k], A tortuosity [68.6 k, 68.1 k], V tortuosity [68.5 k, 68.0k], Ratio tortuosity [68.5 k, 68.0 k], A central retinal eq [65.5 k, 65.0 k], V central retinal eq [65.8 k, 65.4 k], Ratio central retinal eq [64.9 k, 64.4 k], A std diameter [68.5 k, 68.0 k], V std diameter [68.5 k, 68.0 k], Bifurcations [68.2 k, 67.8 k], A vascular density [68.7 k, 68.2 k], V vascular density [68.7 k, 68.2 k], Ratio vascular density [68.4 k, 68.0 k], A median diameter [68.6 k, 68.1 k], V median diameter [68.5 k, 68.0 k], Ratio median diameter [68.5 k, 68.0 k].
Fig. 3
Fig. 3. Gene associations with vascular IDPs.
a Number of genes associated with the different IDPs. The diagonal shows the number of genes significantly associated with each IDP. The lower triangle shows the number of genes in the intersection between pairs of IDPs. b 30 genes most frequently associated with the IDPs. Dot sizes are inversely proportional to p-values. c Number of genes showing coherent (top right) or anti-coherent (bottom left) signal between pairs of IDPs. d 30 genes most frequently found in the cross-phenotype analysis. Dot colour represents pleiotropy, i.e. the number of phenotype pairs showing (anti-)coherent signal for a given gene. Dot sizes are inversely proportional to p-values. Obtained using PascalX gene and cross-scoring respectively PascalX, p-values are based on a two-sided Chi-square test and were corrected for multiple testing using the Bonferroni method (significance threshold set to 0.05/number of tested genes).
Fig. 4
Fig. 4. Phenotypic association of IDPs with risk factors and diseases.
The x-axis shows IDPs and the y-axis shows risk factors and diseases. The numbers in parentheses correspond to the number of subjects with this information for which we were able to measure at least one of the 17 IDPs, for continuous diseases. For binary disease states, it represents the number of subjects who were cases and had data for at least one of the 17 IDPs. Linear (a) and logistic (b) regressions were used for continuous and binary disease states, respectively. For age-of-death and other severe diseases with the age-of-onset information, Cox proportional hazards regression was performed (c). In all models, phenotypes were corrected for age, sex, eye geometry, batch effects, and ethnicity. The colour indicates standardized effect sizes for linear and logistic regressions or hazard ratios for Cox models. Asterisks indicate the level of statistical significance (p < 0.05/Ntests, ∗∗p < 0.001/Ntests, where Ntests = NIDP s × Ntraits, and Ntraits is the number of diseases or risk traits considered in each panel). Labels: PR Pulse rate, PWASI Pulse wave arterial stiffness index, HDL High-density lipoprotein, LDL Low-density lipoprotein, HbA1c Glycated haemoglobin, Alcohol Alcohol intake frequency, Smoking pack-years, BMI Body mass index, Diabetes-eye Diabetes related to the eye, DVT Deep vein thrombosis, Other ED: all types of severe eye diseases not included explicitly, PE Pulmonary embolism.
Fig. 5
Fig. 5. Genetic correlations and causal effect estimates between IDPs and risk factors.
a Genetic correlation between IDPs and risk factors, computed using LDSR. UKBB sample sizes are given in the ‘N GWAS’ column in Supplementary Table 2, and corresponding disease sample sizes are described on the Neale lab website (see Methods). The colour indicates the genetic correlation coefficient and the asterisks indicate the level of statistical significance (p < 0.05/Ntest, ∗∗p < 0.001/Ntest, being Ntest = NIDP s × NLinearDiseases). b Correlation between phenotypic and genetic correlations of IDPs with risk factors. c Causal effect estimates with risk factors as exposures and IDPs as outcomes. d Causal effect estimates with IDPs as exposures and risk factors as outcomes. The colour indicates the causal effect estimates based on the F statistic of the inverse variance-weighted MR method. The level of statistical significance is indicated with a single asterisk for nominal significance without correction for multiple testing (puncorrected < 0.05) and two asterisks for a FDR (∗∗pFDR < 0.05). Risk factor genetic sample sizes: DBP and SBP: 340 k; High BP: 360 k; PR: 340 k; Pulse wave ASI: 118 k; HDL cholesterol: 315 k; LDL direct: 344 k; Triglycerides: 344 k; HbA1c: 344 k; Alcohol intake frequency: 361 k; Smoking status: 360 k; BMI: 360 k. And, IDPs genetic sample sizes: A temporal angle: 55 k; V temporal angle: 58 k; A/V and ratio tortuosity: 68 k; A, V and ratio central retinal eq: 65 k; A/V std diameter and bifurcations: 68 k; A/V and ratio vascular density: 68 k; A/V and ratio median diameter: 68 k.
Fig. 6
Fig. 6. Number of genes shared between IDPs and risk factors.
a Gene-scoring plain intersection. Each cell shows the number of intersected genes in phenotype pairs. b, c Cross-phenotype coherence analysis showing the number of coherent (b) and anti-coherent (c) genes between phenotype pairs. Summary statistics for risk factors were obtained from http://www.nealelab.is/uk-biobank (see for risk factor sample sizes). Gene-level p-values were derived from two-sided Chi-square test statistics using PascalX and corrected for multiple testing with the Bonferroni method (significance threshold set to 0.05/number of tested genes). Risk factor genetic sample sizes: DBP and SBP: 340 k; High BP: 360 k; PR: 340 k; Pulse wave ASI: 118 k; HDL cholesterol: 315 k; LDL direct: 344 k; Triglycerides: 344 k; HbA1c: 344 k; Alcohol intake frequency: 361 k; Smoking status: 360 k; BMI: 360 k. And, IDPs genetic sample sizes: A temporal angle: 55 k; V temporal angle: 58 k; A/V and ratio tortuosity: 68 k; A, V and ratio central retinal eq: 65 k; A/V std diameter and bifurcations: 68 k; A/V and ratio vascular density: 68 k; A/V and ratio median diameter: 68 k. Retinal IDP sample sizes are listed in the ‘N GWAS’ column in Supplementary Table 2.
Fig. 7
Fig. 7. Phenotypic and genetic replication of IDPs.
UKBB sample sizes are given in Supplementary Table 2, RS sample size is 8 142, OphtalmoLaus sample size is 2 276. a Scatter plot of the phenotypic correlations between our 17 IDPs in the UKBB and in the replication cohorts, OphtalmoLaus (left) and RS (right). IDPs were corrected for age, sex, eye geometry, and ethnicity (see Methods). Correlations of correlations and their corresponding p-values are displayed. b Correlation of SNP heritabilities, using LDSR (see Methods for statistical test), between our 17 IDPs in the discovery (UKBB) and the replication cohort (RS). c Scatter plot of the genetic correlations, using LDSR (see ref. for statistical test), between our 17 IDPs in the discovery (UKBB) and the replication cohort (RS). Weighted-least square regression was used to determine trendline and the significance of the association. To distinguish between the different IDPs, the following colour and shape legend was utilized: ‘S’ denoted tortuosity, ‘*’ for standard deviations, ‘◁’ for temporal angles, the ‘’ for bifurcations, and ‘□’ for vascular density. While the red colour is used for arteries, blue for veins, and black for no specific vessel type. Genetic correlations are measured as the correlation of their effect sizes across genetic variants, accounting for linkage disequilibrium (LD) (see ref. ). d Correlation of effect sizes at the SNP level in the discovery (UKBB) and the replication cohort (RS), based on OLS of SNP genotype onto phenotype value. e Benjamini-Hochberg procedure on discovery lead SNPs from the UKBB using the RS. FDR = 0.05 in red, FDR = 0.5 in orange, and observed = expected line in black. The label “missing” indicates that these SNPs were not available in the replication cohort. P-values are based on OLS of SNP genotype onto phenotype values. f Benjamini-Hochberg procedure on genes discovered in the UKBB using the RS. The colour code is the same as in the previous subfigure. The complete figures can be found in Supplementary Note 7. P-values are based on PascalX’s two-sided Chi-square test statistic.

References

    1. Ikram, M. K., Ong, Y. T., Cheung, C. Y. & Wong, T. Y. Retinal vascular caliber measurements: clinical significance, current knowledge and future perspectives. Ophthalmologica229, 125–136 (2013). - PubMed
    1. Seidelmann, S. B. et al. Retinal vessel calibers in predicting long-term cardiovascular outcomes: the atherosclerosis risk in communities study. Circulation134, 1328–1338 (2016). - PMC - PubMed
    1. Kawasaki, R. et al. Retinal vessel diameters and risk of hypertension: the multiethnic study of atherosclerosis. J. Hypertens.27, 2386 (2009). - PMC - PubMed
    1. Ikram, M. K. et al. Retinal vessel diameters and cerebral small vessel disease: the Rotterdam scan study. Brain129, 182–188 (2006). - PubMed
    1. Allon, R. et al. Retinal microvascular signs as screening and prognostic factors for cardiac disease: a systematic review of current evidence. Am. J. Med.134, 36–47 (2021). - PubMed

Publication types

LinkOut - more resources