. 2024 Nov 6;15(11):796.
doi: 10.1038/s41419-024-07142-2.

KIF1A promotes neuroendocrine differentiation in prostate cancer by regulating the OGT-mediated O-GlcNAcylation

Affiliations

KIF1A promotes neuroendocrine differentiation in prostate cancer by regulating the OGT-mediated O-GlcNAcylation

Qianqian Zhou et al. Cell Death Dis. .

Abstract

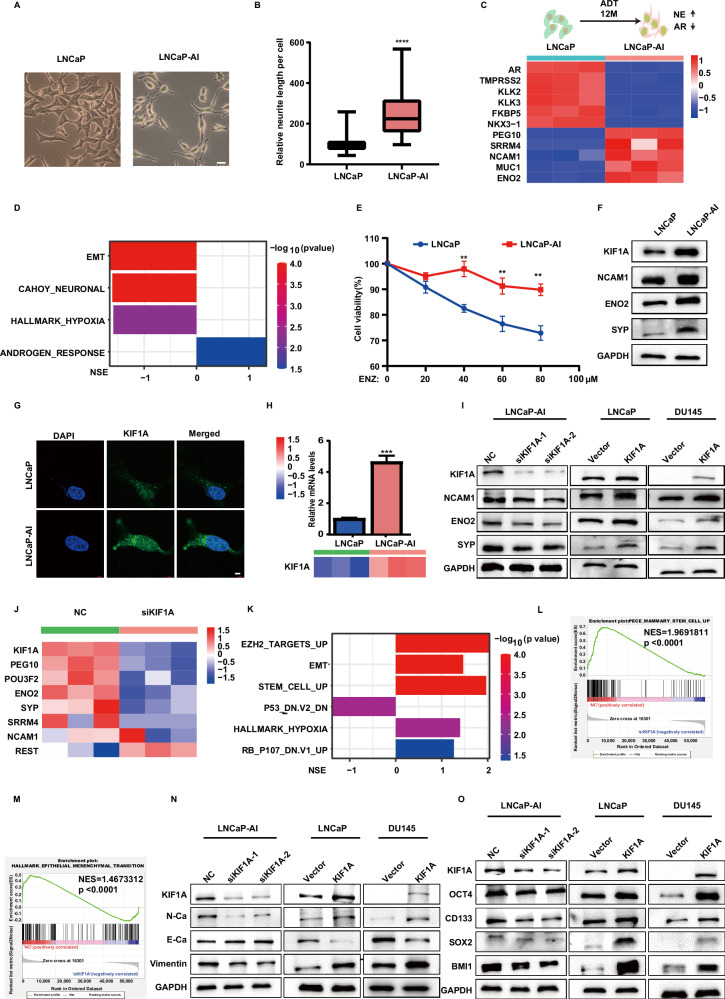
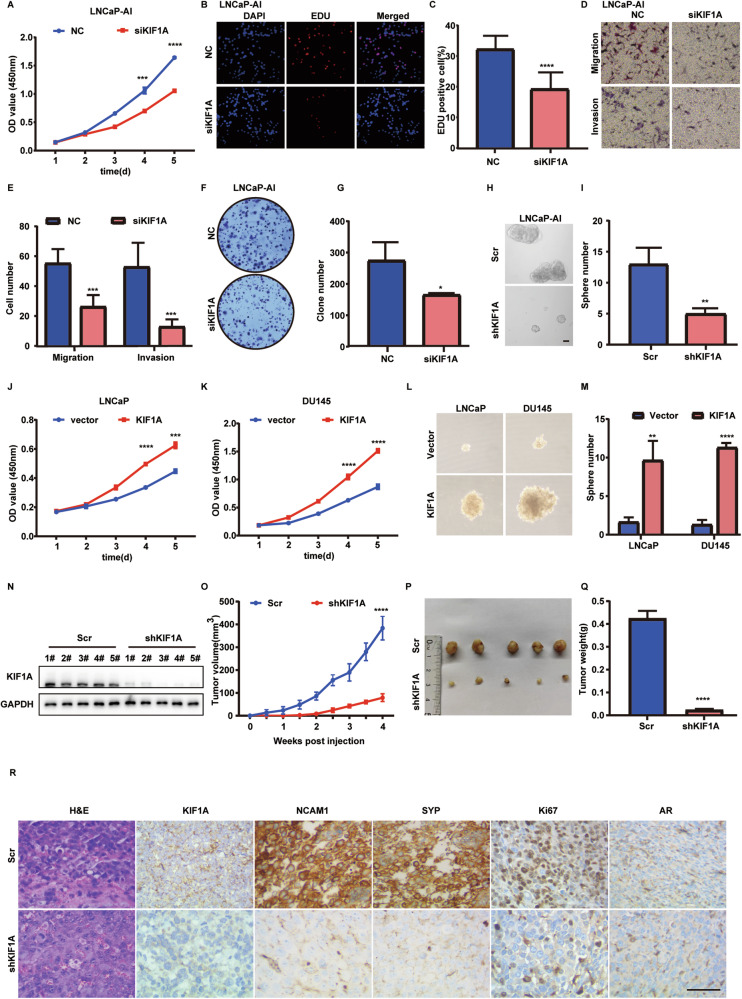
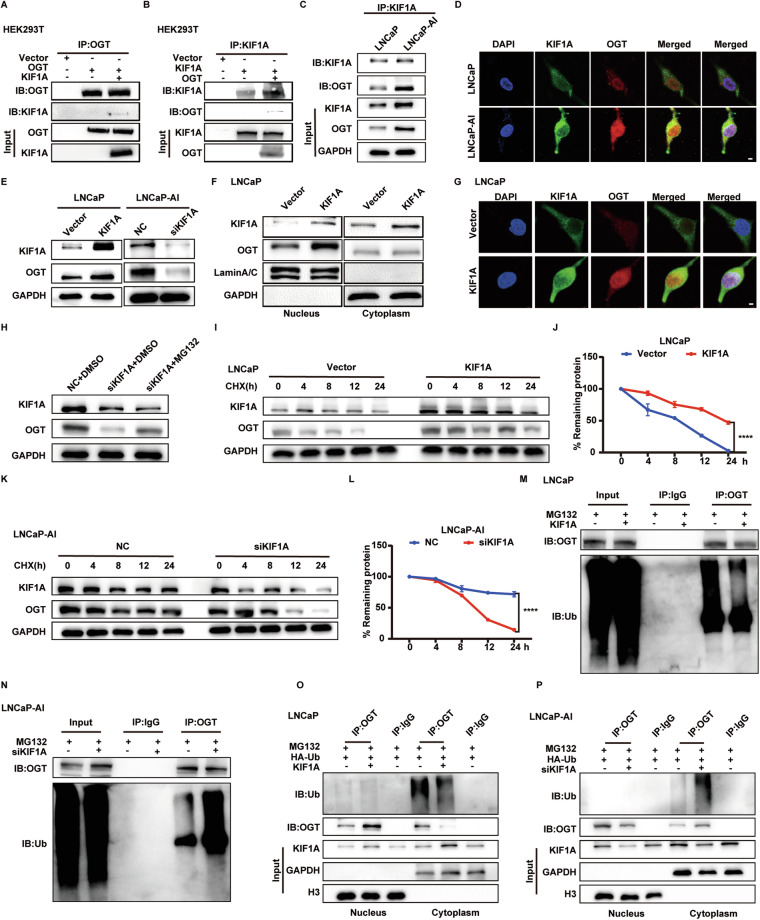
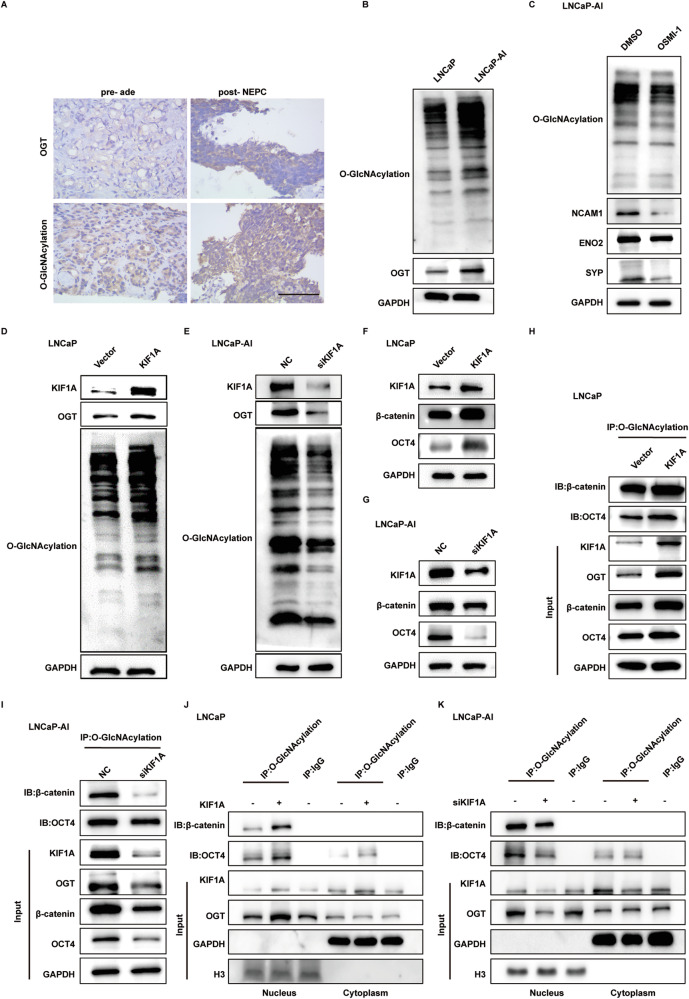
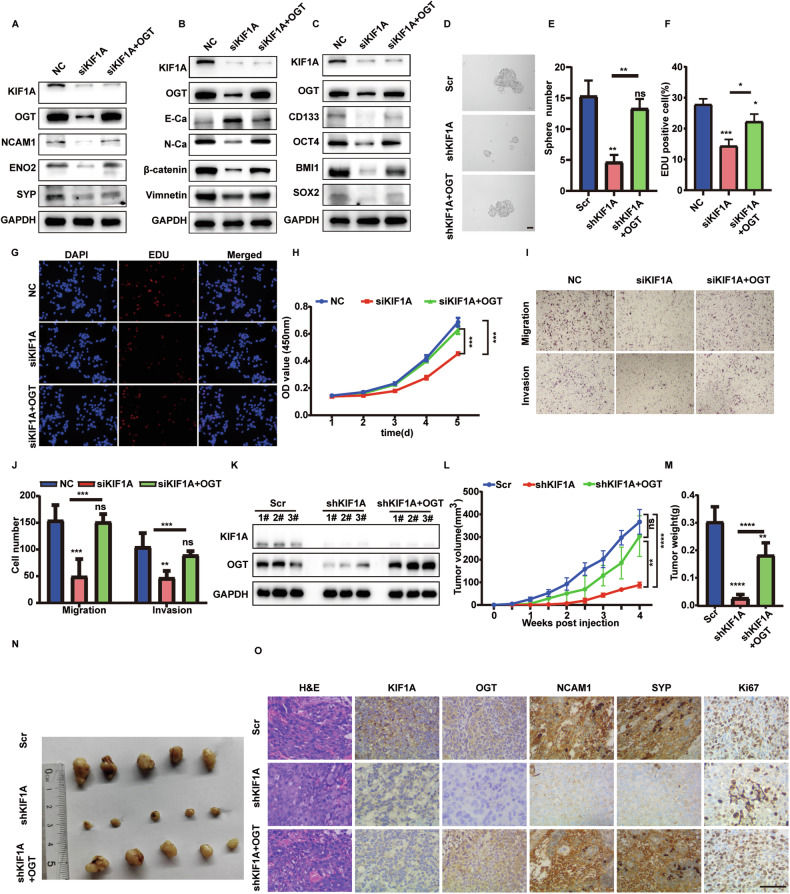
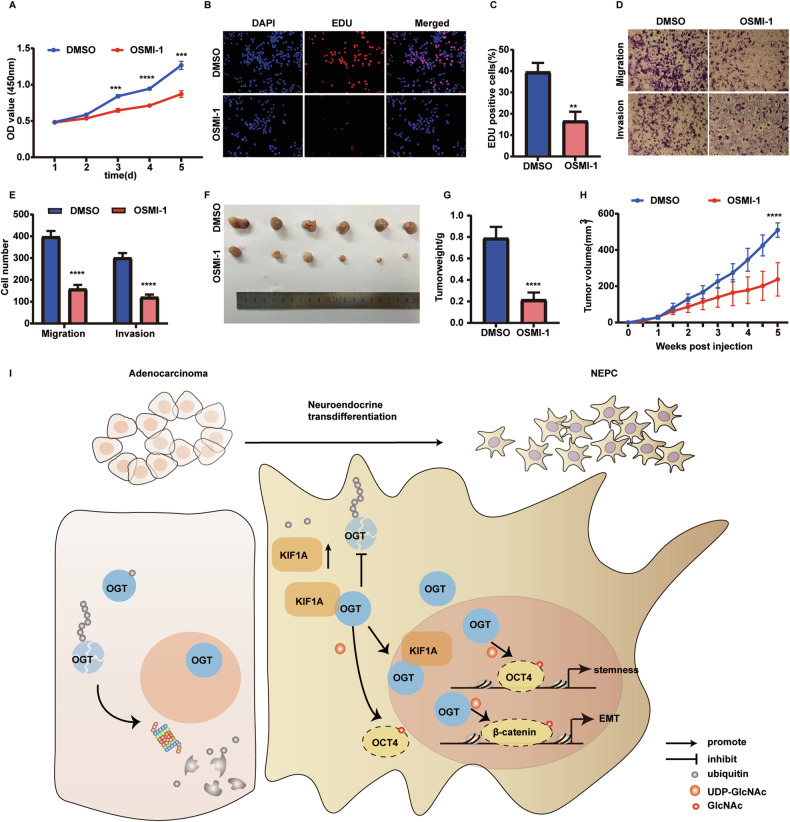
Neuroendocrine prostate cancer (NEPC) arises from prostate adenocarcinoma after endocrine treatment failure and implies lethality and limited therapeutic options. Deciphering the molecular mechanisms underlying transdifferentiation from adenocarcinoma to NEPC may provide valuable therapeutic strategies. We performed a pan-cancer differential mRNA abundance analysis and identified that Kinesin-like protein (KIF1A) was highly expressed in NEPC. KIF1A knockdown impaired neuroendocrine(NE) features, including NE marker gene expression, stemness, and epithelial-mesenchymal transition (EMT), whereas KIF1A overexpression promoted these processes. Targeting KIF1A inhibited the growth of NE differentiated prostate cancer (PCa) cells in vitro and in vivo. Mechanistically, KIF1A bound with O-linked N-acetylglucosamine transferase (OGT) and regulated its protein expression and activity. Nuclear accumulation of OGT induced by KIF1A overexpression promoted intranuclear O-GlcNAcylation of β-catenin and OCT4 in nucleus. More importantly, our data revealed that OGT was critical for KIF1A induced NE differentiation and aggressive tumor growth. An OGT inhibitor, OSMI-1, can significantly inhibited NE differentiated PCa cell proliferation in vitro and tumor growth in vivo. Our findings showed that KIF1A promotes NE differentiation to NEPC by regulating the OGT-mediated O-GlcNAcylation. Targeting O-GlcNAcylation may impede the development of NEPC for a group of PCa patients with elevated KIF1A expression.


Conflict of interest statement

The authors declare no competing interests.

Figures

Fig. 1
Fig. 1. KIF1A overexpression is associated with NE phenotype.
A A summary of dataset integration and the pipeline for putative driver gene selection. B, C Expression of KIF1A in NEPC patient samples compared with CRPC or Ade in GSE104786, Beltran 2016 dataset. D Expression of KIF1A in NEPC PDX models compared with CRPC. E Expressions of KIF1A, AR, and SYP during the transformation from Ade (LTL331) to NEPC (LTL331R) after castration in GSE59986 dataset. F Expressions of KIF1A in different GEMMs in GSE90891 dataset. G The expressions of KIF1A across different PCa cell lines in GSE118207 dataset. H KIF1A protein levels in LNCaP, C4-2B, DU145, 22RV1 or NCI-H660 cells. I Representative images showing immunohistochemistry staining for KIF1A in Ade and NEPC cases. J The Pearson’s r correlation coefficient between KIF1A and NEPC score in SU2C 2019 cohort. NEPC score was calculated as described previously [24]. K Heatmap showing expression of KIF1A, AR signal pathway and NE associated genes in GSE126078 dataset. L Heatmap showing expression of KIF1A and NE associated genes in Beltran 2016 cohort. M Circos plot displaying the interconnectivity among NE associated genes and KIF1A. The thickness and color of the strip indicated the correlation coefficient in Beltran 2016 cohort. All results were presented as the mean ± SD. ***p <0.001, ****p <0.0001, based on Student’s t test. PDX patient-derived xenograft, GEMM genetically engineered mouse model, Ade adenocarcinoma.
Fig. 2
Fig. 2. KIF1A overexpression induces NEPC phenotype.
A The morphology of cells was imaged by Zeiss light microscope, Scale bar = 20 μm. B Quantitative result of protrusions length in LNCaP or LNCaP-AI cell. C Heatmap of AR signaling and NE associated genes in LNCaP cells or LNCaP-AI cells. D Gene sets significantly enriched in LNCaP cells compared to LNCaP-AI cells. NES and p value were reported. E Cell viability measured in the indicated cell lines by CCK-8 assay. LNCaP and LNCaP-AI cells were treated with titrated doses of ENZ for 3 days. F NE markers and KIF1A protein levels in LNCaP or LNCaP-AI cell. G Representative images of immunofluorescence of KIF1A in LNCaP or LNCaP-AI cells. Cells were imaged by confocal microscopy. Scar bar = 5 μm. H The mRNA levels of KIF1A in LNCaP/LNCaP-AI cells. The mRNA was first measured by RNA-seq (lower panel) and then validated through qPCR (upper panel). I Western blot of NE markers (NCAM1, ENO2, SYP) and KIF1A in indicated PCa cells with KIF1A overexpression or knockdown. J Heatmap showing NE associated genes expression in indicated LNCaP-AI cells. siKIF1A-2 were utilized as siKIF1A. K Gene sets significantly enriched in high- KIF1A group (NC) compared to siKIF1A in LNCaP-AI cells. NES and pvalue were reported. L GSEA of the EMT hallmark genes in NC and siKIF1A LNCaP-AI cells. M GSEA of the stem cell up-regulated genes in NC and siKIF1A LNCaP-AI cells. N Western blot of KIF1A and EMT markers in indicated PCa cells with KIF1A overexpression or knockdown. O Western blot of KIF1A and stemness related genes in indicated PCa cells with KIF1A overexpression or knockdown. All results were presented as the mean ± SD. ****p <0.0001, based on Student’s t test. ADT androgen deprivation therapy, ENZ enzalutamide, NSE normalized enrichment score.
Fig. 3
Fig. 3. KIF1A is required for aggressive growth of NE transdifferentiated PCa cell in vitro and in vivo.
A Cell viability assessed by CCK-8 assay after transfection at different time points in LNCaP-AI cells. NC/siKIF1A: KIF1A was knockdown in LNCaP-AI cells by transfection of siRNA targeting KIF1A (siKIF1A) or a negative control (NC). B, C Representative images and quantitative results of EDU assay in indicated LNCaP-AI cells from three independent experiments. D, E Representative images and quantitative results of transwell migration and matrigel invasion assays in LNCaP-AI cells with KIF1A ablation from three independent experiments. F Colony formation assay of indicated LNCaP-AI cells. G Quantitative analysis of colony number from three independent experiments. H Sphere formation assay of LNCaP-AI cells. I Quantitative results of sphere formation assays in LNCaP-AI cells from three independent experiments. Indicated cells were dissociated to single cells under suspension culture conditions in the presence of 20 ng/ml EGF, 10 ng/ml bFGF, and 2% B27 supplement. Spheroids with diameter >75 μm were counted. Scale bar = 40 μm. Scr/shKIF1A: LNCaP-AI cells were transfected with shRNA targeting KIF1A (shKIF1A) or a negative control (Scr). J, K Cell viability assessed by CCK-8 assay after transfection at different time points in indicated PCa cells. L Sphere formation assay of LNCaP and DU145 cells. M Quantitative results of sphere formation assays in LNCaP and DU145 cells from three independent experiments. N, O Effect of KIF1A on tumorigenesis in vivo evaluated with xenografts model. LNCaP-AI cells with stable expression of Scr/shKIF1A subcutaneously injected into nude mice. Measurement of stable transfection efficiency (N), The growth curve (O), Representative images of xenograft tumors (P), Tumor weight (Q). R Representative images showing H&E staining and immunostaining for KIF1A, Ki67, SYP, NCAM1 and AR in LNCaP-AI xenograft tumors. Scale bar = 100 μM. All results were presented as the mean ± SD. of three independent experiments. *p <0.05, **p <0.01, ***p <0.001, ****p <0.0001, based on Student’s t test.
Fig. 4
Fig. 4. KIF1A binds to OGT and stabilizes OGT protein.
AC Co-IP assays of KIF1A and OGT in HEK293T and LNCaP-AI cells. D Representative images of immunofluorescence detection of KIF1A (green) and OGT (red) in LNCaP and LNCaP-AI cells. Cells were imaged by confocal microscopy. Scale bar = 5 μm. E Western blot of OGT and KIF1A in indicated PCa cells with overexpression/knockdown of KIF1A. F Nuclear/cytoplasmic expression of OGT and KIF1A in LNCaP cells with KIF1A overexpression. G Representative images of immunofluorescence detection of KIF1A (green) and OGT (red) in LNCaP cells with KIF1A overexpression. Cells were imaged by confocal microscopy. Scale bar = 5 μm. H Western blot of KIF1A and OGT in LNCaP-AI cells with knockdown of KIF1A. After 48 h of transfection, LNCaP-AI cells were treated with 20 μM MG132 or an equivalent dose of DMSO for 24 h. IL Protein half-life assays in indicated PCa cells with knockdown/ overexpression of KIF1A. After 48 h of transfection, cells were treated with 10 μg/mL CHX and collected at 0, 4, 8, 12 and 24 h. The protein levels of OGT were determined by Western blot and the densitometry of OGT was normalized by GAPDH of three independent experiments. M, N IP and Western blot of OGT ubiquitination in indicated PCa cells with knockdown/ overexpression of KIF1A. O, P IP and Western blot of OGT ubiquitination extracted from nucleus/cytoplasm in indicated PCa cells with knockdown/ overexpression of KIF1A. LNCaP/LNCaP-AI cells were treated with 20 μM MG132 for 24 h. ***p <0.001, based on Student’s t test.
Fig. 5
Fig. 5. KIF1A regulates activity of OGT to promote intranuclear O-GlcNAcylation of OCT4 and β-catenin.
A Representative images showing immunohistochemistry staining for O-GlcNAcylation and OGT in ade and NEPC. Scar bar = 100 μm. B Western blot of O-GlcNAcylation and OGT in LNCaP/LNCaP-AI cells. C O-GlcNAcylation and NE marker expression in LNCaP-AI cells measured by Western blot assays. LNCaP-AI cells were treated with 20 μM OSMI-1 or DMSO for 72 h. D, E Overall protein O-GlcNAcylation level in LNCaP/LNCaP-AI cells with KIF1A perturbation assessed by western blot assay. F, G Immunobloting analysis of indicated PCa cells showing changed in β-catenin and OCT4 protein level. H, I Detection of O-GlcNAcylated β-catenin and OCT4 protein in indicated PCa cells with overexpression or knockdown of KIF1A. J, K Subcellular detection of O-GlcNAcylated β-catenin and OCT4 in indicated PCa cells with overexpression/knockdown of KIF1A. ade, adenocarcinoma.
Fig. 6
Fig. 6. OGT is essential for KIF1A induced NE transdifferentiation and aggressive growth.
AC Western blot of indicated NE, EMT and stemness markers in LNCaP-AI cells upon KIF1A knockdown with or without OGT ectopic expression. D, E Representative image and quantification of sphere formation assay of indicated LNCaP-AI cells. LNCaP-AI cells stably transfected KIF1A shRNA with or without OGT ectopic expression were performed to sphere formation assays. Spheroids with diameter >75 μm were counted. Scale bars = 40 μm. F, G Representative images and quantification of EDU assay in indicated LNCaP-AI cells. H Cell viability assessed by CCK-8 assay at different time points in indicated LNCaP-AI cells. I, J Representative images and quantification of transwell migration and matrigel invasion assays in indicated LNCaP-AI cells. KM Effect of KIF1A-OGT axis on tumorigenesis in vivo evaluated with xenografts model. LNCaP-AI cells stably transfected Scr/ shKIF1A /shKIF1A + OGT subcutaneously injected into nude mice. Measurement of stable transfection efficiency (K), The growth curve (L), Tumor weight (M), Representative image of xenograft tumors (N). O Representative images showing H&E staining and immunostaining for KIF1A, OGT, Ki67, SYP, NCAM1 in LNCaP-AI xenograft tumors as described in KM. Scar bar = 100 μm. All results were presented as the mean ± SD. of three independent experiments. *p <0.05, **p <0.01, ***p <0.001, ****p <0.0001, based on Student’s t test.
Fig. 7
Fig. 7. OSMI-1 inhibits aggressive growth of NE transdifferentiated PCa cell in vitro and in vivo.
A Cell viability assessed by CCK-8 assay treated with 20 μM OSMI-1 or an equivalent dose of DMSO at different time points in LNCaP-AI cells. B, C Representative images and quantification of EDU assay in indicated LNCaP-AI cells with 20 μM OSMI-1 or an equivalent dose of DMSO for 72 h. D, E Representative images and quantification of transwell migration and matrigel invasion assays in indicated LNCaP-AI cells. FH Effect of OSMI-1 on tumorigenesis in vivo evaluated with xenografts model. LNCaP-AI cells were subcutaneously injected into nude mice and the nude mice were randomly divided into control (DMSO), OSMI-1 (1 mg/kg, intravenously) after 7 days. Each group was intravenously administered every other day for 4 weeks. Representative images of xenograft tumors(F), Tumor weight (G), The growth curve (H). I Proposed model for KIF1A in promoting development of NEPC. Increased KIF1A forms complex with OGT escaping ubiquitin-proteasome mediated degradation to enhance OGT stabilization and nucleus accumulation. Moreover, intranuclear OGT regulates OCT4 and β-catenin O-GlcNAcylation to promote EMT and stemness, ultimately facilitates NE transdifferentiation to NEPC induced by KIF1A.

References

    1. Davies AH, Beltran H, Zoubeidi A. Cellular plasticity and the neuroendocrine phenotype in prostate cancer. Nat Rev Urol. 2018;15:271–86. 10.1038/nrurol.2018.22. - PubMed
    1. Beltran H, Tagawa ST, Park K, MacDonald T, Milowsky MI, Mosquera JM, et al. Challenges in recognizing treatment-related neuroendocrine prostate cancer. J Clin Oncol. 2012;30:e386–9. 10.1200/JCO.2011.41.5166. - PubMed
    1. Aggarwal R, Huang J, Alumkal JJ, Zhang L, Feng FY, Thomas GV, et al. Clinical and genomic characterization of treatment-emergent small-cell neuroendocrine prostate cancer: a multi-institutional prospective study. J Clin Oncol. 2018;36:2492–503. 10.1200/JCO.2017.77.6880. - PMC - PubMed
    1. Ku SY, Rosario S, Wang Y, Mu P, Seshadri M, Goodrich ZW, et al. Rb1 and Trp53 cooperate to suppress prostate cancer lineage plasticity, metastasis, and antiandrogen resistance. Science. 2017;355:78–83. 10.1126/science.aah4199. - PMC - PubMed
    1. Mu P, Zhang Z, Benelli M, Karthaus WR, Hoover E, Chen CC, et al. SOX2 promotes lineage plasticity and antiandrogen resistance in TP53- and RB1-deficient prostate cancer. Science. 2017;355:84–8. 10.1126/science.aah4307. - PMC - PubMed

MeSH terms

LinkOut - more resources