. 2024 Nov 6;15(1):9582.
doi: 10.1038/s41467-024-53917-8.

Replication stress induces POLQ-mediated structural variant formation throughout common fragile sites after entry into mitosis

Affiliations

Replication stress induces POLQ-mediated structural variant formation throughout common fragile sites after entry into mitosis

Thomas E Wilson et al. Nat Commun. .

Abstract

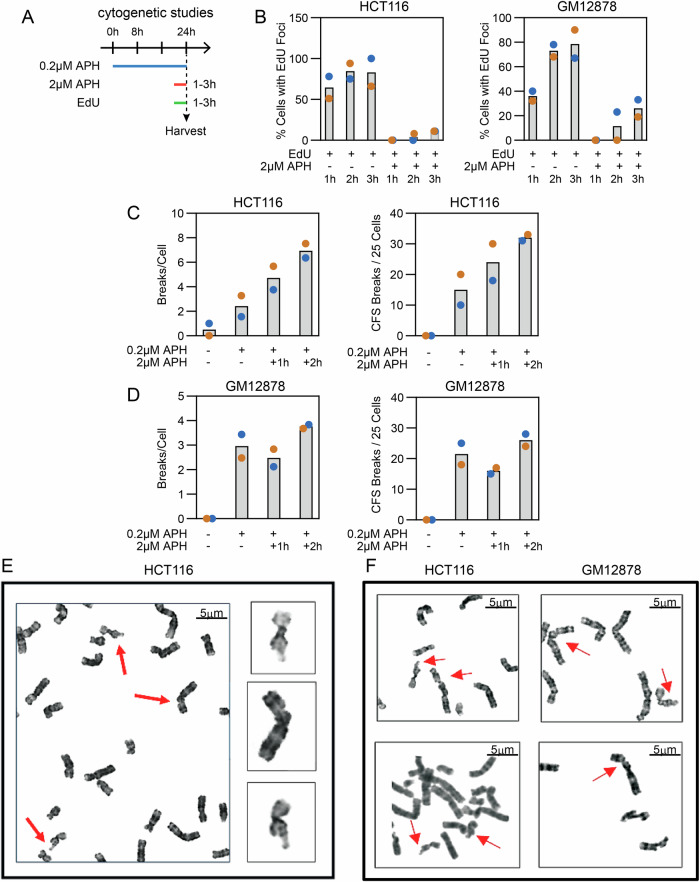
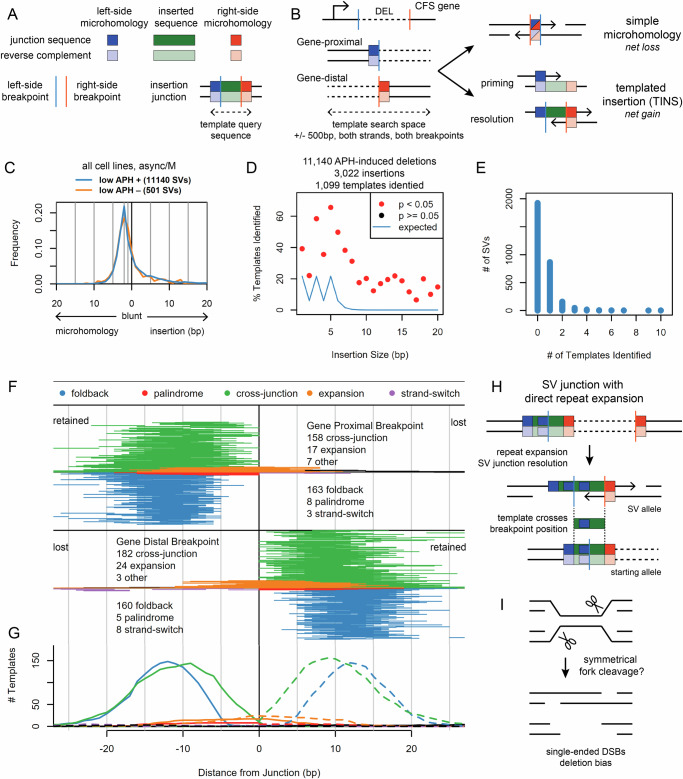
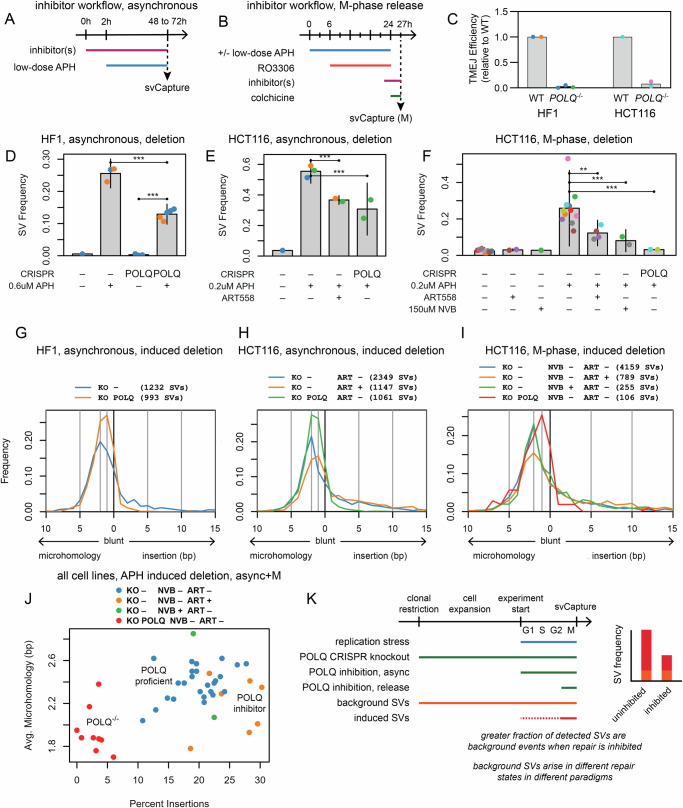
Genomic structural variants (SVs) greatly impact human health, but much is unknown about the mechanisms that generate the largest class of nonrecurrent alterations. Common fragile sites (CFSs) are unstable loci that provide a model for SV formation, especially large deletions, under replication stress. We study SV junction formation as it occurs in human cell lines by applying error-minimized capture sequencing to CFS DNA harvested after low-dose aphidicolin treatment. SV junctions form throughout CFS genes at a 5-fold higher rate after cells pass from G2 into M-phase. Neither SV formation nor CFS expression depend on mitotic DNA synthesis (MiDAS), an error-prone form of replication active at CFSs. Instead, analysis of tens of thousands of de novo SV junctions combined with DNA repair pathway inhibition reveal a primary role for DNA polymerase theta (POLQ)-mediated end-joining (TMEJ). We propose an important role for mitotic TMEJ in nonrecurrent SV formation genome wide.


Conflict of interest statement

The authors declare no competing interests.

Figures

Fig. 1
Fig. 1. APH-induced SV junctions arise throughout large CFS genes in asynchronous normal and cancer cell lines.
A svCapture sequencing was targeted near CFS gene centers to detect SV junctions with at least one breakpoint in a target region. B Timeline of asynchronous cell experiments, with SV induction by low-dose APH. C Example svCapture junction analysis from paired HF1 fibroblast samples shows the relationship between the sizes of SVs and their microhomologies, blunt ends, and insertions (see Methods). Each point is one intrachromosomal, single-molecule SV between 10 kb and 1.2 Mb. SVs are plotted in random order with a small amount of random noise added to the X-axis to aid in visualization of all data points. There are fewer control/blue points (n = 33) vs. APH-treated points (n = 222). D Induced SVs are strongly biased to deletions. APH doses are in µM. SV frequency is the observed junction count divided by the target region fold-coverage. HF1, UM-HF1; GM, GM12878; HCT, HCT116. Independent biological replicate (total SV) numbers by cell line/APH are: HF1/-, 2 (55); HF1/ + , 4 (2295); GM/-, 1 (64); GM/ + , 1 (338); HCT/-, 1 (73); HCT/ + ; 3 (3757). Error bars are mean +/− 2 SD of two or more replicates. E Induced deletion SV frequency. Each point aggregates all SVs from one independent biological replicate, e.g., from one set of colored junctions in panel C. Sample point colors denote shared experimental batches handled together. Replicate (SV) numbers by cell line/APH are: HF1/-, 2 (22); HF1/ + , 4 (2064); GM/-, 1 (42); GM/ + , 1 (313); HCT/-, 1 (51); HCT/ + ; 3 (3407). Error bars are mean +/− 2 SD of two or more replicates. Intergroup comparisons were made using a generalized linear regression model based on an over-dispersed Poisson, i.e., the negative binomial distribution, sampling SV junctions from sequenced haplotypes (see Methods). Throughout, two-tailed p-values of selected intergroup comparisons are marked as ns, not significant; *, p <= 0.01; **, p <= 0.001; ***, p <= 0.0001. HF1 p-value = 3.56e-63. F APH-induced deletion size distributions by cell line for the same data sources as in (E). Colored vertical lines are median SV sizes. G Distribution of APH-induced deletion breakpoints in HF1 cells for the same data sources as in (E), which extend beyond the capture targets (shaded) but less than the limits of the interrogation regions (plot width) or gene spans (vertical lines, transcribed left to right, arrow). Data are aggregated in 5 kb bins. H High net HF1 target region read coverage in 100 bp bins for the same data sources as in G, the normalization denominator for panel (I). Low-coverage bins reflect reduced capture probe density and/or sequencing efficiency. PRKG1 carried a clonal deletion in the HF1 cells under study at 51.595–51.645 Mb. I HF1 deletion breakpoint distributions in target regions for the same data sources as in G after normalizing to read coverage >=500, showing non-focal accumulation of SV junctions. Source data are provided as a Source Data file.
Fig. 2
Fig. 2. APH induces SV junction formation during mitosis but independently of MiDAS.
A, B Two synchronization paradigms used to harvest APH-treated cells in different, timed phases of the cell cycle, where G2 cells were harvested before and after release from RO3306 arrest, respectively. C Example flow sorting of HCT116 cells after release from RO3006. x-axis, DNA content; y-axis, pH3. Gated cell fractions in cell cycle stages G1, S, G2, and M are shown. D SV frequencies from synchronized HCT116 cells harvested in the indicated cell cycle phases, showing increased APH-induced SV yield when cells passed from G2 to M. Points aggregate sequenced SVs from one independent biological replicate. Point colors denote experimental batches. Error bars are mean +/− 2 SD of two or more replicates. Replicate (SV) numbers by release/cell cycle/APH are: -/G2/-, 6 (241); -/G2/ + , 6 (555); +/G2/-, 1 (54); +/G2/ + , 2 (263); +/M/-, 9 (492); +/M/ + , 12 (6286). P-values from two-sided negative binomial generalized linear model: -/G2/- vs. -/G2/ + , 7.80e-10; -/G2/+ vs. +/M/ + , 8.12e-21; +/G2/+ vs. +/M/ + , 3.40e-13; +/M/- vs. +/M/ + , 4.67e-67. *, p <= 0.01; **, p <= 0.001; ***, p <= 0.0001. E Timeline of experiments where cells in different cell cycle phases were flow sorted from asynchronous cultures. Colchicine improved M-phase cell yield and prevented re-entry into G1/S. F SV frequencies from HCT116 cells using the paradigm in E, with M-phase cells again showing higher SV yield. Plot elements and statistics are the same as D. Independent biological replicate (SV) numbers by cell cycle/APH are: S/-, 4 (145); S/ + 6 (1672); G2/− 2 (78); G2/ + 4 (546); M/− 2 (81); M/ + 4 (3680). P-values are: S/- vs. S/ + , 9.35e-89; G2/- vs. G2/ + , 9.93e-09; M/- vs. M/ + , 1.87e-22; G2/+ vs. M/ + , 1.88e-10. G Timeline of experiments where high-dose APH (2 µM) was added at release from RO3306 to inhibit MiDAS. EdU was added at RO3306 release only when visualizing MiDAS foci. H Example images of EdU foci scored in I and J, visualized in M-phase, showing singlet and doublet foci and the absence of foci with high-dose APH. Scale bar (white line): 5 µm. I Summary of EdU focus counts per metaphase from two independent biological experiments. Number of metaphase cells analyzed: no APH, 212; 0.2uM APH, 231; 0.2uM + 2uM APH, 200. J Comparison of EdU singlet and doublet focus yield between untreated and low-dose APH-treated cells over three independent biological experiments. Each point is one metaphase cell with at least one EdU focus, stratified by its singlet (x-axis) vs. doublet (y-axis) focus count. Number of EdU-positive metaphase cells/total metaphase cells analyzed: no APH, 29/364; 0.2uM APH, 184/317. K SV frequencies from HCT116 cells using the paradigm in G, with G2 cells harvested before RO3306 release, where suppression of MiDAS by high-dose APH in M had no impact on SV yield. Plot elements and statistics are the same as D. Independent biological replicate (SV) numbers by cell cycle/low APH/high APH are: G2/-/-, 6 (241); G2/ + /-, 6 (555); M/-/-, 9 (492); M/ + /-, 12 (6286); M/-/ + , 2 (86); M/ + / + , 2 (1239). P-values are: M/+/- vs. M/ + / + , 0.109. ns: not significant, p > 0.01. Source data are provided as a Source Data file.
Fig. 3
Fig. 3. APH-induced chromosome gaps and breaks and CFS expression do not depend on MiDAS.
A Timeline of experiments where high-dose APH (2 μM) and EdU were added at 1 h, 2 h, or 3 h prior to chromosome harvest to inhibit MiDAS and for visualizing MiDAS foci, respectively. B Comparison of EdU focus yield between untreated and high-dose APH-treated HCT116 and GM12878 cells. Gray bars are the mean of two independent biological replicates (orange and blue sample points). Number of HCT116 metaphase cells scored: 1 hr EdU 104 + 92; 2 hr EdU, 88 + 103; 3 hr EdU, 110 + 96; 1 hr EdU+2uMAPH, 109 + 100; 2 hr EdU+2uMAPH, 63 + 89; 3 hr EdU+2uM APH, 78 + 92. Number of GM12878 metaphase cells: 1 hr EdU, 59 + 102; 2 hr EdU, 59 + 88; 3 hr EdU, 41 + 92; 1 hr EdU+2uMAPH, 21 + 104; 2 hr EdU+2uMAPH, 29 + 83; 3 hr EdU+2uM APH, 21 + 77. C, D Total gaps and breaks (left) and CFS expression (right) in HCT116 and GM12878 cells, respectively, with and without high-dose APH to suppress MiDAS. Chromosome were analyzed in 25 metaphases from each of two biological replicates for each cell line. Gray bars, mean. E FRA3B and FRA116D CFS gaps/breaks (arrows) in a representative HCT116 cell treated with high-dose APH for 2 h from the set of experiments described in C. Scale bar (black line), 5 µm. F Additional examples of FRA3B and FRA16D CFS gaps/breaks (arrows) in HCT116 and GM12878 cells treated with high-dose APH for 2 h or 1 h, respectively, from the set of experiments described in (C) and (D). Scale bar (black line), 5 µm. Source data are provided as a Source Data file.
Fig. 4
Fig. 4. Junction analysis of >11 K de novo deletions implicates TMEJ repair of DSBs created by replication fork cleavage.
A Guide to drawing conventions used in this figure and models in supplemental figures. B SVs are oriented to transcription of the relevant CFS gene. Gene-proximal and gene-distal breakpoints can be paired via microhomologies that remove base pairs relative to the initial DSB ends, by blunt joints (not drawn), or by the insertion of novel bases, which might arise by template copying with sequential use of priming and resolving microhomologies. C Distribution of deletion junction microhomology and insertion sizes, i.e., breakpoint offsets, from all cell lines harvested asynchronously or in M-phase, stratified by APH induction. The microhomology peak is at 2 bp. Independent biological replicates (SVs) by APH: -, 14 (501); +, 23 (11140). D Yield of identified templates for the APH-induced samples and deletion SVs plotted in (C), stratified by insert size. 1099 of 3022 insertion-containing SVs analyzed had putative insertion templates identified. Smaller insertions were required to have more bases of flanking microhomology in candidate templates to maintain search specificity (see Methods), leading to the non-monotonic blue random expectation line. All insertion sizes showed significant enrichment of identified templates (p <= 0.05, red), as determined by a one-tailed assessment of the binomial distribution that asked whether the fraction of identified templates for that size exceeded the number expected based on random Poisson sampling of bases (see Methods). Exact p-values are provided in a Source Data file. E Number of templates identified for insertion SVs from the data sources in (D) within 500 bp of junction breakpoints. 2788 of 3022 (92%) of insertion SVs had zero or one template identified, establishing search specificity. F Pileup of identified insertion template locations for the data sources in (D). The plot is oriented like panel B with respect to the genomic DNA regions surrounding the two breakpoints, i.e., most templates were found in retained breakpoint segments. 738 templates are plotted in total. G Histogram of the bases contributing to insertion templates plotted in (F), emphasizing offset of foldback relative to cross-junction templates. Solid lines, left breakpoint; dashed lines, right breakpoint. Panels F and G share an X axis. H The recurrent structure of expansion-class insertions. See Supplementary Fig. 7 for models of how expansion might occur so that templates appear to cross into the deleted side of inferred breakpoint positions. I General model by which single-ended DSBs created at replication forks lead to SV formation mechanisms suggested by CFS SV junction analysis. Source data are provided as a Source Data file.
Fig. 5
Fig. 5. POLQ inhibition and knockdown reduce SV formation in mitosis.
A, B Modification of asynchronous and synchronization timelines, respectively, where DSB repair inhibitors were added prior to either APH addition or release into M-phase. C Loss of TMEJ in POLQ-/- HF1 and HCT116 cells as determined by joining of transfected oligonucleotides. Number of independent biological replicates: HF1 WT, 2; HF1 POLQ-/-, 3; HCT116 WT, 1; HCT116 POLQ-/-, 2. Sample point colors denote experimental batches. Gray bars, mean. D HF1 asynchronous deletion SV frequency with POLQ KO. Sample point colors denote experimental batches. Error bars are mean +/− 2 SD of two or more independent biological replicates. Replicate (total SV) numbers by CRISPR/APH are: -/-, 1 (12); -/+, 3 (1785); POLQ/-, 3 (20); POLQ/ + , 5 (1363). P-values from two-sided negative binomial generalized linear model: -/+ vs. POLQ/ + , 1.83e-47; POLQ/- vs. POLQ/ + , 4.90e-64. **, p <= 0.001; ***, p <= 0.0001. E HCT116 asynchronous deletion SV frequency with POLQ KO and inhibition by ART558. Plot labeling and statistics are the same as (D). Replicate (total SV) numbers by CRISPR/APH/ART558 are: -/-/-, 1 (51); -/+/-, 3 (3407); -/+/+, 2 (1799); POLQ/ + /-, 2 (1505). P-values are: -/+/- vs. -/+/+, 1.89e-49;-/+/- vs. POLQ/ + /-, 6.09e-05. F HCT116 M-phase deletion SV frequency with POLQ KO and inhibition by ART558 and novobiocin (NVB). Plot labeling and statistics are the same as D. Replicate (total SV) numbers by CRISPR/APH/ART558/NVB are: -/-/-/-, 8 (425); -/-/+/-, 2 (114); -/-/-/+, 1 (37); -/+/-/-, 11 (5975); -/+/+/-, 4 (1175); -/+/-/+, 2 (352); POLQ/ + /-/-, 2 (153). P-values are: -/+/-/- vs. -/+/+/-, 5.42e-04; -/+/-/- vs. -/+/-/+, 7.11e-10; -/+/-/- vs. POLQ/ + /-/-, 8.42e-28. GI APH-induced junction insertion/microhomology size distributions for the data sources in D to F, respectively. SV counts are shown above plots for all sample groups. J Summary of deletion junction property distributions for asynchronous plus M-phase samples. Each point is one biological replicate across all cell lines. The x-axis is the percent of deletion junctions in a sample that had 2 to 15 bp insertions, the y-axis is the average microhomology length of junctions without insertions. Numbers of replicates by CRISPR/NVB/ART558 are: -/-/-, 25; -/-/+, 7; -/+/-, 2; POLQ/-/-, 9. K Differences between repair \ression paradigms with respect to the SV junctions that are ultimately sequenced. The SV frequency plot is conceptual and does not represent actual data. Source data are provided as a Source Data file.
Fig. 6
Fig. 6. Cell-cycle dependent interplay between TMEJ and NHEJ in SV formation at CFSs.
A Deletion SV frequency in asynchronous, APH-induced HF1 cells as a function of POLQ knockout and NHEJ inhibition with Nu7441. Sample point colors denote experimental batches. Error bars are mean +/− 2 SD of two or more independent biological replicates. Replicate (total SV) numbers by CRISPR/Nu7441 are: -/-, 3 (1785); -/+, 2 (1343); POLQ/-, 5 (1363); POLQ/ + , 2 (524). P-values from two-sided negative binomial generalized linear model: -/- vs. -/+, 0.180; POLQ/- vs. POLQ/ + , 0.119. ns, not significant; **, p <= 0.001; ***, p <= 0.0001. B Deletion SV frequency in asynchronous, APH-induced HCT116 cells as a function of POLQ and LIG4 knockout, and inhibition of NHEJ with Nu7441 or TMEJ with ART558. Plot labeling and statistics are the same as A. Replicate (total SV) numbers by CRISPR/ART558/Nu7441 are: -/-/-, 3 (3407); -/-/+, 2 (2512); -/+/-, 2 (1799); -/+/+, 2 (848); POLQ/-/-, 2 (1505); POLQ/-/ + , 2 (668); LIG4/-/-, 2 (2322); LIG4/ + /-, 2 (116). P-values are: -/+/- vs. -/+/+, 5.59e-64; POLQ/-/- vs. POLQ/-/ + , 6.23e-08; LIG4/-/- vs. LIG4/ + /-, 8.89e-197. C Like A and B, now for HCT116 cells released into M-phase following RO3306 arrest. Plot labeling and statistics are the same as A. Replicate (total SV) numbers by CRISPR/ART558/Nu7441 are: -/-/-, 11 (5975); -/-/+, 2 (1473); -/+/-, 4 (1175); -/+/+, 2 (681); POLQ/-/-, 2 (153); POLQ/-/ + , 2 (148). P-values are: -/-/- vs. -/-/+, 0.376; -/+/- vs. -/+/+, 0.571. For clarity, panels A to C only show samples induced to form SVs with low-dose APH. Horizontal dashed lines indicate the cell-line-specific SV level consistently observed without APH addition. D Like Fig. 4C, showing no effect of NHEJ loss on junction microhomology and insertion profiles. Independent biological replicates (total SV) numbers by cell cycle/CRISPR/Nu7441 are: async(-)/-/-, 8 (4005); async(-)/-/+, 5 (2622); async(-)/LIG4/-, 2 (1603); M/-/-, 14 (6919); M/-/ + , 1 (1057). E Timeline for harvesting S-phase HCT116 cells from asynchronous cultures. F Deletion SV frequency in S-phase HCT116 cells as a function of POLQ and LIG4 knockout, and inhibition of NHEJ with Nu7441 or TMEJ with ART558. Plot labeling and statistics are the same as A. Replicate (total SV) numbers by APH/CRISPR/ART558/Nu7441 are: -/-/-/-, 4 (145); +/-/-/-, 6 (1672); +/LIG4/-/-, 4 (841); +/LIG4/ + /-, 4 (139); +/POLQ/-/-, 4 (565); +/POLQ/-/ + , 4 (205). P-values are: -/-/-/- vs. +/-/-/-, 9.35e-89; +/-/-/- vs. +/LIG4/-/-, 5.96e-02; +/-/-/- vs. +/POLQ/-/-, 1.67e-04; +/LIG4/-/- vs. +/LIG4/ + /-, 1.95e-14; +/POLQ/-/- vs. +/POLQ/-/ + , 3.89e-04. Source data are provided as a Source Data file.

References

    1. Laufer, V. A., Glover, T. W. & Wilson, T. E. Applications of advanced technologies for detecting genomic structural variation. Mutat. Res. Rev. Mutat. Res. 792, 108475 (2023). - PMC - PubMed
    1. Conrad, D. F. et al. Origins and functional impact of copy number variation in the human genome. Nature464, 704–712 (2010). - PMC - PubMed
    1. Mills, R. E. et al. Mapping copy number variation by population-scale genome sequencing. Nature470, 59–65 (2011). - PMC - PubMed
    1. Conover, H. N. & Argueso, J. L. Contrasting mechanisms of de novo copy number mutagenesis suggest the existence of different classes of environmental copy number mutagens. Environ. Mol. Mutagen57, 3–9 (2016). - PubMed
    1. Povirk, L. F. Biochemical mechanisms of chromosomal translocations resulting from DNA double-strand breaks. DNA Repair (Amst.)5, 1199–1212 (2006). - PubMed

Publication types

LinkOut - more resources