

Predicting synthetic mRNA stability using massively parallel kinetic measurements, biophysical modeling, and machine learning
- PMID: 39505899
- PMCID: PMC11541907
- DOI: 10.1038/s41467-024-54059-7
Predicting synthetic mRNA stability using massively parallel kinetic measurements, biophysical modeling, and machine learning
Abstract
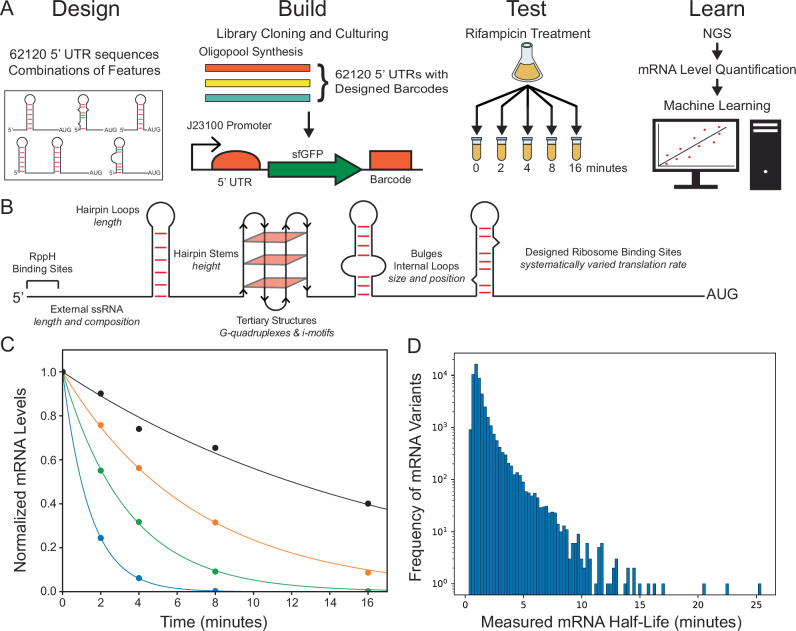
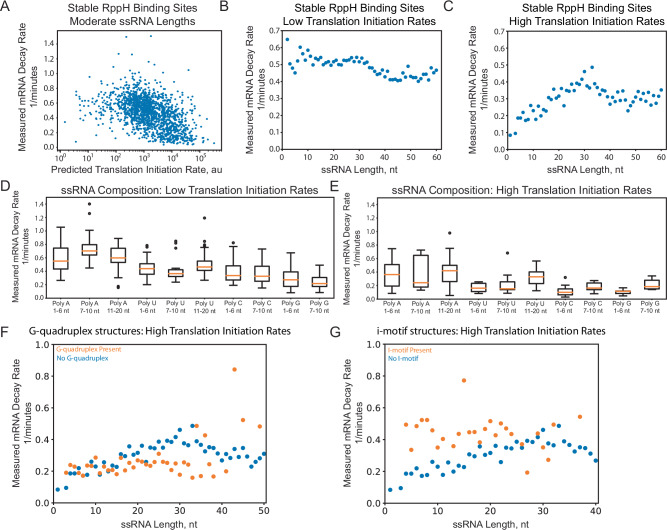
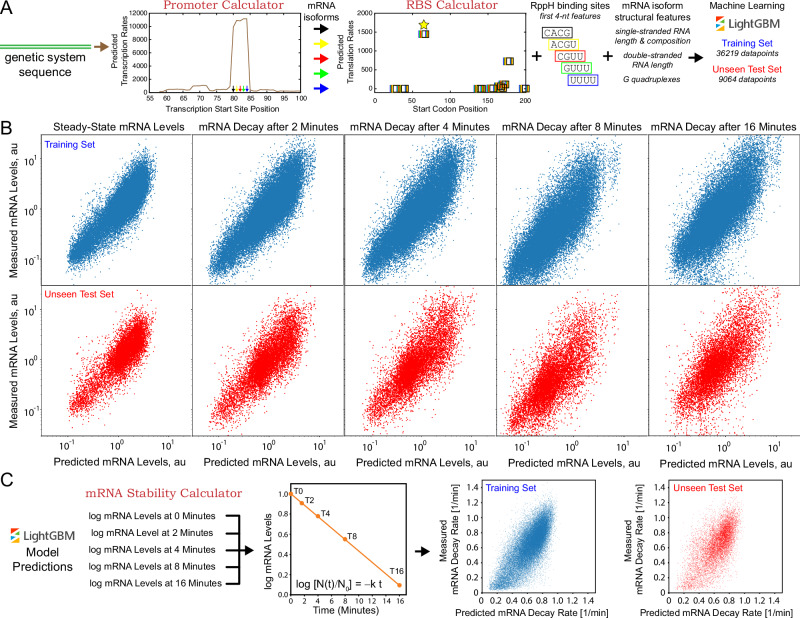
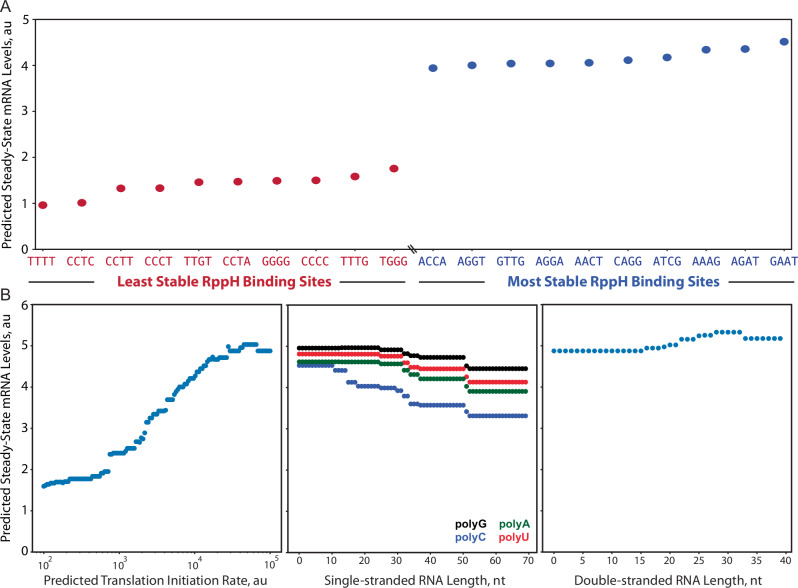
mRNA degradation is a central process that affects all gene expression levels, though it remains challenging to predict the stability of a mRNA from its sequence, due to the many coupled interactions that control degradation rate. Here, we carried out massively parallel kinetic decay measurements on over 50,000 bacterial mRNAs, using a learn-by-design approach to develop and validate a predictive sequence-to-function model of mRNA stability. mRNAs were designed to systematically vary translation rates, secondary structures, sequence compositions, G-quadruplexes, i-motifs, and RppH activity, resulting in mRNA half-lives from about 20 seconds to 20 minutes. We combined biophysical models and machine learning to develop steady-state and kinetic decay models of mRNA stability with high accuracy and generalizability, utilizing transcription rate models to identify mRNA isoforms and translation rate models to calculate ribosome protection. Overall, the developed model quantifies the key interactions that collectively control mRNA stability in bacterial operons and predicts how changing mRNA sequence alters mRNA stability, which is important when studying and engineering bacterial genetic systems.
© 2024. The Author(s).
Conflict of interest statement
H.M.S. is a founder of De Novo DNA. D.P.C, A.H., and G.E.V declare no competing interests.
Figures
Similar articles
-
Extensive reshaping of bacterial operons by programmed mRNA decay.PLoS Genet. 2018 Apr 18;14(4):e1007354. doi: 10.1371/journal.pgen.1007354. eCollection 2018 Apr. PLoS Genet. 2018. PMID: 29668692 Free PMC article.
-
Systematic Quantification of Sequence and Structural Determinants Controlling mRNA stability in Bacterial Operons.ACS Synth Biol. 2021 Feb 19;10(2):318-332. doi: 10.1021/acssynbio.0c00471. Epub 2021 Jan 19. ACS Synth Biol. 2021. PMID: 33464822
-
The hok mRNA family.RNA Biol. 2012 Dec;9(12):1399-404. doi: 10.4161/rna.22746. Epub 2012 Dec 1. RNA Biol. 2012. PMID: 23324554
-
Translation initiation and the fate of bacterial mRNAs.FEMS Microbiol Rev. 2006 Nov;30(6):967-79. doi: 10.1111/j.1574-6976.2006.00043.x. Epub 2006 Sep 21. FEMS Microbiol Rev. 2006. PMID: 16989654 Review.
-
The tmRNA system for translational surveillance and ribosome rescue.Annu Rev Biochem. 2007;76:101-24. doi: 10.1146/annurev.biochem.75.103004.142733. Annu Rev Biochem. 2007. PMID: 17291191 Review.
Cited by
-
High-resolution profiling reveals coupled transcriptional and translational regulation of transgenes.Nucleic Acids Res. 2025 Jun 6;53(11):gkaf528. doi: 10.1093/nar/gkaf528. Nucleic Acids Res. 2025. PMID: 40530694 Free PMC article.
-
Automated Design of Oligopools and Rapid Analysis of Massively Parallel Barcoded Measurements.ACS Synth Biol. 2024 Dec 20;13(12):4218-4232. doi: 10.1021/acssynbio.4c00661. Epub 2024 Dec 6. ACS Synth Biol. 2024. PMID: 39641628
References
-
- Reis, A. C. & Salis, H. M. An automated model test system for systematic development and improvement of gene expression models. ACS Synth. Biol.9, 3145–3156 (2020). - PubMed
-
- Espah Borujeni, A. & Salis, H. M. Translation initiation is controlled by RNA folding kinetics via a ribosome drafting mechanism. J. Am. Chem. Soc.138, 7016–7023 (2016). - PubMed
-
- Cetnar, D. P. & Salis, H. M. Systematic quantification of sequence and structural determinants controlling mRNA stability in bacterial operons. ACS Synth. Biol.10, 318–332 (2021). - PubMed
Publication types
MeSH terms
Substances
Grants and funding
- FA9550-14-1-0089/United States Department of Defense | United States Air Force | AFMC | Air Force Office of Scientific Research (AF Office of Scientific Research)
- FA8750-17-C-0254/United States Department of Defense | Defense Advanced Research Projects Agency (DARPA)
- DE-SC0019090/U.S. Department of Energy (DOE)
LinkOut - more resources
Full Text Sources
Molecular Biology Databases
