. 2024 Nov 6;15(1):9578.
doi: 10.1038/s41467-024-54010-w.

AMFR-mediated Flavivirus NS2A ubiquitination subverts ER-phagy to augment viral pathogenicity

Affiliations

AMFR-mediated Flavivirus NS2A ubiquitination subverts ER-phagy to augment viral pathogenicity

Linliang Zhang et al. Nat Commun. .

Abstract

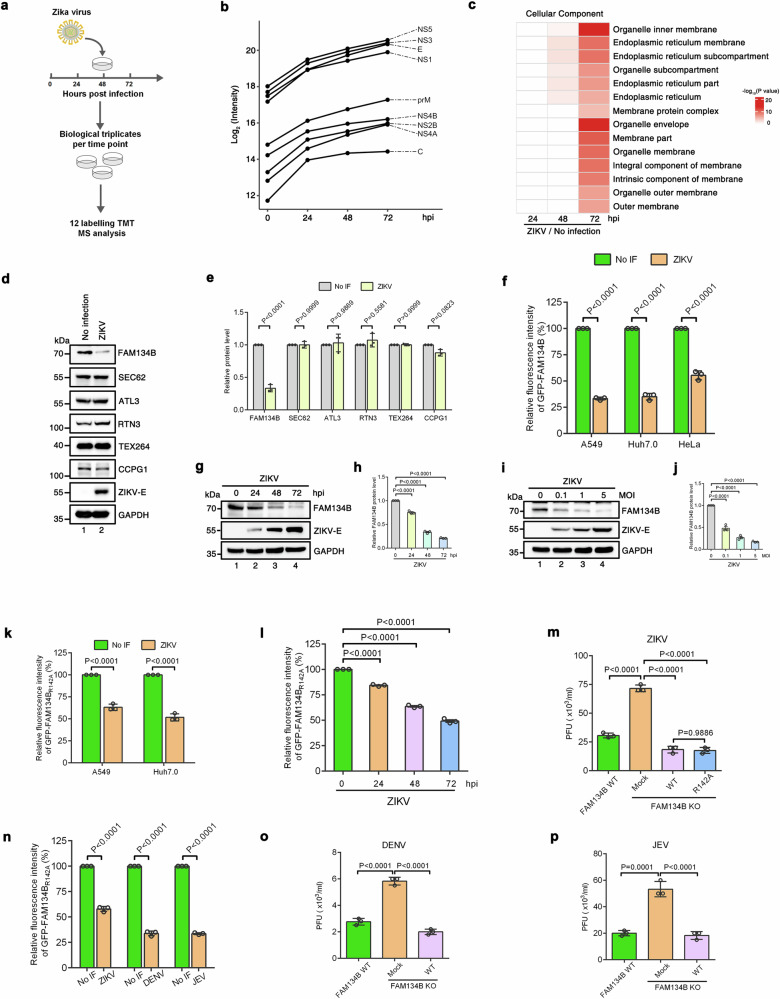
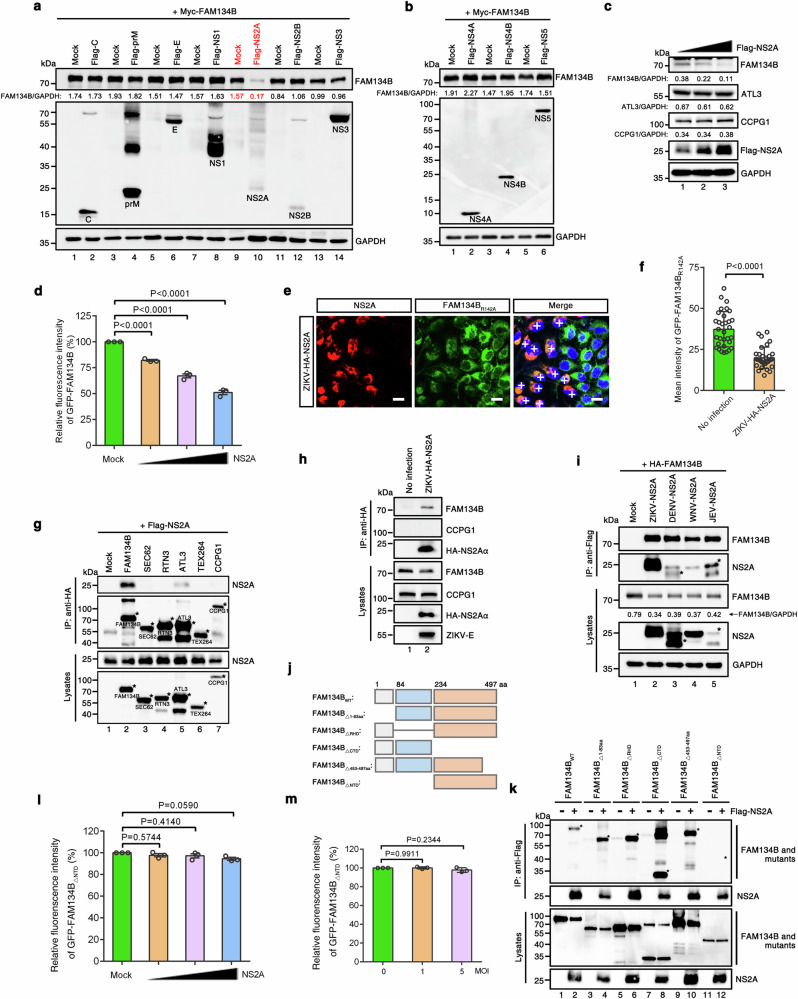
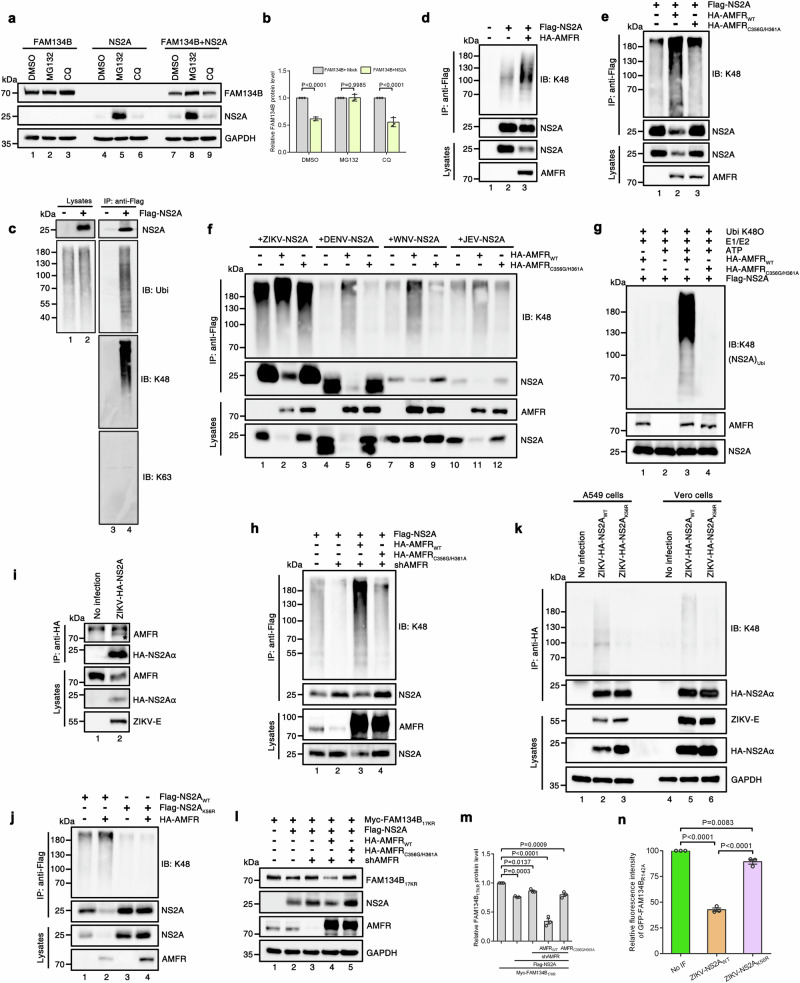
Flaviviruses strategically utilize the endoplasmic reticulum (ER) in their replication cycles. However, the role of ER autophagy (ER-phagy) in viral replication process remains poorly understood. Here, we reveal that prolonged Zika virus (ZIKV) infection results from the degradation of ER-phagy receptor FAM134B, facilitated by viral NS2A protein. Mechanistically, ER-localized NS2A undergoes K48-linked polyubiquitination at lysine (K) 56 by E3 ligase AMFR. Ubiquitinated NS2A binds to FAM134B and AMFR orchestrates the degradation of NS2A-FAM134B complexes. AMFR-catalyzed NS2A ubiquitination not only targets FAM134B degradation but also hinders the FAM134B-AMFR axis. Notably, a recombinant ZIKV mutant (ZIKV-NS2AK56R), lacking ubiquitination and ER-phagy inhibition, exhibits attenuation in ZIKV-induced microcephalic phenotypes in human brain organoids and replicates less efficiently, resulting in weakened pathogenesis in mouse models. In this work, our mechanistic insights propose that flaviviruses manipulate ER-phagy to modulate ER turnover, driving viral infection. Furthermore, AMFR-mediated flavivirus NS2A ubiquitination emerges as a potential determinant of viral pathogenecity.


Conflict of interest statement

The authors declare no competing interests.

Figures

Fig. 1
Fig. 1. FAM134B undergoes degradation during several flavivirus infections.
a Workflow for TMT-based quantitative proteomic analysis. b Median abundance of individual ZIKV proteins. c Cellular component analysis of significantly up-changing proteins (−log10 (P value)). d Western blotting analysis of A549 cells either mock-infected or infected with ZIKV at a MOI of 0.1. e Quantification of relative protein level of ER-phagy receptors. f Cells (A549, Huh7.0, and HeLa) stably expressing GFP-FAM134B were either mock-infected or infected with ZIKV at different MOIs (A549[0.1]; Huh7.0[1]; HeLa[1]) for 72 h, determined by flow cytometry. gj Western blotting analysis of Huh7.0 (g) or A549 (i) were either mock-infected or infected with ZIKV at multiple time points with a MOI of 0.1 (g) or at multiple MOIs for 24 h (i) and the corresponding quantification of relative FAM134B level (h, j). k Cells (A549 and Huh7.0) stably expressing GFP-FAM134BR142A were either mock-infected or infected with ZIKV at different MOIs (A549[0.1]; Huh7.0[1]) for 72 h, determined by flow cytometry. l A549 stably expressing GFP-FAM134BR142A were either mock-infected or infected with ZIKV at multiple time points with an MOI of 0.1, determined by flow cytometry. m Viral titers of supernatants from Huh7.0 FAM134B WT cells, Huh7.0 FAM134B KO cells, Huh7.0 FAM134B KO cells stably expressing FAM134BWT or Huh7.0 FAM134B KO cells stably expressing FAM134BR142A infected with ZIKV at a MOI of 1 for 72 h, quantified by plaque assay. n Huh7.0 cells stably expressing GFP-FAM134BR142A were either mock-infected or infected with ZIKV, DENV, or JEV at a MOI of 1 for 72 h, determined by flow cytometry. o, p Viral titers of supernatants from Huh7.0 FAM134B WT, Huh7.0 FAM134B KO cells, or Huh7.0 FAM134B KO cells stably expressing FAM134BWT infected with DENV or JEV at a MOI of 1 for 72 h, quantified by plaque assay. Error bars of (e, f, h, jp) present as the mean ± SEM (n = 3 independent experiments); Statistical analysis of (e, f, k, n) was performed using two-way ANOVA with Sidak’s multiple comparisons test and (h, j, l, m, o, p) was performed using one-way ANOVA with Tukey’s multiple comparisons test; Source data are provided as a Source Data file.
Fig. 2
Fig. 2. Flavivirus-NS2A targets FAM134B for degradation.
a, b Western blotting analysis of HEK293T cells co-transfected for 48 h with indicated Myc-FAM134B and Flag-tagged ZIKV viral protein-expressing plasmids or empty vector. The red font highlighted the ZIKV-NS2A protein. c Western blotting analysis of A549 cells transfected for 48 h with increasing amounts of Flag-NS2A. d Huh7.0-GFP-FAM134B transfected for 48 h with increasing amounts of Flag-NS2A, determined by flow cytometry. e Huh7.0-GFP-FAM134BR142A cells were infected with recombinant virus ZIKV-HA-NS2A at a MOI of 1 for 72 h and assessed confocal microscopy analysis. The plus sign (+) represents virus-infected cells marked by HA-NS2A. Scale bars, 10 μm. f Quantification of mean intensity of GFP-FAM134BR142A, related to (e). g HEK293T cells were co-transfected with Flag-NS2A and HA-tagged ER-phagic receptor-expressing plasmids or empty vector. Cells were harvested for coIP using anti-HA beads. The asterisk (*) represents the indicated ER-phagy receptors. h Huh7.0 cells were either mock-infected or infected with ZIKV-HA-NS2A at a MOI of 1 for 72 h, and then cells were harvested for coIP using anti-HA beads and analyzed by western blotting. The asterisk (*) represents the co-immunoprecipitated endogenous FAM134B, and the band of HA-NS2Aα detected by western blotting represented a truncated form of NS2A. i HEK293T cells were co-transfected with HA-FAM134B and Flag-tagged flavivirus-NS2A-expressing plasmids or empty vector. Cells were harvested for coIP using anti-flag beads. The asterisk (*) represents the indicated flavivirus-NS2A. j Schematic diagram of FAM134B mutants. k HEK293T cells were co-transfected with FAM134BWT and mutants with Flag-NS2A or empty vector. Cells were harvested for coIP using anti-flag beads. The asterisk (*) represents the indicated FAM134BWT and mutants. l, m Huh7.0-GFP-FAM134B△NTD were transfected for 48 h with increasing amounts of Flag-NS2A (l) or infected with ZIKV at a MOI of 1 (m) for 72 h, determined by flow cytometry. Error bars of (d, f, l, m) present as the mean ± SEM (d, l, m: n = 3; f: n = 32); Statistical analysis of (d, l, m) was performed using one-way ANOVA with Tukey’s multiple comparisons test and (f) was performed using two-tailed unpaired t-test analysis; Source data are provided as a Source Data file.
Fig. 3
Fig. 3. AMFR mediates flavivirus-NS2A ubiquitination which is required for NS2A-drived FAM134B degradation.
a, b, Western blotting analysis of HEK293T cells transfected for 30 h with the indicated plasmids and then treated with DMSO, MG132 (10 μM), and CQ (50 μM) for 8 h (a); Quantification of relative FAM134B level (b). cf, h, j, HEK293T cells were transfected with the indicated plasmids. Cells were harvested for coIP using anti-Flag beads and analyzed by western blotting with a K48-linkage-specific polyubiquitin antibody to detect the ubiquitination of NS2A. g In vitro ubiquitination assays were measured by incubating purified Flag-NS2A with purified HA-AMFRWT or HA-AMFRC356G/H361A analyzed by western blotting with a K48-linkage specific polyubiquitin antibody to detect the ubiquitination of NS2A. i Huh7.0 cells were either mock-infected or infected with ZIKV-HA-NS2A at an MOI of 1 for 72 h and then cells were harvested for coIP using anti-HA beads and analyzed by western blotting. k A549 and Vero cells were mock-infected or infected with ZIKV-HA-NS2AWT (MOI = 0.1) or ZIKV-HA-NS2AK56R (MOI = 1) for 72 h and then harvested for coIP using anti-HA beads and analyzed by western blotting with a K48-linkage specific polyubiquitin antibody to detect the ubiquitination of NS2A and the input E was normalized for immunoprecipitation. l, m Western blotting analysis of HEK293T cells or HEK293T-AMFR knockdown cells transfected for 48 h with the indicated plasmids (l); Quantification of relative FAM134B level (m). n Huh7.0-GFP-FAM134BR142A cells were infected with ZIKV-NS2AWT (MOI = 1), ZIKV-NS2AK56R (MOI = 10), or mock-infected for 72 h, determined by flow cytometry. Error bars of (b, m, n) present as the mean ± SEM (n = 3 independent experiments); Statistical analysis of (b) was performed using two-way ANOVA with Sidak’s multiple comparisons test and (m, n) was performed using one-way ANOVA with Tukey’s multiple comparisons test; Source data are provided as a Source Data file.
Fig. 4
Fig. 4. ZIKV subverts FAM134B to restrict ER-phagy process.
a Diagram of mCherry-EGFP tandem tagging assays. b Diagram of GFP-cleavage assays. c Immunofluorescence analysis of U2OS cells expressing mCherry-eGFP- RAMP4 infected with ZIKV-HA-NS2AWT (MOI = 1), ZIKV-HA-NS2AK56R (MOI = 10), or mock-infected for 48 h. Scale bars, 10 μm. d ER-phagy flux was quantified by the number of mCherry+ eGFP– dots. Error bars present as the mean ± SEM (n = 21); Statistical analysis was performed using one-way ANOVA with Tukey’s multiple comparisons test; Source data are provided as a Source Data file. e, g Western blotting analysis of U2OS cells transfected for 12 h with GFP-SEC61B and Myc-FAM134B (e) or Myc-FAM134B (g) and then infected with ZIKV-NS2AWT (MOI = 1), ZIKV-NS2AK56R (MOI = 10), or mock-infected for 48 h. f, i Western blotting analysis of U2OS cells transfected for 48 h with GFP-SEC61B and Myc-FAM134B and Flag-NS2AWT or Flag-NS2AK56R or empty vector (f) or Myc-FAM134B and Flag-NS2AWT or Flag-NS2AK56R or empty vector (h). h, j Quantification of relative CLIMP63 and REEP5 protein level, h corresponds to (g, j) corresponds to (i); Error bars of (h, j) present as the mean ± SEM (n = 3 independent experiments); Statistical analysis of (h, j) was performed using two-way ANOVA with Sidak’s multiple comparisons test; Source data are provided as a Source Data file.
Fig. 5
Fig. 5. ZIKV mutant (ZIKV-NS2AK56R) with ER-phagy inhibition-deficiency exhibits impaired microcephaly in human brain organoids.
a Diagram of viral exposure of brain organoids. b qPCR analysis of ZIKV-E RNA in organoids exposed to ZIKV-NS2AWT or ZIKV-NS2AK56R at 4 and 8 dpi. c Immunofluorescence analysis of Vero cells incubated with supernatants of ZIKV-infected organoids at 4 and 8 dpi. Scale bars, 75 μm. ZIKV-E (green), DAPI (blue). d, e Images and area measurements of organoids exposed to ZIKV-NS2AWT, ZIKV-NS2AK56R, or mock-treated at 4 and 8 dpi. Scale bars, 500 μm. f, g qRT-PCR analysis of SOX1 (f) and SOX2 (g) RNA in organoids exposed to ZIKV-NS2AWT, ZIKV-NS2AK56R or mock-treated at 4 and 8 dpi. h Immunofluorescence analysis of organoids exposed to ZIKV-NS2AWT, ZIKV-NS2AK56R or mock-treated. Scale bars, 75 μm. The area of two dashed lines represents ventricular zone (VZ)-like structures. ZIKV-E (green), SOX2 (red). i The measurement of VZ-like structures of (h). j Western blotting analysis of organoids exposed to ZIKV-NS2AWT (7 × 104 PFU/organoid), ZIKV-NS2AK56R (7 × 105 PFU/organoid) or mock-treated at 8 dpi. Error bars of (b, e, f, g, i) present as the mean ± SEM (b, f, g: n = 3; e: n = 13; i: n = 6); Statistical analysis of (b, e, f, g) was performed using two-way ANOVA with Sidak’s multiple comparisons test and (i) was performed using one-way ANOVA with Tukey’s multiple comparisons test; Source data are provided as a Source Data file.
Fig. 6
Fig. 6. ZIKV-NS2AK56R infection causes weakened pathogenicity and lethality in mice.
a Daily weights of mice treated with PBS (n = 6), ZIKV-NS2AWT (n = 7), or ZIKV-NS2AK56R (n = 7) (i.p., 104 PFU/ mouse); Error bars present as the mean ± SEM; Source data are provided as a Source Data file. b Survival of mice from (a); Log-rank (Mantel-Cox) test. cg qRT-PCR analysis of ZIKV-E RNA in different tissues of mice infected with ZIKV-NS2AWT or ZIKV-NS2AK56R (n = 6); Error bars of (cg) present as the mean ± SEM; Statistical analysis of (cg) was performed using two-tailed unpaired t-test analysis; Source data are provided as a Source Data file. h Immunofluorescence analysis of brains of mice infected with ZIKV-NS2AWT or ZIKV-NS2AK56R. Scale bars, 1000 μm. ZIKV-E (green), DAPI (blue). i Hematoxylin and eosin staining analysis of brains of mice infected with PBS, ZIKV-NS2AWT, or ZIKV-NS2AK56R. The black arrows represent the inflammation damage in the brain tissues. Scale bars, 100 μm. j Western blotting analysis of mFAM134B expression in mouse tissues infected with ZIKV-NS2AWT or ZIKV-NS2AK56R.
Fig. 7
Fig. 7. Model for AMFR-mediated Flavivirus NS2A ubiquitination subverts ER-phagy to augment viral pathogenicity.
Left: The ER-resident E3 ligase AMFR-mediated ubiquitination of ER-phagy receptor FAM134B promotes the dynamic flux of ER-phagy process to degrade ER sheets; Middle: During flavivirus infection, ZIKV hijacks AMFR to catalyze the polyubiquitination of ER-localized viral NS2A protein at K56 through K48-linked manner. Ubiquitinated NS2A binds to FAM134B, and AMFR orchestrates the degradation of NS2A-FAM134B complexes, ultimately impeding the flux of ER-phagy for ER accumulation and hindering the FAM134B-AMFR axis. Right: The ubiquitination and ER-phagy inhibition-deficient ZIKV-NS2AK56R infection exhibits weakened microcephaly and reduced replicative potential and decreased pathgenicity in mice.

References

    1. Pierson, T. C. & Diamond, M. S. The continued threat of emerging flaviviruses. Nat. Microbiol.5, 796–812 (2020). - PMC - PubMed
    1. Bhatt, S. et al. The global distribution and burden of dengue. Nature496, 504–507 (2013). - PMC - PubMed
    1. Maxmen, A. The hidden threat of West Nile virus. Nature489, 349–350 (2012). - PubMed
    1. Platt, D. J. & Miner, J. J. Consequences of congenital Zika virus infection. Curr. Opin. Virol.27, 1–7 (2017). - PMC - PubMed
    1. Mlakar, J. et al. Zika virus associated with microcephaly. N. Engl. J. Med.374, 951–958 (2016). - PubMed

Publication types

MeSH terms

LinkOut - more resources