. 2024 Nov 7;15(1):9609.
doi: 10.1038/s41467-024-54025-3.

A metagenomic catalogue of the ruminant gut archaeome

Affiliations

A metagenomic catalogue of the ruminant gut archaeome

Jiandui Mi et al. Nat Commun. .

Erratum in

Abstract

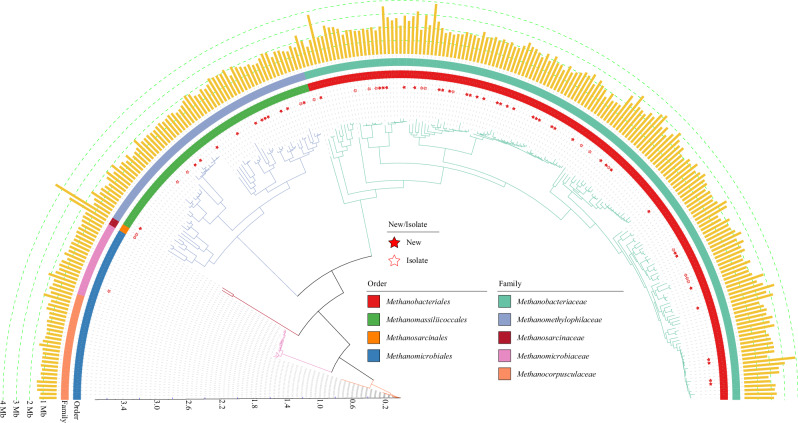
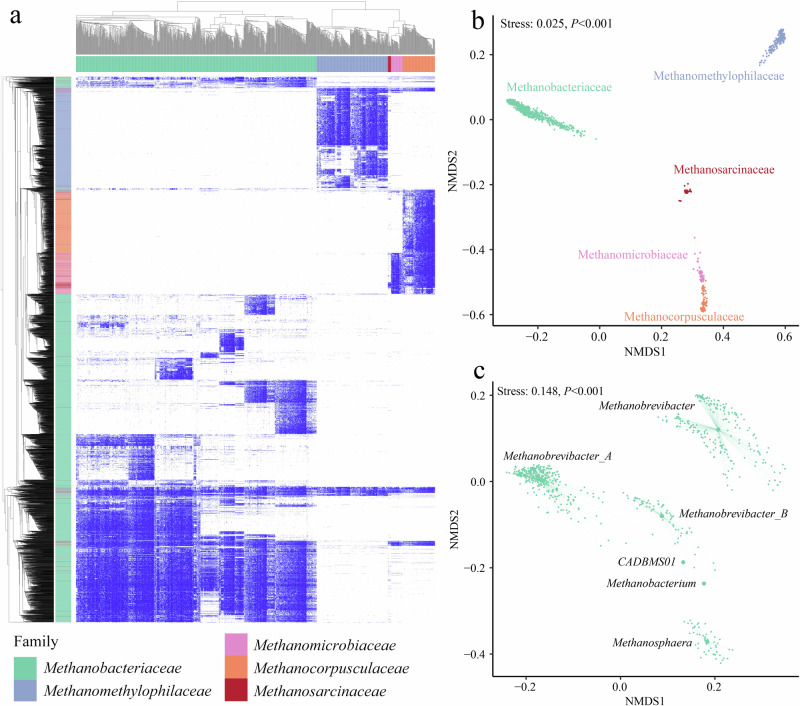
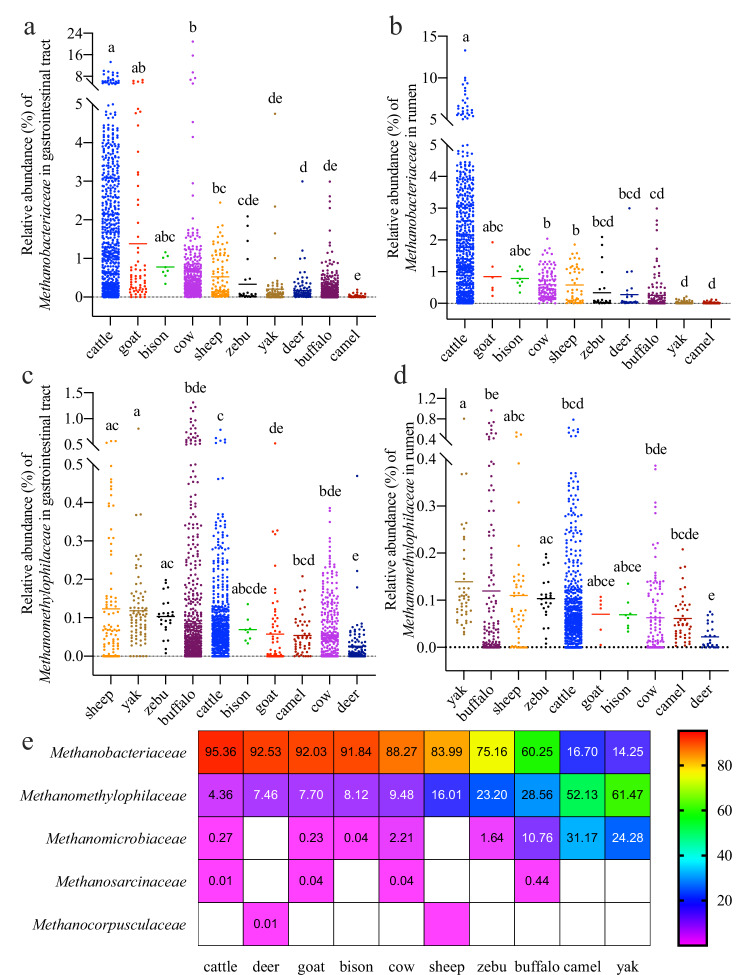
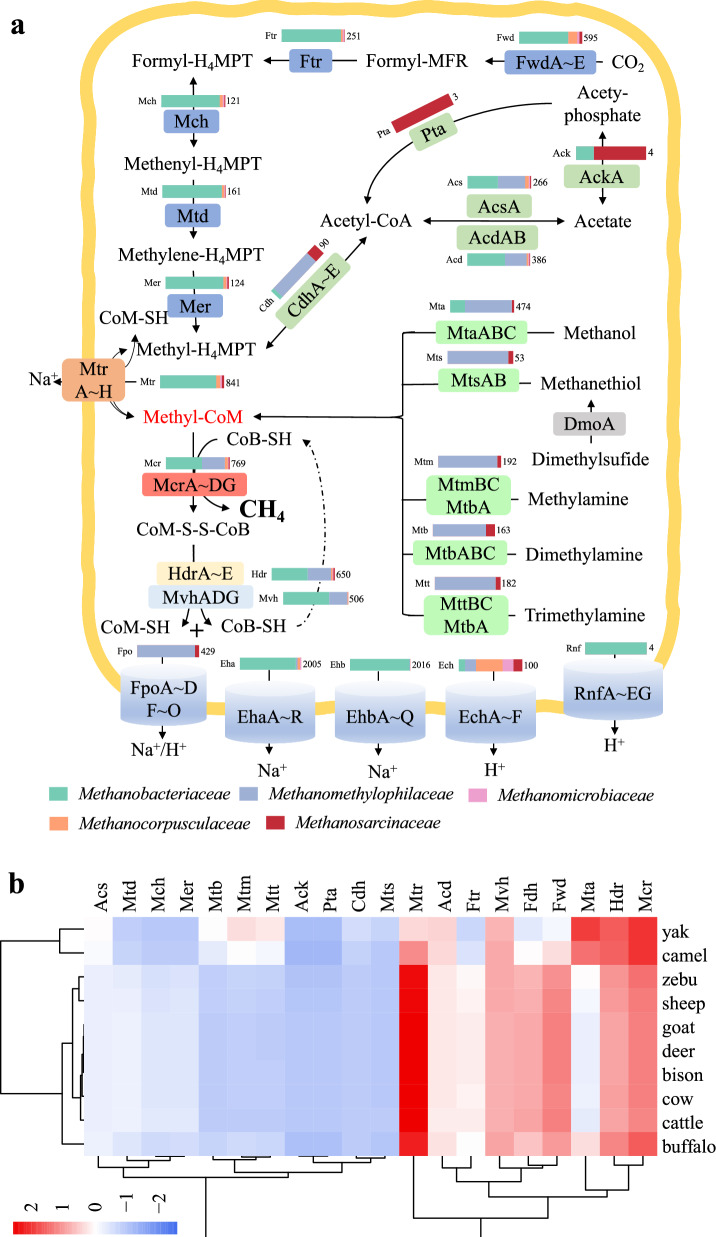
While the ruminant gut archaeome regulates the gut microbiota and hydrogen balance, it is also a major producer of the greenhouse gas methane. However, ruminant gut archaeome diversity within the gastrointestinal tract (GIT) of ruminant animals worldwide remains largely underexplored. Here, we construct a catalogue of 998 unique archaeal genomes recovered from the GITs of ruminants, utilizing 2270 metagenomic samples across 10 different ruminant species. Most of the archaeal genomes (669/998 = 67.03%) belong to Methanobacteriaceae and Methanomethylophilaceae (198/998 = 19.84%). We recover 47/279 previously undescribed archaeal genomes at the strain level with completeness of >80% and contamination of <5%. We also investigate the archaeal gut biogeography across various ruminants and demonstrate that archaeal compositional similarities vary significantly by breed and gut location. The catalogue contains 42,691 protein clusters, and the clustering and methanogenic pathway analysis reveal strain- and host-specific dependencies among ruminant animals. We also find that archaea potentially carry antibiotic and metal resistance genes, mobile genetic elements, virulence factors, quorum sensors, and complex archaeal viromes. Overall, this catalogue is a substantial repository for ruminant archaeal recourses, providing potential for advancing our understanding of archaeal ecology and discovering strategies to regulate methane production in ruminants.


Conflict of interest statement

The authors declare no competing interests.

Figures

Fig. 1
Fig. 1. Archaeal genomes (279) at the strain level from the ruminant gastrointestinal tract reveal taxonomic expansion of the archaeome.
The phylogenetic tree depicts archaeal genomes with a completeness of >80% and contamination of <5%, clustered at 99% similarity (strain level). The characteristics displayed from the center to the outside include the branch of the phylogenetic tree with ultrafast bootstrap values. Newly recovered genomes and isolates are indicated by red solid stars (New) and red stars (Isolate), respectively. The taxonomic affiliations of the MAGs are shown at the order and family levels. The genome size of each MAG is represented by brown bars in megabases (Mb). The different colors of the branches correspond to the colors of the classified families.
Fig. 2
Fig. 2. Archaeal genomes from the ruminant gastrointestinal tract distribution and the corresponding unified protein catalogue.
a Unified ruminant gut archaeal protein catalogue based on protein clustering at 50% sequence identity and 80% coverage via MMseqs2 of all 998 archaeal genomes. The heatmap depicts the presence of 5456 proteins (columns) across the 998 archaeal genomes (rows). Heatmap visualization was performed via the pheatmap package in R. White indicates that no data were available. b Nonmetric multidimensional scaling (NMDS) plot of the proteins selected for the heatmap. The NMDS plot shows five distinct clusters corresponding to the archaeal families Methanobacteriaceae, Methanomethylophilaceae, Methanocorpusculaceae, Methanomicrobiaceae, and Methanosarcinaceae, with the central dots representing the mean NMDS scores for each genome. c The NMDS plot shows six distinct clusters corresponding to the archaeal genera Methanobrevibacter, Methanobrevibacter_A, Methanobrevibacter_B, Methanosphaera, Methanobacterium, and CADBMS01 of the Methanobacteriaceae family with the central dot representing the mean NMDS scores for each genome. The stress value was calculated via metaMDS functions from the vegan package with Bray-Curtis distances (b, c). The P value was calculated by permutational multivariate analysis of variance (PERMANOVA) analysis (b, c). Source data are provided as a Source Data file.
Fig. 3
Fig. 3. Percentage and relative abundance of archaeal genomes at the family level across different ruminant species.
a Percentage of Methanobacteriaceae in the intestine. b Percentage of Methanobacteriaceae in the rumen. c Percentage of Methanomethylophilaceae in the intestine. d Percentage of Methanomethylophilaceae in the rumen. e Heatmap showing the composition of archaeome at the family level in the rumen. From red to purple indicates values from high to low. The number of samples for breeds in the intestine (a, c) is cattle: n = 638, goat: n = 64, bison: n = 8, cow: n = 366, sheep: n = 92, zebu: n = 24, yak: n = 79, deer: n = 105, buffalo: n = 682, and camel: n = 50. The number of samples for breeds in the rumen (b, d) is cattle: n = 606, goat: n = 6, bison: n = 8, cow: n = 111, sheep: n = 47, zebu: n = 24, yak: n = 44, deer: n = 26, buffalo: n = 125, and camel: n = 44. The middle horizontal line represents the mean value (ad). The statistical significance of the abundance differences was calculated by the two-sided Kruskal-Wallis test corrected for multiple comparisons via Dunn’s test (ad). Different letters indicate statistically significant differences (P < 0.05), with the specific pairwise comparison P-values as Supplementary Data 3 demonstrates (ad). Source data are provided as a Source Data file.
Fig. 4
Fig. 4. Percentages of archaea in the rumen across ruminant species and relative abundances determined through gut biogeography.
a Nonmetric multidimensional scaling (NMDS) plot depicting the percentage of archaea in the rumen microbiome across ruminant species, with the central dot representing the mean NMDS score for each sample. b NMDS plot illustrating the percentage of archaea in ruminant gut microbiomes across different gut biogeographies of buffalo, cows, and yaks with the central dot representing the mean NMDS scores for each sample. The stress value was calculated via metaMDS functions from the vegan package with Bray-Curtis distances (a, b). The P value was calculated via permutational multivariate analysis of variance (PERMANOVA) analysis (a, b). The black circle, triangle, and square symbols represent buffalo, dairy cow, and yak, respectively. c The relative abundance of archaea in ruminant gut microbiomes across gut biogeographies of buffalo, cows, and yaks. The black circles, triangles, and squares represent buffalo, dairy cows, and yaks, respectively. Rum Rumen, Ret Reticulum, Oma Omasum, Abo Abomasum, Duo Duodenum, Jej Jejunum, Ile Ileum, Cec Cecum, Col Colon, Rec Rectum, and Fec Feces. The schematic diagram of the ruminant gut was hand-drawn and authorized by Jingbo Xia, a friend of J.D. M. (c). Source data are provided as a Source Data file.
Fig. 5
Fig. 5. Methanogenic pathways in the ruminant gut-associated archaeome at the species level.
a The proportion of species with a predicted protein or protein complex is indicated by the bar for total archaeal genomes at the species level (n = 203). The number on the right of the bar represents the total number of genes predicted for all archaeal genomes. The blue, light green, and dark green squares on the lines represent genes involved in three different methanogenic pathways: hydrogenotrophic, methylotrophic, and aceticlastic, respectively. b Differential enrichment of methanogenesis-associated genes in the rumen across ruminant species. Source data are provided as a Source Data file.

References

    1. Mizrahi, I., Wallace, R. J. & Morais, S. The rumen microbiome: balancing food security and environmental impacts. Nat. Rev. Microbiol.19, 553–566 (2021). - PubMed
    1. Martínez-Álvaro, M. et al. Bovine host genome acts on rumen microbiome function linked to methane emissions. Commun. Biol.5, 350 (2022). - PMC - PubMed
    1. IPCC. Sections. In: Climate Change 2023: Synthesis Report. Contribution of Working Groups I, II and III to the Sixth Assessment Report of the Intergovernmental Panel on Climate Change [Core Writing Team, H. Lee and J. Romero (eds.)]. IPCC, Geneva, Switzerland, 35-115 (2023).
    1. Dangal, S. R. S. et al. Methane emission from global livestock sector during 1890-2014: Magnitude, trends and spatiotemporal patterns. Glob. Change Biol.23, 4147–4161 (2017). - PubMed
    1. Arndt, C. et al. Full adoption of the most effective strategies to mitigate methane emissions by ruminants can help meet the 1.5 °C target by 2030 but not 2050. Proc. Natl Acad. Sci. USA119, e2111294119 (2022). - PMC - PubMed

Publication types

Associated data

LinkOut - more resources