. 2024 Nov 6;14(1):26884.
doi: 10.1038/s41598-024-77164-5.

Specific human gene expression in response to infection is an effective marker for diagnosis of latent and active tuberculosis

Affiliations

Specific human gene expression in response to infection is an effective marker for diagnosis of latent and active tuberculosis

Ritah Nakiboneka et al. Sci Rep. .

Abstract

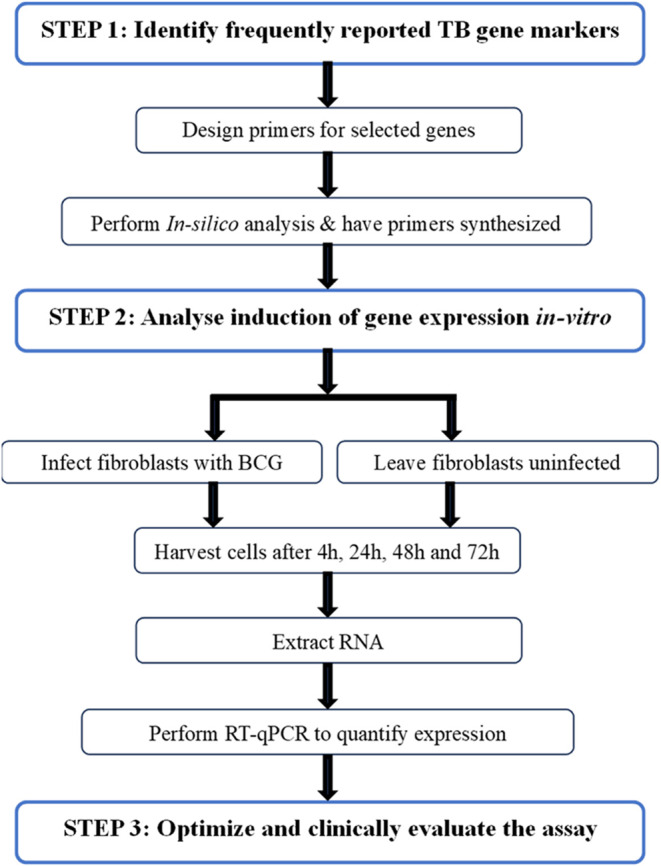
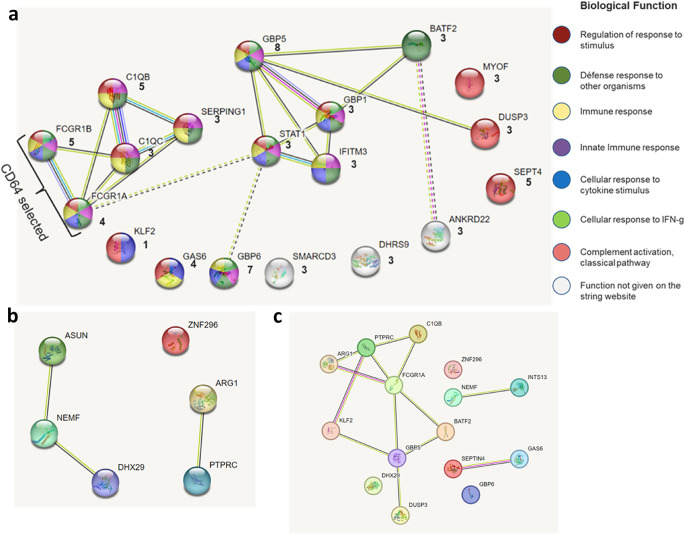
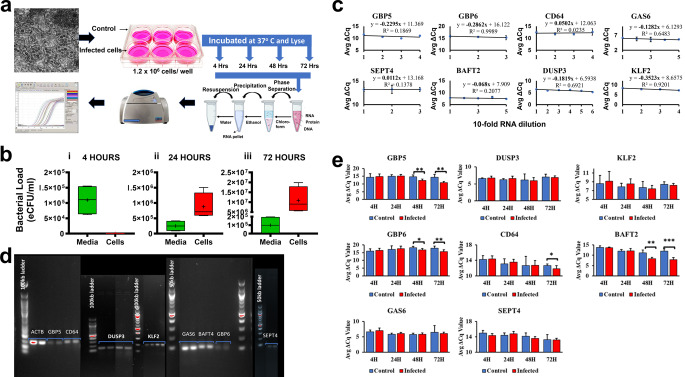
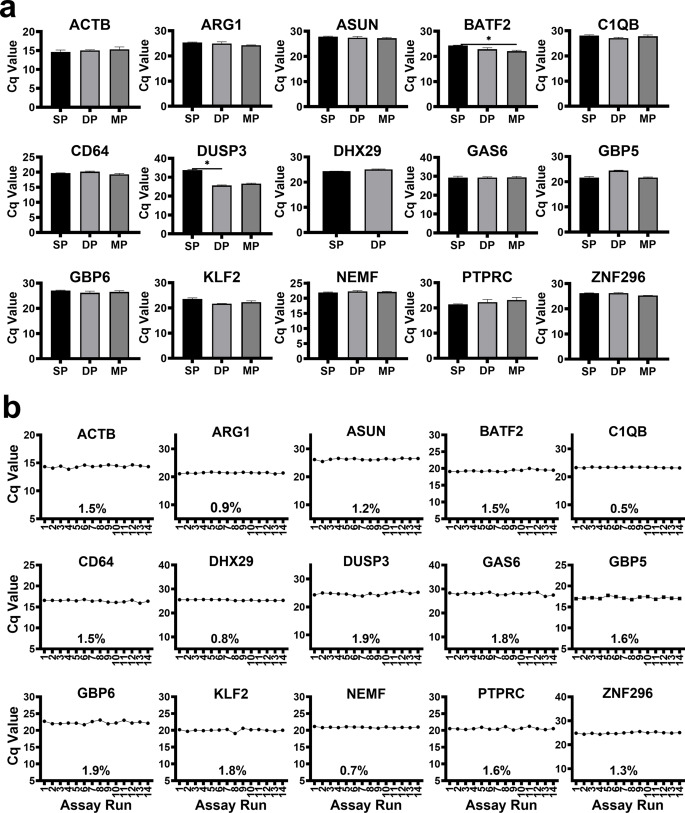
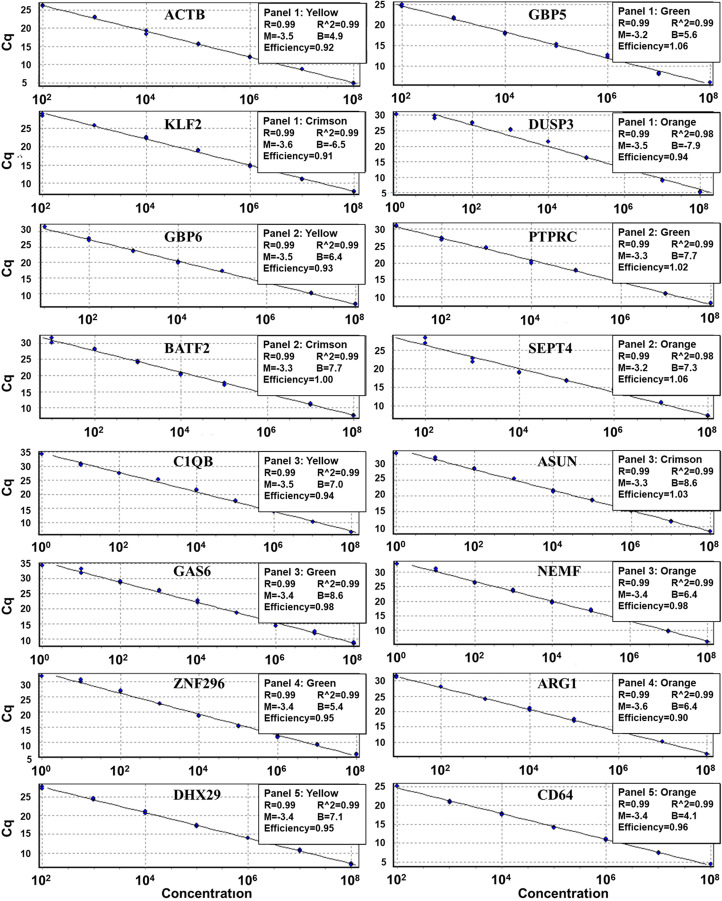
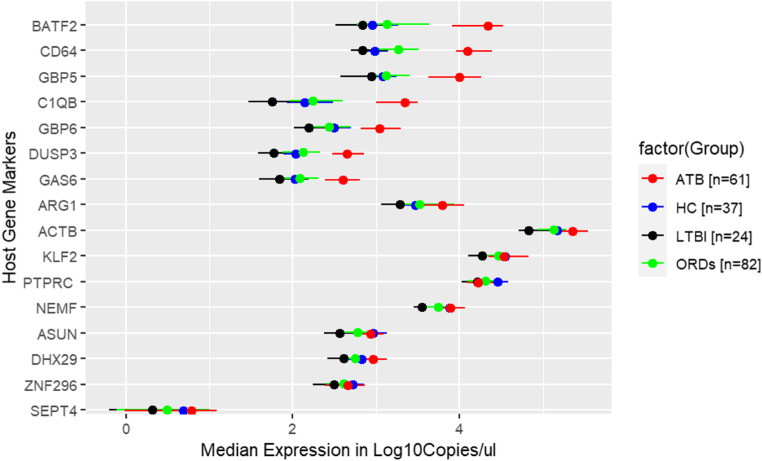
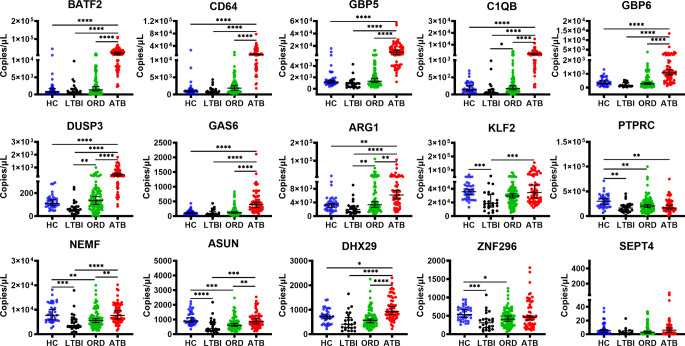
RNA sequencing and microarray analysis revealed transcriptional markers expressed in whole blood can differentiate active pulmonary TB (ATB) from other respiratory diseases (ORDs), and latent TB infection (LTBI) from healthy controls (HC). Here we describe a streamlined reverse transcriptase quantitative polymerase chain reaction (RT-qPCR) assay that could be applied at near point-of-care for diagnosing and distinguishing ATB from ORDs and LTBI from HC. A literature review was undertaken to identify the most plausible host-gene markers (HGM) of TB infection. Primers, and dual labelled hydrolysis probes were designed and analytically evaluated for accuracy in an in-vitro model of infection using a lung fibroblast cell-line. Best performing genes were multiplexed into panels of 2-4 targets and taken forward for clinical evaluation. Mycobacteria Growth Indicator Tube and QuantiFERON-TB Gold Plus were used as reference tests for ATB and LTBI respectively. A total of 16 HGM were selected and incorporated into five multiplex RT-qPCR panels. PCR assay efficiency of all evaluated targets was ≥ 90% with a median analytical sensitivity of 292 copies/µl [IQR: 215.0-358.3 copies/µl], and a median limit of quantification of 61.7 copies/µl [IQR: 29.4-176.3 copies/µl]. Clinically, ATB was characterised by higher gene expression than ORDs, while LTBI was associated with lower gene expression than HC, Kruskal-Wallis p < 0.0001. Crucially, BATF2, CD64, GBP5, C1QB, GBP6, DUSP3, and GAS6 exhibited high differentiative ability for ATB from ORDs, LTBI or HC while KLF2, PTPRC, NEMF, ASUN, and ZNF296 independently discriminated LTBI from HC. Our results show that different HGM maybe required for ATB and LTBI differentiation from ORDs or HC respectively and demonstrate the feasibility of host gene-based RT-qPCR to diagnose ATB and LTBI at near point-of-care.

Keywords: Active tuberculosis; Diagnosis; Host gene expression; Latent tuberculosis; Reverse transcriptase-quantitative PCR.


Conflict of interest statement

The authors declare no competing interests.

Figures

Figure 1
Figure 1
Schematic flow diagram illustrating steps taken to design the RT-qPCR assay. BCG- bacillus Calmette–Guérin, RNA- ribonucleic acid and RT-qPCR- reverse transcriptase quantitative polymerase chain reaction assay.
Figure 2
Figure 2
Frequently reported TB gene markers and functional relationships between them. (A) Selected gene biomarker protein interaction network created on the STRING website. Genes were grouped according to their associated pathways and biological functions. The colour within the circles represents the biological function and the key summarises the functions. The evidence mode was used to summarize the network predicted associations. Lines indicate the available evidence used in predicting the functional associations, the colour of the lines denotes the type of interaction evidence. The number of interaction lines illustrate more evidence of modules available for that interaction. Seven types of interaction evidence were used. Interaction analysis on the STRING website was performed in March of 2021 and may change with new evidence submitted to the database. Numbers underneath the gene symbol indicate the number of times gene was mentioned in plausible signatures. (B) Network interaction of the additional markers for LTBI. (C) Final interaction network of all the selected gene markers.
Figure 3
Figure 3
Assessing primer performance in measuring gene expression in a tissue culture model of infection. a, Illustration of the lung fibroblast infection assay, extraction procedure and PCR amplification cycle. b, BCG association with lung fibroblasts increases with time of incubation. Shown are box plots of bacterial load in eCFU/ml in infected media (green) and in infected lung fibroblast cells (red) after (i) 4 h, (ii) 24 h, and (iii) 72 h of incubation. c, Amplification efficiency of the target and reference primers compared. Line graph showing average ΔCq values between target and reference primers at serial dilutions of mRNA. A slope of close to 0 indicated similar amplification efficiency of the target genes and the reference gene ACTB. d, Agarose gel electrophoresis for amplified targets. e, Upregulated expression of genes in infected human lung fibroblast cells. Bar graphs showing average (Avg.) normalised Cycle quantification (Cq) values as a ratio to Avg. Cq values for the reference gene, ACTB. The lower the Avg. ΔCq value the higher the gene expression. Mann-Whitney test was used to evaluate for statistical differences. Data are reported as mean values from three repeats of each experiment consisting of 2 uninfected and 4 infected wells, * indicates p-value < 0.05, ** indicates a p-value < 0.01 and *** indicates a p-value < 0.001. Error bars are indicative of the standard deviation of the ΔCq values.
Figure 4
Figure 4
Assay Optimization. Shown are Cq values measured from an ATB participant sample. a, Assay multiplexing: SP - Single-target reaction, DP - Double-target reaction and MP - Multiplex, mean expression levels. Comparison was performed using the Kruskal-Wallis test and Dunn’s Test with Bonferroni corrected p-values for multiple comparisons. A p-value of 0.05 or less was considered significant and * is equivalent to p < 0.05. b, Assay precision testing line graphs showing assay read-out Cq values. Assay technical repeat runs 1–6 were performed on 4th of November 2022 and assay technical repeat runs 7 to 14 were performed on 6th February 2023. Percentage values within the graph represent the Cq CVs between runs for target genes.
Figure 5
Figure 5
Assay efficiency assessment. PCR efficiency represented by the best of fit regression line of the standard curve for the HGM targets. Cq – quantification cycles, the x-axis shows the concentration of standard target sequences in copies/µl. Blue dots in the curves represents standard target sequencies quantified at different concentrations. Assay threshold value for all targets was set at 0.01 except GBP6 whose threshold was set at 0.005 because it had low expression in clinical samples. Cycling A - the amplification cycle in the Yellow (HEX), Green (FIM), Crimson (ATTO700) and Orange (ROX) channel. Panel 1/2/3/4/5 are the multiplex reaction panels; Panel 1 to 3 each consisted of 4 HGM and panel 4 and 5 consisted of 2 HGM. R^2 value - coefficient of determination and the R value - Pearson correlation coefficient is the square root of R^2. M and B – represent the slope (M) and the intercept (B) of the standard curve. Efficiency – reaction efficiency by which the independent variable correlates with the dependent variable.
Figure 6
Figure 6
Clinical assay evaluation. Stratified median log10copies/µl expression with IQRs of the evaluated HGM.
Figure 7
Figure 7
Host-gene marker expression levels among the study participants. Shown are scatter plots of measured expression levels among the participants namely HC (n = 37), LTBI (n = 24), ORD (n = 82), ATB (n = 61). Lines show the median and 95% confidence intervals. Statistical comparison was performed using the Kruskal-Wallis test and Dunn’s Test with Bonferroni corrected p-values for multiple comparisons. *=<0.05, **=<0.01, ***=<0.001, and ****=<0.0001.

References

    1. WHO. WHO. Early detection of Tuberculosis: An overview of approaches, guidelines and tools. WHO/HTM/STB/PSI/2011.21. 1–32 at. (2011).
    1. WHO. High-priority target product profiles for new tuberculosis diagnostics: report of a consensus meeting. WHO Meeting Report (2014). https://iris.who.int/handle/10665/135617
    1. Burel, J. G. & Peters, B. Discovering transcriptional signatures of disease for diagnosis versus mechanism. Nature Reviews Immunology at (2018). 10.1038/nri.2018.26 - PMC - PubMed
    1. Kaforou, M. et al. Detection of tuberculosis in HIV-Infected and -uninfected African adults using whole blood RNA expression signatures: a case-control study. PLoSMed. 10 (10), e1001538. 10.137/journal.pmed.1001538 (2013). - DOI - PMC - PubMed
    1. Bloom, C. I. et al. Detectable changes in the blood transcriptome are Present after two weeks of Antituberculosis Therapy. PLoS One. 7 (10), e46191. 10.1371/journal.pone.0046191 (2012). - PMC - PubMed

LinkOut - more resources