. 2024 Nov 6;14(1):26874.
doi: 10.1038/s41598-024-77660-8.

Long-term safety of photobiomodulation exposure to beta cell line and rat islets in vitro and in vivo

Affiliations

Long-term safety of photobiomodulation exposure to beta cell line and rat islets in vitro and in vivo

Quentin Perrier et al. Sci Rep. .

Abstract

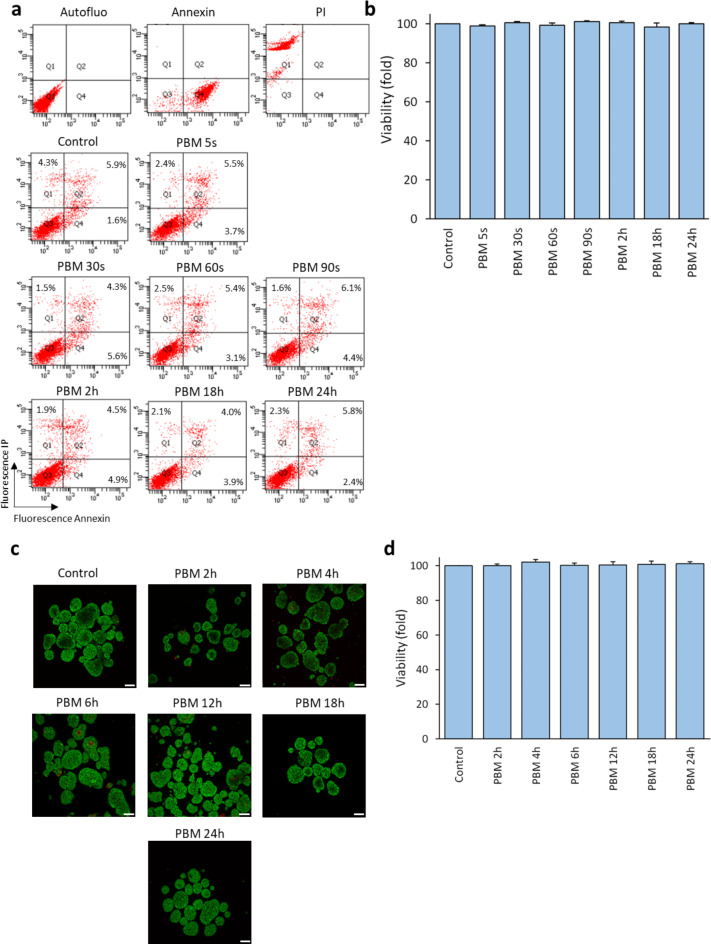
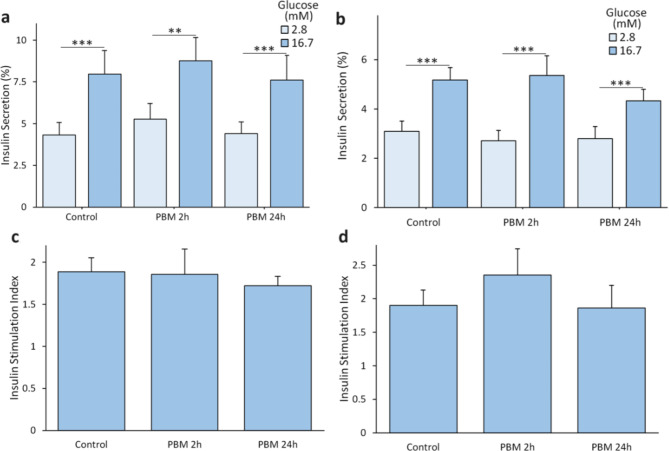
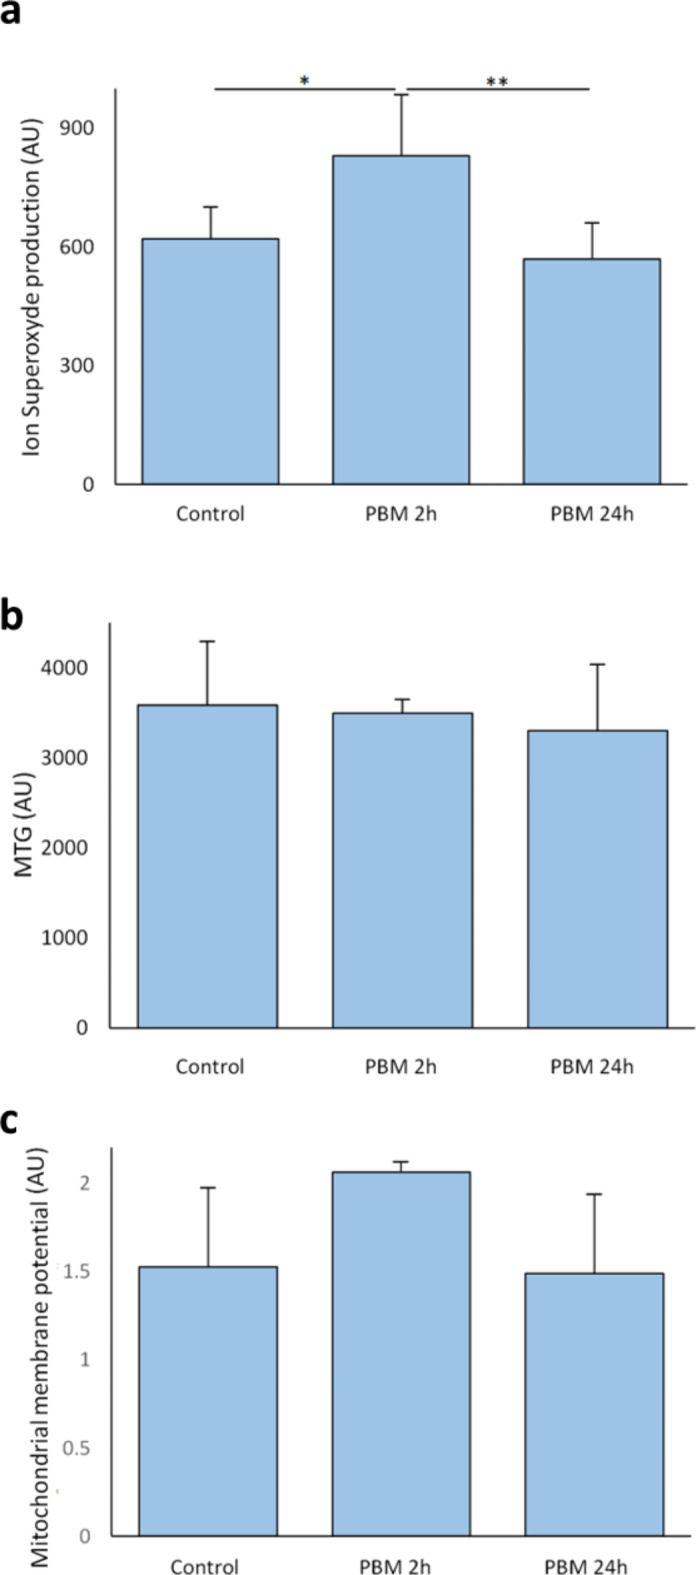
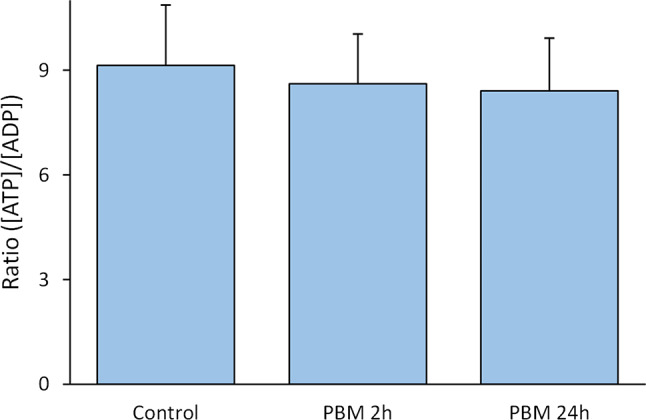
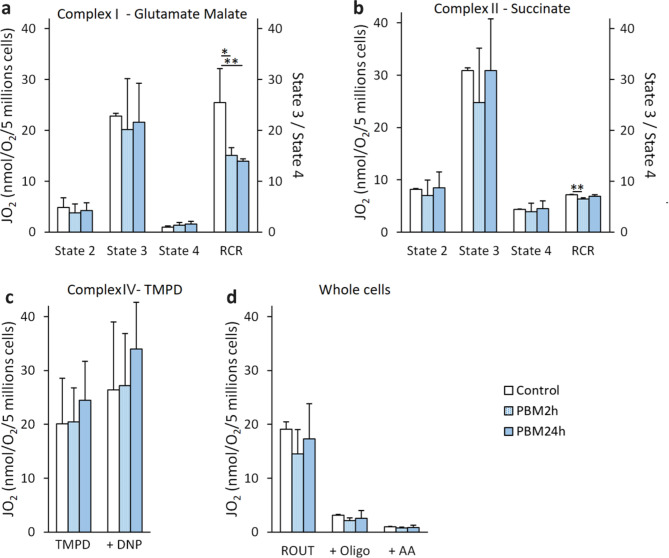
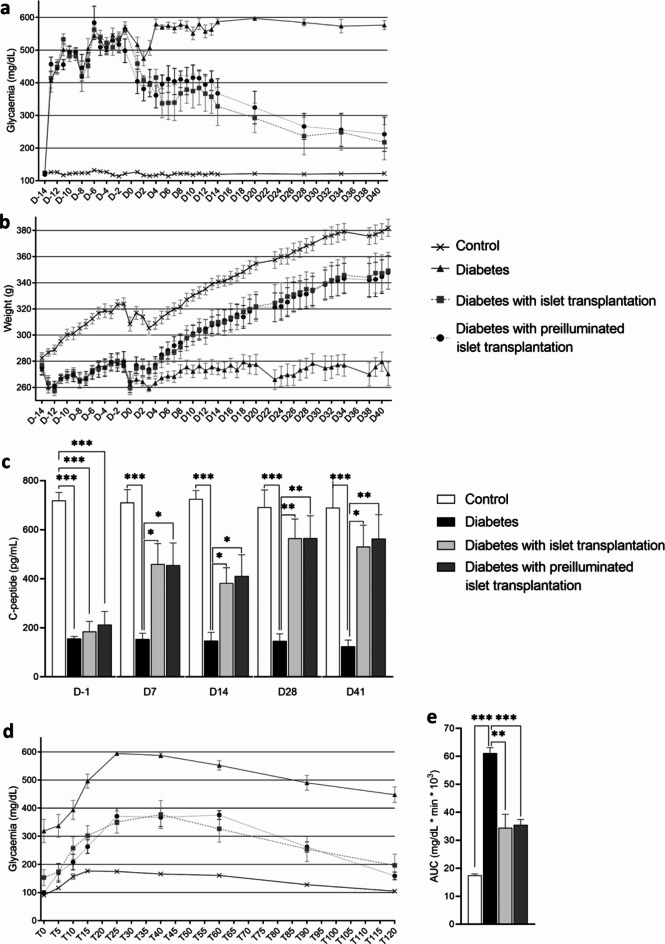
This study evaluates the safety and potential benefits of PBM on pancreatic beta cells and islets. PBM was applied to insulin-secreting cell lines (MIN6) and rat pancreatic islets using a 670 nm light source, continuous output, with a power density of 2.8 mW/cm², from 5 s to several 24 h. Measure of cell viability, insulin secretion, mitochondrial function, ATP content, and cellular respiration were assessed. Additionally, a diabetic rat model is used for islet transplantation (pre-conditioning with PBM or not) experiments. Short and long-term PBM exposure did not affect beta cell islets viability, insulin secretion nor ATP content. While short-term PBM (2 h) increases superoxide ion content, this was not observed for long exposure (24 h). Mitochondrial respirations were slightly decreased after PBM. In the islet transplantation model, both pre-illuminated and non-illuminated islets improved metabolic control in diabetic rats with a safety profile regarding the post-transplantation period. In summary, for the first time, long-term PBM exhibited safety in terms of cell viability, insulin secretion, energetic profiles in vitro, and post-transplantation period in vivo. Further investigation is warranted to explore PBM's protective effects under conditions of stress, aiding in the development of innovative approaches for cellular therapy.

Keywords: Beta cells; Diabetes; Functionnality; Insulinosecretion; Long exposure; Photobiomodulation; Safety; Viability.


Conflict of interest statement

The authors declare no competing interests.

Figures

Fig. 1
Fig. 1
Effect of PBM on the viability of MIN6 cells and rat islets. MIN6 cells and rat islets are exposed to 2.8 mW/cm² PBM illumination. a Results of a representative flow cytometry experiment on the viability of MIN6 cells after PBM. Live cells are in Q3 (annexin-negative and PI-negative). Annexin and PI conditions correspond to death control. b Effect of PBM on MIN6 cells’ viability. Results are normalized to the control value. c Representative images of islet viability experiment by confocal microscopy after PBM. Live cells are labeled with Syto13 (green) and dead cells are labeled with PI (red). d Effect of PBM on rat islets’ viability. Results are normalized to the control value. PBM: photobiomodulation, PI: propidium iodide. Results are expressed as the mean ± SEM,n = 4, Scale bares = 100 μm, One-way ANOVA Kruskal–Wallis’s test with pairwise comparison.
Fig. 2
Fig. 2
Effect of PBM on insulin secretion of MIN6 cells and rat islets. MIN6 cells and rat islets are exposed to 2.8 mW/cm² PBM illumination. a Effect of PBM on MIN6 cells’ insulin secretion (normalized to total insulin content) in response to glucose (n = 8). Results are normalized by total insulin content. b Effects of PBM on islets’ insulin secretion (normalized to total insulin content) in response to glucose (n = 5). Results are normalized by total insulin content. c Effect of PBM on MIN6 cells’ insulin stimulation index (high glucose insulin secretion/low glucose insulin secretion)). d Effect of PBM on islets’ insulin stimulation index. PBM: Photobiomodulation. Results are expressed as mean ± SEM, One-way ANOVA Welch’s with Games Howell post-hoc test, ** p < 0.01, *** p < 0.001.
Fig. 3
Fig. 3
Effect of PBM on superoxide content and mitochondrial membrane potential of MIN6 cells. The MIN6 cells are exposed to 2.8 mW/cm² PBM illumination. a Effect of PBM on MIN6 cells’ superoxide content. Data are expressed as the mean fluorescence intensity. (n = 3 for PBM 2 h,n = 6 for PBM 24 h). b Effect of PBM on the MIN6 cells’ mitochondrial masse. c Effect of PBM on the MIN6 cells’ mitochondrial membrane potential (n = 3 for PBM 2 h,n = 5 for PBM 24 h). Data obtained by flow cytometer and expressed as the mean fluorescence intensity. The mitochondrial membrane potential is (TMRM-CCCp)/MTG. AU: Arbitrary unit; MTG: Mitotracker Green™; PBM: photobiomodulation. Results expressed as the mean ± SEM, One-way ANOVA Welch’s with Games-Howell post-hoc test, * p < 0.05, ** p < 0.01.
Fig. 4
Fig. 4
Effect of PBM on ATP/ADP of MIN6 cells. The MIN6 are exposed to 2.8 mW/cm² PBM illumination. PBM: photobiomodulation. Results are obtained by HPLC and expressed as the mean ± SEM,n = 7, One-way ANOVA Welch’s with Games-Howell post-hoc test.
Fig. 5
Fig. 5
Effect of PBM on mitochondrial and cell respiration of MIN6 cells. The MIN6 cells are exposed to 2.8 mW/cm² PBM illumination. a Effect of PBM on the MIN6 cells’ complex I (glutamate malate) activity. b Effect of PBM on the MIN6 cells’ complex II (succinate) activity. c Effect of PBM on the MIN6 cells’ complex IV (TMPD) activity. d Effect of PBM on respiration of the whole MIN6 cells. AA: antimycin A; Oligo: Oligomycine; PBM: photobiomodulation; RCR: respiratory control ratio (state 3/state 4) graduation is in the right y-axis; ROUT: routine respiration of intact cells. Results are obtained by oxygraphy and expressed as nmol of oxygen consumed per minute per 5 million live cells. Results are expressed as the mean ± SEM,n = 4, One-way ANOVA Fisher’s with Tukey post-hoc test, * p < 0.05, ** p < 0.01.
Fig. 6
Fig. 6
Evolution of metabolic parameters after islet transplantation of diabetic rats. a Evolution of glycaemia. b Evolution of body weight. c Evolution of C-peptide secretion. d Glycemia during OGTT, time is expressed in minutes. e AUC of OGTT. Results are expressed as mean ± SEM, One-way ANOVA Fisher’s with Tukey post-hoc test, n = 8 per group, * p < 0.05, ** p < 0.01, *** p < 0.001.

References

    1. Perrier, Q. et al. Failure mode and effect analysis in human islet isolation: from the theoretical to the practical risk. Islets. 13, 1–9 (2021). - PMC - PubMed
    1. Lablanche, S. et al. Ten-year outcomes of islet transplantation in patients with type 1 diabetes: data from the Swiss-French GRAGIL network. Am. J. Transpl. Off J. Am. Soc. Transpl. Am. Soc. Transpl. Surg.21, 3725–3733 (2021). - PubMed
    1. Lablanche, S. et al. Islet transplantation versus insulin therapy in patients with type 1 diabetes with severe hypoglycaemia or poorly controlled glycaemia after kidney transplantation (TRIMECO): a multicentre, randomised controlled trial. Lancet Diabetes Endocrinol.6, 527–537 (2018). - PubMed
    1. Vantyghem, M. C., de Koning, E. J. P., Pattou, F. & Rickels, M. R. Advances in β-cell replacement therapy for the treatment of type 1 diabetes. Lancet Lond. Engl.394, 1274–1285 (2019). - PMC - PubMed
    1. Nilsson, B., Ekdahl, K. N. & Korsgren, O. Control of instant blood-mediated inflammatory reaction to improve islets of Langerhans Engraftment. Curr. Opin. Organ. Transpl.16, 620–626 (2011). - PubMed

MeSH terms

LinkOut - more resources