. 2024 Nov 6;7(1):1447.
doi: 10.1038/s42003-024-07120-6.

Deep functional measurements of Fragile X syndrome human neurons reveal multiparametric electrophysiological disease phenotype

Affiliations

Deep functional measurements of Fragile X syndrome human neurons reveal multiparametric electrophysiological disease phenotype

James J Fink et al. Commun Biol. .

Abstract

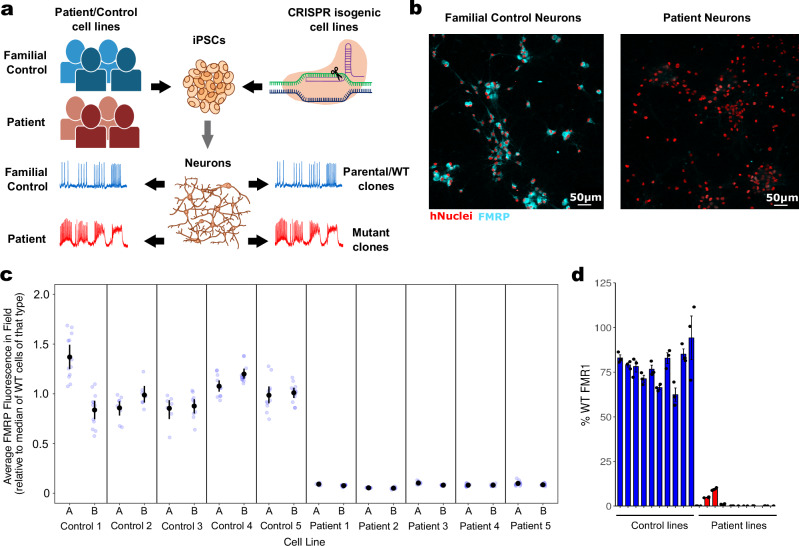
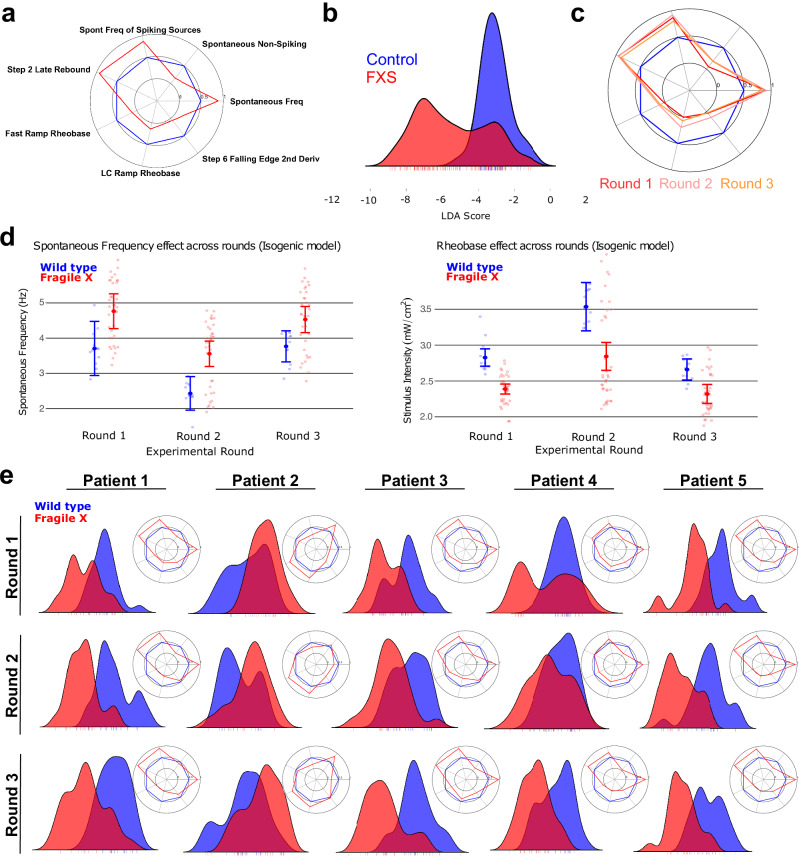
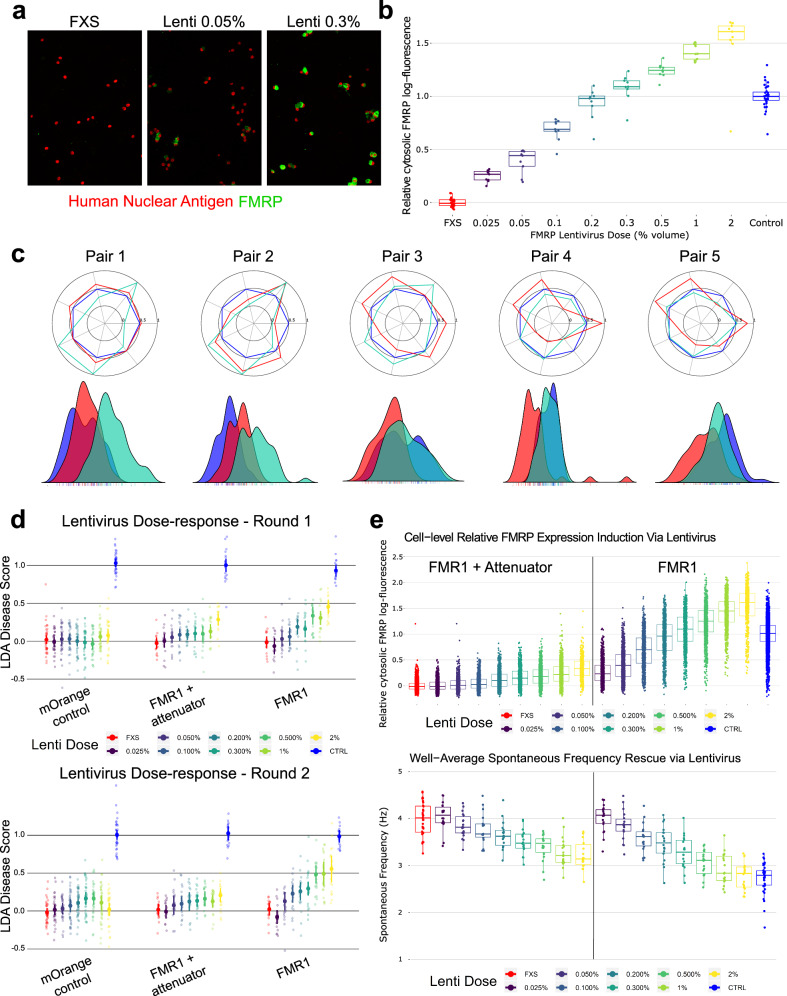
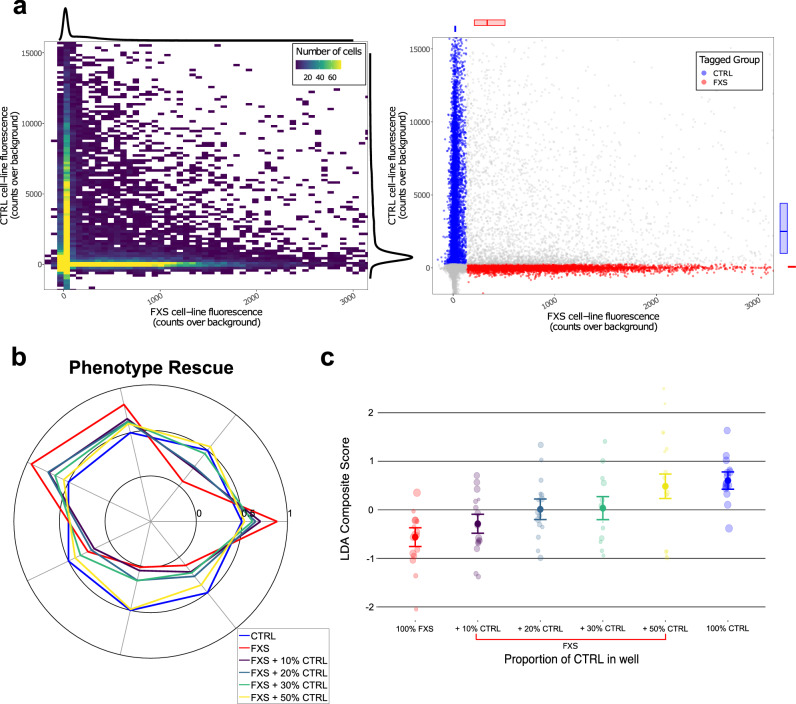
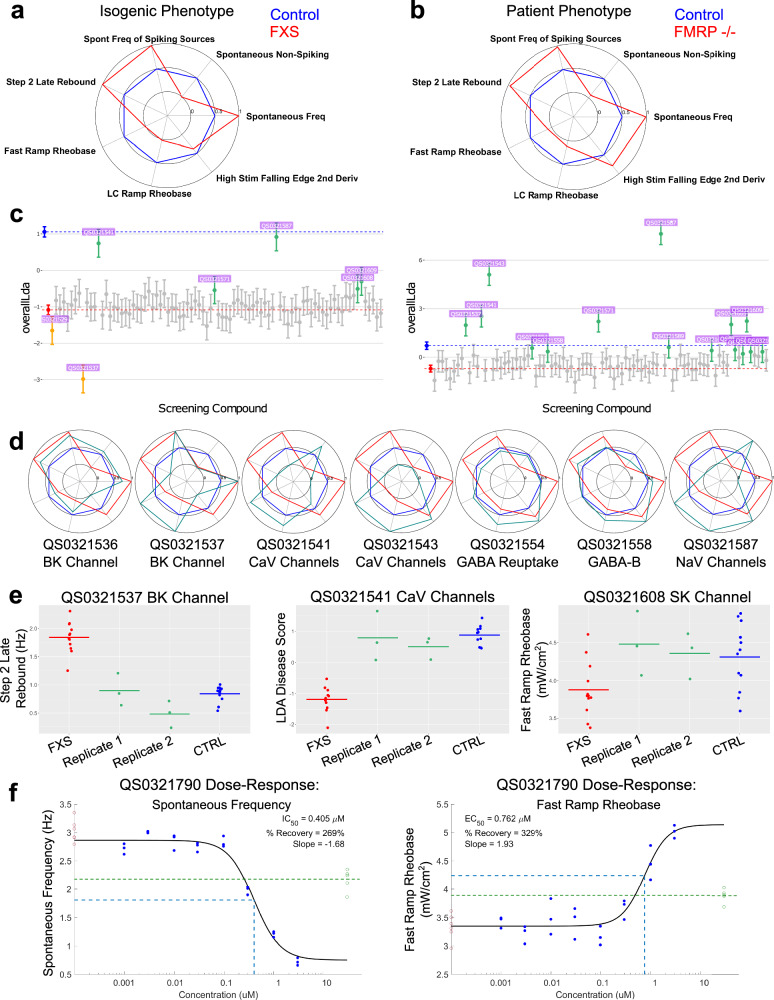
Fragile X syndrome (FXS) is a neurodevelopmental disorder caused by hypermethylation of expanded CGG repeats (>200) in the FMR1 gene leading to gene silencing and loss of Fragile X Messenger Ribonucleoprotein (FMRP) expression. FMRP plays important roles in neuronal function, and loss of FMRP in mouse and human FXS cell models leads to aberrant synaptic signaling and hyperexcitability. Multiple drug candidates have advanced into clinical trials for FXS, but no efficacious treatment has been identified to date, possibly as a consequence of poor translation from pre-clinical animal models to human. Here, we use a high resolution all-optical electrophysiology platform applied to multiple FXS patient-derived and CRISPR/Cas9-generated isogenic neuronal cell lines to develop a multi-parametric FXS disease phenotype. This neurophysiological phenotype was optimized and validated into a high throughput assay based on the amount of FMRP re-expression and the number of healthy neurons in a mosaic network necessary for functional rescue. The resulting highly sensitive and multiparameter functional assay can now be applied as a discovery platform to explore new therapeutic approaches for the treatment of FXS.


Conflict of interest statement

J.J.F., K.H., S.J.R., J.J., J.G., L.A.W., and G.T.D. are current employees of Quiver Bioscience and may hold stock options in Quiver Bioscience. D.G. was an employee of Q-State Bioscience, is currently a consultant for Quiver Bioscience and has received stock options in Quiver Bioscience. E.N., C.F., M.B., B.F. are current employees of Vertex Pharmaceuticals Inc. and hold stock in Vertex Pharmaceuticals Inc. N.D.B. is a former employee of Q-State Biosciences and may be an inventor on relevant patents, but holds no financial stake, stock, or options. M.F.B. is a co-founder of Allos Pharma, and a consultant and owner of stock options for Addex Therapeutics and Luminopia. H.U. and H.S. are current employees of Wave Life Sciences and report stock ownership in Wave Life Sciences. R.P.D. was employed at Vertex Pharmaceuticals at the time of the study, is a current employee of Intellia Therapeutics, and reports stock ownership in Intellia Therapeutics. Elizabeth Berry-Kravis has received funding from Acadia, Alcobra, AMO, Asuragen, Avexis, Biogen, BioMarin, Cydan, Engrail, Erydel, Fulcrum, GeneTx, GW, Healx, Ionis, Jaguar, Kisbee, Lumos, Marinus, Moment Biosciences, Neuren, Neurogene, Neurotrope, Novartis, Orphazyme/Kempharm, Ovid, PTC Therapeutics, Retrophin, Roche, Seaside Therapeutics, Taysha, Tetra, Ultragenyx, Yamo, Zynerba, and Vtesse/Sucampo/Mallinckrodt Pharmaceuticals, to consult on trial design or run clinical or lab validation trials in genetic neurodevelopmental or neurodegenerative disorders, all of which is directed to RUMC in support of rare disease programs; B.-K. receives no personal funds and RUMC has no relevant financial interest in any of the commercial entities listed.

Figures

Fig. 1
Fig. 1. Production and characterization of control cell lines and disease model cell lines lacking FMRP.
a Graphical representation of neuronal production from patient/control subjects and isogenic iPS cell lines to electrophysiologically-active neurons. b Representative high-content confocal image of control-derived neurons showing FMRP in cytoplasm (cyan) compared to patient-derived neurons that show no FMRP. hNuclei: staining for human-specific nuclear antigen (red). c Quantitative ICC showing levels of FMRP across all 10 control clones (from 5 control donors) and all 10 patient clones (from 5 patient donors). Fluorescence in the proximal cytoplasm was estimated for each cell (identified via nuclei) and aggregated to a field-level average, then rescaled such that the median control field = 1. Mean and 95% confidence intervals are shown in black. d qPCR showing average FMR1 expression in each of the lines. Some of the patient lines expressed breakthrough FMR1. The qICC data for these lines indicated that some individual neurons (about 0.5–3%) expressed FMRP while the rest did not.
Fig. 2
Fig. 2. FMRP-dependent electrophysiological FXS phenotypes in iPSC-derived neurons.
a Machine learning-identified intrinsic excitability FXS fingerprint in the isogenic reagents expressed as a radar plot of control (blue) vs. FXS (red). Values reflect the “common language effect size”, a parametric estimate of the probability that a random FXS well exceeds the value of a random CTRL well (where probability = 0.5 is a null effect). b LDA score for control (blue) vs. FXS (red) in the isogenic reagents, see methods for detail. Three FXS clones are represented – two show a distinct phenotype while the third (the peak inside the CTRL distribution) does not. c Radar plots showing the phenotype in isogenic reagents across 3 replicate rounds show consistency across fresh-from-thaw platings of neurons. d Difference in spontaneous frequency (left) and rheobase (right) of control (blue) vs. FXS (red) for each of three rounds. Error bars represent 95% confidence intervals around the well-level estimates. e LDA scores for family-matched controls vs. patient neurons from 5 different patient/control cell lines (labeled Pair 1 to Pair 5). Each Pair includes the average of 2 control clones and 2 patient clones. Radar plots for the FXS fingerprints are depicted in the inset. Data for 3 rounds is shown.
Fig. 3
Fig. 3. Use of FMR1 lentiviruses to establish FMRP levels needed to rescue FXS phenotypes.
a Representative high-content confocal images showing dose-sensitive restoration of FMRP expression in FXS neurons. At low doses (e.g., 0.05% volume), only some neurons express FMRP after transduction. At higher doses, nearly every neuron expresses FMRP, but increased lentivirus doses increase average per-cell expression. b Quantitative ICC showing amount of FMRP introduced via the lentivirus across a range of doses. Fluorescence in the proximal cytoplasm was estimated for each cell (identified via nuclei) and aggregated to a field-level average, then log-transformed and rescaled such that the on-plate control group = 1, after which data from all plates were combined. c Radar plots showing the FXS phenotype (red) vs CTRL wells (blue) alongside FXS + lentivirus at a single 1% by-volume dose (teal) for each of the five patient-control pairs (both clones for each donor). Values reflect the common language effect size. Beneath is the LDA scores for each group, fit over the isogenic phenotype and applied to each patient-control pair. d LDA score for isogenic FMR1−/y neurons treated with 8 increasing doses (represented as % volume of lentivirus) of either an mOrange fluorescent tag, an attenuated form of FMR1, or a full-strength FMR1, for each of two replicate rounds (round 1 top, round 2 bottom) plated fresh-from-thaw. For each lentivirus condition, lentivirus treated neurons were compared to undosed FXS and CTRL neurons from the same row on the 96-well plate. e Top: Quantitative ICC of FMRP fluorescence of control neurons (blue) and FXS neurons (red) treated with 8 increasing doses (represented as % volume of lentivirus) of either an FMR1 lentivirus (right) or attenuated FMR1 lentivirus (left). Each dot is a neuron. Fluorescence in the proximal cytoplasm was estimated for each cell (identified via nuclei) and aggregated to a field-level average, then log-transformed and rescaled such that the on-plate control group = 1, after which data from all plates were combined. Bottom: Rescue of Spontaneous Frequency phenotype in optical electrophysiology analysis from the same round of data, with the same conditions. Each dot is a well (to better see the change in a subtle phenotype).
Fig. 4
Fig. 4. Modulation of electrophysiological FXS phenotypes via mosaic co-cultures.
a Left: 2D histogram showing the number of cells fluorescing in each of the tag channels (where the orthogonal expression is apparent in the vertical and horizontal ridges) with colors aliased at a max of 75 cells per bin to prevent washout by the high-density peak of non-fluorescers, with 1D kernel density estimates over cells for each channel along the margins. Right: every individual cell in the same data set, color-coded to indicate the assigned tag label, with FXS labels in red and CTRL labels in blue, and ambiguous or non-fluorescing cells in gray. b Radar plot showing the dose-dependent rescue of the phenotype in isogenic reagents via increasing proportions of CTRL neurons in well. Values reflect the common language effect size. Only FXS neurons are reflected in the data from the co-cultured wells (meaning that these data show rescue specifically in cells that do not express FMRP, rather than simply of the overall network which includes CTRL neurons). Neurons are under synaptic blockade at the time of imaging but spent the prior >29 days in vitro without synaptic blockers. c LDA score for 100% control (blue) vs. 100% FMR1−/y (red) and increasing amounts of WT neurons in the network (purple, dark green, light green, yellow). Error bars indicate standard error. Points are well-averages. Point size reflects sample weight (square root of number of quality FXS neurons identified via fluorescent tag in that well). Only FXS neurons are reflected in the data from the co-cultured wells.
Fig. 5
Fig. 5. Small molecule screen identifies multiple hits and targets for therapeutic development.
a Recapitulation of the FXS electrophysiological fingerprint in isogenic neurons measured in a sentinel plate on the day of screening. Values on the radar plot reflect the common language effect size. b Recapitulation of the FXS electrophysiological fingerprint in patient/control neurons measured in a sentinel plate on the day of screening. Values on the radar plot reflect the common language effect size. c The LDA score for on-plate control (blue), on-plate FXS (red), and FXS neurons treated with 86 unique small molecule compounds for the isogenic reagents (left) and a representative patient/control pair (right). All hits identified as green on the graph. Anti-hits marked in yellow-orange. Bars are 95% confidence intervals. d Radar plots for 7 example small molecule compound hits represented as green on each radar plot compared to the control (blue) vs. FMR1−/y (red) FXS fingerprint. For each example hit, the compound ID and molecular target are listed. e Rebound spike rate (left), LDA score (middle) and rheobase (right) for different example compound hits plotted per well and separated by replicate plates. f Dose-response graphs for spontaneous frequency (left) and rheobase (right) for an example compound on the isogenic cell lines. On-plate controls shown in red (FXS, left) and green (CTRL, right), with the dose and the response of the EC50/IC50 marked with dotted blue line. Dotted green line is the mean of the controls.

References

    1. Lozano, R., Rosero, C. A. & Hagerman, R. J. Fragile X spectrum disorders. Intractable & Rare Diseases Research, 10.5582/irdr.2014.01022 (2014). - PMC - PubMed
    1. Penagarikano, O., Mulle, J. G. & Warren, S. T. The Pathophysiology of Fragile X Syndrome. Annual Review of Genomics and Human Genetics, 10.1146/annurev.genom.8.080706.092249 (2007). - PubMed
    1. Hagerman, R. J. et al. Fragile X syndrome. Nat. Rev. Dis. Prim.3, 17065 (2017). - PubMed
    1. Verkerk, A. J. et al. Identification of a gene (FMR-1) containing a CGG repeat coincident with a breakpoint cluster region exhibiting length variation in fragile X syndrome. Cell65, 905–914 (1991). - PubMed
    1. Darnell, J. C. et al. FMRP stalls ribosomal translocation on mRNAs linked to synaptic function and autism. Cell146, 247–261 (2011). - PMC - PubMed

MeSH terms

Substances

LinkOut - more resources