. 2024 Nov 6;14(1):26883.
doi: 10.1038/s41598-024-78440-0.

A novel approach to engineering three-dimensional bladder tumor models for drug testing

Affiliations

A novel approach to engineering three-dimensional bladder tumor models for drug testing

C U Monjaras-Avila et al. Sci Rep. .

Abstract

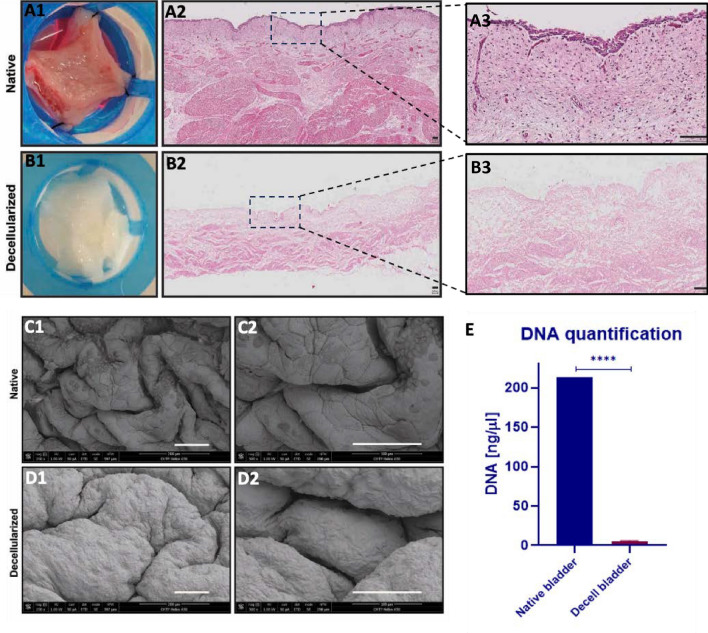
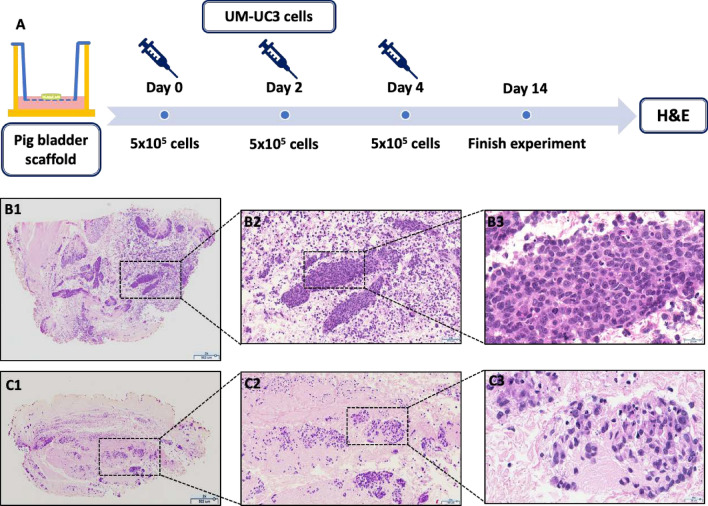
Bladder cancer (BCa) poses a significant health challenge, particularly affecting men with higher incidence and mortality rates. Addressing the need for improved predictive models in BCa treatment, this study introduces an innovative 3D in vitro patient-derived bladder cancer tumor model, utilizing decellularized pig bladders as scaffolds. Traditional 2D cell cultures, insufficient in replicating tumor microenvironments, have driven the development of sophisticated 3D models. The study successfully achieved pig bladder decellularization through multiple cycles of immersion in salt solutions, resulting in notable macroscopic and histological changes. This process confirmed the removal of cellular components while preserving the native extracellular matrix (ECM). Quantitative analysis demonstrated the efficacy of decellularization, with a remarkable reduction in DNA concentration, signifying the removal of over 95% of cellular material. In the development of the in vitro bladder cancer model, muscle invasive bladder cancer patients' cells were cultured within decellularized pig bladders, yielding a three-dimensional cancer model. Optimal results were attained using an air-liquid interface technique, with cells injected directly into the scaffold at three distinct time points. Histological evaluations showcased characteristics resembling in vivo tumors derived from bladder cancer patients' cells. To demonstrate the 3D cancer model's effectiveness as a drug screening platform, the study treated it with Cisplatin (Cis), Gemcitabine (Gem), and a combination of both drugs. Comprehensive cell viability assays and histological analyses illustrated changes in cell survival and proliferation. The model exhibited promising correlations with clinical outcomes, boasting an 83.3% reliability rate in predicting treatment responses. Comparison with traditional 2D cultures and spheroids underscored the 3D model's superiority in reliability, with an 83.3% predictive capacity compared to 50% for spheroids and 33.3% for 2D culture. Acknowledging limitations, such as the absence of immune and stromal components, the study suggests avenues for future improvements. In conclusion, this innovative 3D bladder cancer model, combining decellularization and patient-derived cells, marks a significant advancement in preclinical drug testing. Its potential for predicting treatment outcomes and capturing patient-specific responses opens new avenues for personalized medicine in bladder cancer therapeutics. Future refinements and validations with larger patient cohorts hold promise for revolutionizing BCa research and treatment strategies.

Keywords: Bladder cancer; Cancer model; Decellularization; Recellularization; Tissue engineering.


Conflict of interest statement

The authors declare no competing interests.

Figures

Fig. 1
Fig. 1
Macroscopic visualization and histological examination of native (A1, A2, A3) and decellularized (B1, B2, B3) bladders. (A1) Macroscopic native pig bladder. (B1) Macroscopic decellularized pig bladder. H&E stains: native (A2) and decellularized (B2) bladder with 4X magnification. (A3) Native bladder square with 20X magnification. (B3) Decellularized bladder square with 20X magnification. Scale bars in panels A2, A3, B2 and B3 represent 100 μm. Structural analysis of native and decellularized bladders. SEM images: urothelium of native bladder (C1) (250X) and (C2). Basement membrane (lamina propria) of decellularized bladder (D1) (250X) and (D2) (500X). DNA Quantification of native and decellularized bladders. Native bladders have mean DNA concentration of 213.8 ng/μL (n = 4) and decellularized bladders have mean DNA concentration of 4.65 ng/μL (n = 4). Statistical analysis was performed using the unpaired t test, p < 0.0001 (E).
Fig. 2
Fig. 2
Bladder cancer model using a decellularized pig bladder. (A1) Protocol used to recreate a 3D cancer model using a decellularized pig bladder as a scaffold with UM-UC3 cells. Hematoxylin and eosin staining of a recellularized pig bladder transverse section with 2X magnification (B1), 20X (B2) and 40X (B3). Hematoxylin and eosin staining of a recellularized pig bladder longitudinal section with 2X magnification (C1), 20X (C2) and 40X (C3).
Fig. 3
Fig. 3
UM-UC3 cell viability in standard culture methods. Dose–response curves between different cisplatin (A) and gemcitabine (B) concentrations and cell viability of UM-UC3 cells in 2D culture. Dose–response to different doses of cisplatin (C) and gemcitabine (D) using UM-UC3 spheroids as a 3D culture. Cell viability rates were determined by using MTS assay. The results are expressed as the percentage of the viability rate of control cells. All values are represented as the means ± SD of three independent experiments. (E) UM-UC3 spheroids were treated with increasing doses of cisplatin and gemcitabine, which correlates with graphs C and D. Spheroids were made of 20,000 cells per spheroid. Bars = 1000 μm (4X objective lens).
Fig. 4
Fig. 4
Drug testing of 3D Bladder cancer model. (A) Scheme of the protocol used to recreate a 3D cancer model using a decellularized pig bladder as a scaffold with UM-UC3 cells, and the treatment time points. (B) Bioluminescence assay to measure the viability of UMUC3 cells in the 3D cancer models treated with cisplatin (B1), gemcitabine (B2) and a combination (B3), that correlates with the histology. (C) Representative Histology of 3D cancer tumors receiving no treatment, and 0.5, 1.0, 5.0 and 25 μM of cisplatin. The first column shows H&E staining, the second Ki67, and the last column is a TUNEL assay. (D) Representative Histology of 3D cancer tumors receiving no treatment, and 0.005, 0.005, 0.5 and 5 μM of gemcitabine. The first column shows H&E staining, the second Ki67, and the last column is a TUNEL assay. (E) Representative Histology of 3D cancer tumors receiving no treatment, and different dose combinations of cisplatin and gemcitabine. The first column shows H&E staining, the second Ki67, and the last column is a TUNEL assay. Big boxes bars = 100 μm (10X objective lens) and small boxes Bars = 25 μm (40X objective lens).
Fig. 5
Fig. 5
Genetic validation Representative graph of a cancer model from patient. The most characteristic gene mutations keep after 21 days in culture.
Fig. 6
Fig. 6
MTS Assay of Bladder Cancer 3D tumor model. Representative histology of 3D cancer tumors in two patients receiving no treatment, and a standard dose of Cis and combination Cis/Gem. The first column shows H&E staining, the second Ki67, and the last column is a TUNEL assay. Patient Px_01 respond to treatment (C) while Px_03 does not respond (D). Big boxes bars = 100 μm (10X objective lens) and small boxes Bars = 25 μm (40X objective lens). MTS assay to measure the viability of patient cancer cells in the 3D cancer models treated with Cis and Cis/Gem, in all MIBC cases. Three patients showed a sadistically significant decrease in viability with treatment (A), and the ten other patients did not show response to treatment (B).
Fig. 7
Fig. 7
Drug dose–response curve in 2D and 3D models. Drug dose–response curves for Cis (A-B) and combination Cis/Gem (C-D) using bladder cancer tumor cells from patients. Patient cells were cultured in a monolayer (2D culture) and spheroids (3D culture) and then treated with four cisplatin doses for 72 h for 2D culture and 2 cycles of treatment of 72 h each. Percentage of viability values for cisplatin and gemcitabine treatments at 72 h for 2D culture and 6 days for 3D culture. Response to treatment was considered when there is a statistically significant change with respect to the control with no treatment. Results are expressed as mean ± SD (n = 3).

References

    1. Sung, H. et al. Global cancer statistics 2020: GLOBOCAN estimates of incidence and mortality worldwide for 36 cancers in 185 countries. CA: A Cancer J. Clin.71(3), 209–249. 10.3322/caac.21660 (2021). - PubMed
    1. Canadian Cancer Statistics Advisory Committee in collaboration with the Canadian Cancer Society, Statistics Canada and the Public Health Agency of Canada. Canadian Cancer Statistics 2023. Toronto, ON: Canadian Cancer Society; 2023. Available at: cancer.ca/Canadian-Cancer-Statistics-2023-EN
    1. Brenner, D. R. et al. Projected estimates of cancer in Canada in 2022. Can. Med. Assoc. J.194(17), E601–E607. 10.1503/cmaj.212097 (2022). - PMC - PubMed
    1. Van Rhijn, B. W. G. et al. Recurrence and progression of disease in non–muscle-invasive bladder cancer: From epidemiology to treatment strategy. Eur. Urol.56(3), 430–442. 10.1016/j.eururo.2009.06.028 (2009). - PubMed
    1. Gupta, S., Gill, D., Poole, A. & Agarwal, N. Systemic immunotherapy for urothelial cancer: Current trends and future directions. Cancers9(12), 15. 10.3390/cancers9020015 (2017). - PMC - PubMed

MeSH terms

Grants and funding