. 2024 Nov;635(8039):746-754.
doi: 10.1038/s41586-024-08146-w. Epub 2024 Nov 6.

Cellular ATP demand creates metabolically distinct subpopulations of mitochondria

Affiliations

Cellular ATP demand creates metabolically distinct subpopulations of mitochondria

Keun Woo Ryu et al. Nature. 2024 Nov.

Abstract

Mitochondria serve a crucial role in cell growth and proliferation by supporting both ATP synthesis and the production of macromolecular precursors. Whereas oxidative phosphorylation (OXPHOS) depends mainly on the oxidation of intermediates from the tricarboxylic acid cycle, the mitochondrial production of proline and ornithine relies on reductive synthesis1. How these competing metabolic pathways take place in the same organelle is not clear. Here we show that when cellular dependence on OXPHOS increases, pyrroline-5-carboxylate synthase (P5CS)-the rate-limiting enzyme in the reductive synthesis of proline and ornithine-becomes sequestered in a subset of mitochondria that lack cristae and ATP synthase. This sequestration is driven by both the intrinsic ability of P5CS to form filaments and the mitochondrial fusion and fission cycle. Disruption of mitochondrial dynamics, by impeding mitofusin-mediated fusion or dynamin-like-protein-1-mediated fission, impairs the separation of P5CS-containing mitochondria from mitochondria that are enriched in cristae and ATP synthase. Failure to segregate these metabolic pathways through mitochondrial fusion and fission results in cells either sacrificing the capacity for OXPHOS while sustaining the reductive synthesis of proline, or foregoing proline synthesis while preserving adaptive OXPHOS. These findings provide evidence of the key role of mitochondrial fission and fusion in maintaining both oxidative and reductive biosyntheses in response to changing nutrient availability and bioenergetic demand.


Conflict of interest statement

Competing interests: C.M.R. has consulted regarding oncology drug development with Amgen, AstraZeneca, Chugai, D2G, Daiichi Sankyo, Hoffman-La Roche, Jazz and Legend, and serves on the scientific advisory boards of Auron, Bridge Medicines, DISCO, Earli and Harpoon Therapeutics. C.B.T. is a founder of Agios Pharmaceuticals, and is on the board of directors of Regeneron and Charles River Laboratories. The remaining authors declare no competing interests.

Figures
Extended Data Figure 1.
Extended Data Figure 1.. Increasing OXPHOS does not alter proline synthesis in proliferating cells.
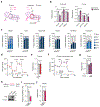
a. Schematic representation of cellular energy metabolism. Cells cultured in a glucose-rich environment produce ATP through both glycolysis and mitochondrial respiration (left panel). Substituting glucose with galactose or depriving glucose compels cells to primarily generate ATP through glutamine dependent OXPHOS (right panel). b. Steady-state intracellular glutamate and proline level measured by GC-MS in 10T1/2, HCT116 and PANC1 cells cultured in glucose medium (Glc) or galactose medium (Gal) for 8 hours. c. Fractional labelling of indicated metabolites from [U-13C] glutamine. MEFs were cultured in medium containing glucose or galactose or medium without glucose for 8 hours. Isotope labeled glutamine was added in the last 4 hours of the experiments. Note that these labelling are data from Fig. 1g and Fig. 1h replotted as percentages of all isotopologue distributions. αKG, α-ketoglutarate; Glc, glucose; Gal, galactose; – Glc, glucose deficient. d. OCR measured by Seahorse analyzer in MEFs either treated with PBS (Con) or 20 mM D-lactate (D-lac) for 2 hours prior to the measurement (mean ± s.d. n = 5 independent replicates). Oligo, oligomycin; FCCP, carbonyl cyanide-p-trifluoromethoxyphenylhydrazone; Rot, rotenone; AA, antimycin A. e. Steady-state proline level measured by GC-MS in MEF treated with PBS (Con) or 20 mM D-lactate (D-lac) for 8 hours. f. OCR measured by Seahorse analyzer in MEFs treated with vehicle (DMSO) or 1μM FCCP (mean ± s.d. n = 4 independent replicates). Rot, rotenone; AA, antimycin A. g. Intracellular proline level measured by GC-MS in MEFs treated with vehicle (−) or increasing amount of FCCP (0.5 and 1 μM, respectively) for 8 hours. h. Schematic depicting the reaction catalyzed by LbNOX (top) and confirmation of LbNOX expression in U2OS cells via western blot. LbNOX expression is detected using an anti-FLAG tag antibody. Vinculin is used as a loading control. Cells were induced to express LbNOX by treatment with doxycycline (500 ng/mL) for 24 hours. i. NADH/NAD+ ratio in U2OS cells expressing LbNOX. Cells were treated with doxycycline (500 ng/mL) for 48 hours. j. Steady-state proline level in U2OS expressing LbNOX measured by GC-MS. Cells were treated with doxycycline (500 ng/mL) for 48 hours. Data are shown as mean ± s.d. n = 3 independent replicates unless otherwise noted. Significance was assessed using two-way ANOVA (b) with Sidak’s multiple-comparisons post-test relative to the controls, two-tailed t-tests (e, i and j) and one-way ANOVA (g) with Tukey’s multiple comparisons test.
Extended Data Figure 2.
Extended Data Figure 2.. P5CS is an essential enzyme for proline biosynthesis.
a. Western blot of MEF (left panel) and U2OS cells (right panel) in which CRISPR/Cas9-mediated editing was used to target Aldh18a1 (gene name for P5CS) and data for 2 edited clones shown, (hereafter sgP5CS-1 and sgP5CS-2). ROSA26 locus (sgCon for MEF) is used as control (Con) or silent gene PRM1 (sgCon for U2OS) were used as control (Con). Vinculin and Actin are used as loading controls. b, c. Steady-state level of intracellular glutamate and proline measured by GC-MS in MEF (b) and U2OS (c) cells expressing sgCon, sgP5CS-1, and sgP5CS-2. d. Cell proliferation of indicated U2OS cells after 4 days of culture. All cells were cultured in DMEM, which lacks proline (− Pro) or DMEM supplemented with 1 mM proline (+ Pro). Proliferation rate was measured as population doublings per day. e. to g. Western blot (e), steady-state proline level measured by GC-MS (f), and cell proliferation (g) of U2OS cells expressing sgCon, sgP5CS-1 or sgP5CS-1 with an ectopically expressing flag-tagged P5CS cDNA. The P5CS cDNA is resistant to sgP5CS-1-mediated CRISPR-Cas9 genome editing. For proliferation in f, cells were cultured in DMEM (− Pro) or DMEM supplemented with 1 mM proline (+ Pro) for 4 days. Actin is used as a loading control in e. Data are shown as mean ± s.d. n = 3 independent replicates. Significance was assessed using one-way ANOVA (b, c, f) with Tukey’s multiple comparisons test.
Extended Data Figure 3.
Extended Data Figure 3.. The reversible clustering of P5CS within mitochondria occurs in cells with an increased demand for OXPHOS
a. Representative immunostained images of endogenous P5CS and TOM20 in indicated cell lines cultured in galactose medium for 8 hours. b. Western blot analysis of whole cell (Input) or anti-HA immunopurified mitochondria (Mito-IP) of 293T cells expressing HA-tagged OMP25 or the Myc-tagged OMP25 as control. All cells are cultured in glucose or galactose containing media for 8 hours. In addition to immunoblotting for P5CS, immunoblotting was performed for Lamin A as a representative nuclear protein, β-Tubulin as a representative cytosolic protein, citrate synthase (CS) as a representative mitochondrial protein, GOLGA1 as a representative Golgi protein, cathepsin C (CTSC) as a representative lysosomal protein, and calreticulin (CALR) as a representative ER protein. ER, endoplasmic reticulum. c. Representative immunostaining of endogenous P5CS with mitochondrial inner membrane protein TIM23. MEFs were cultured in galactose for 8 hours. The 3D reconstructed view of the gated area is shown to the right of the enlarged image. d, e. Representative images of MEFs stained for endogenous P5CS and intermembrane space protein adenylate kinase 2 (AK2), matrix-localized enzymes citrate synthase (CS) and glutaminase 1 (GLS1) and P5CS. MEFs were cultured in galactose for 8 hours. f. Representative immunostaining of endogenous P5CS and TOM20 in MEFs treated with 20 mM D-lactate or 1μM FCCP for 8 hours. g. Representative immunofluorescence images of endogenous P5CS and TOM20 in MEFs expressing tamoxifen-inducible MYC (MYC-ER). MEFs were serum starved for 48 hours and treated with 200 nM 4-hydroxytamoxifen (4-OHT) for 8 hours. h. Immunostaining of endogenous P5CS and TOM20 in U2OS cells expressing LbNOX. Cells were treated with doxycycline (500 ng/mL) for 24 hours prior to fixation. i. Time-lapse imaging of P5CS-GFP in MEF upon serum activation. MEFs were cultured in serum-free media overnight and then maintained in media containing 1% FBS for an additional 24 hours to induce quiescence. For serum stimulation, a final concentration of 10% FBS was added to quiescent MEFs immediately before live-cell imaging to track the clustering of P5CS-GFP. Mitochondria were labeled with the mitochondria-targeted mScarlet protein (Mito). j. Western blot showing the expression of mutant P5CS in MEFs. The presence of the Flag-tag confirms the expression of the mutant protein. Vinculin is used as a loading control. k. Representative live-cell images of P5CS-GFP in MEFs cultured in galactose. Shown is the reduction in P5CS-GFP filaments over a 4-hour time-lapse movie upon addition of 5 mM ornithine and 5 mM proline. For all immunostaining, DAPI was used to stain the nucleus. Scale bars, 5 μm for all images and 2 μm for all insets.
Extended Data Figure 4.
Extended Data Figure 4.. P5CS forms filamentous structures within mitochondria in vivo.
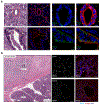
a. Representative hematoxylin and eosin (H & E) staining along with cytokeratin (CK) and P5CS immunostaining, showing normal and tumor areas from a surgical specimen. b. Representative H&E staining along with P5CS and TOM20 immunostaining of two different areas from a surgical specimen, the tumor (area 1) and the surrounding normal tissue (area 2) are shown at different magnifications as indicated. The nuclei were stained with DAPI. Scale bars, 20 μm (a, left four panels and b, four right panels), 10 μm (a, four right panels) and 200 μm (b, left H & E panel).
Extended Data Figure 5.
Extended Data Figure 5.. P5CS-containing mitochondria exhibit distinct molecular features.
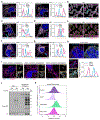
a. Representative immunostained images of endogenous P5CS, ATP synthase (ATP5B), and TOM20 in 10T1/2 (left panel) and U2OS (right panel). All cells were cultured in galactose media for 8 hours. Corresponding fluorescence pixel intensity plots for the orange lines in gated images are shown for each cell line. b. Representative three-dimensional reconstruction of z-stack images showing immunofluorescence staining for P5CS and ATP5B in MEFs cultured in galactose medium for 8 hours. TIM23 was used to label the mitochondrial inner membrane. c, d. Representative images of endogenous P5CS, ATP5B and TOM20 in MEFs treated with 20 mM D-lactate (c) or 1 μM FCCP (d) for 8 hours. Fluorescence pixel intensity for the orange lines in gated areas are plotted for each condition. e. Representative three-dimensional reconstruction of z-stack images in MEFs treated with 1 μM FCCP for 8 hours using Imaris software showing endogenous P5CS, ATP5B, and TOM20 to label the mitochondrial outer membrane. f, g. Representative immunostained images of P5CS, ATP5B, and TOM20 in U2OS cells expressing LbNOX (f) or MEFs expressing MYC-ER (g). Cells were treated with doxycycline (500 ng/ml) for 24 hours to induce expression of LbNOX (f) or with 200 nM 4-hydroxytamoxifen for 8 hours to activate MYC (g). Corresponding fluorescence pixel intensity plots for the orange lines in the gated images are shown. h. Immunostaining of P5CS, ATP5A1, and TOM70 in a human PDAC specimen. Enlarged views of the boxed area are shown below. Fluorescence pixel intensity for the orange line in the boxed area is plotted on the right, next to the enlarged images. i. Representative immunostained images of P5CS with ETC complex (complex I) or ETC complex subunits (SDHA for complex II, MT-COI for complex IV) in MEFs cultured in galactose medium for 8 hours. j. Western blot analysis of whole-cell lysates (Input) or streptavidin pulldown proteins from MEF expressing V5-tagged OSCP-TurboID. Cells were cultured in media with or without 5 mM ornithine and proline, as described in Fig. 3e–f and biotinylation activity was analyzed by streptavidin–HRP blotting. MEFs omitting biotin (− Bio) were used as a negative control. Molecular weights are indicated. k. TMRE signal intensity distribution of mitochondria isolated from MEFs expressing P5CS-GFP. GFP signal was used to distinguish mitochondria containing P5CS (P5CS-GFP+) from mitochondria lacking P5CS (P5CS-GFP). To confirm membrane potential dependent enrichment of TMRE in isolated mitochondria, mitochondria were treated with 20 μM FCCP for 30 min as an additional control. Scale bars, 5 μm for all images and 1 μm for all insets.
Extended Data Figure 6.
Extended Data Figure 6.. Evidence for mitochondrial subpopulations in glutamate-dependent reductive synthesis following increased oxidative demand.
a. Schematic representation showing separation of oxidative glutamate metabolism from reductive pathways. Glutamine-derived glutamate can be oxidized in mitochondria in the TCA cycle to support ATP synthesis or undergo reduction to generate proline and ornithine. b. Schematic diagram of [U-13C] glutamine tracing to assess separation of oxidative and reductive metabolism. Isotope-labeled glutamine can be deaminated and oxidized in the TCA cycle to generate M+4 malate. In a physically connected environment, malate M+4 can leave the TCA cycle (oxidative pathway) as glutamate M+3 and contribute to reductive synthesis of proline M+3, ornithine M+3, and putrescine M+2 (left). However, separation of reductive pathways from oxidative pathways into two distinct mitochondrial subpopulations makes it difficult for TCA cycle to contribute to the reductive pathway (right). c. Relative fractional enrichment of proline and putrescine derived from malate M+4 in proliferating MEFs cultured in glucose- or galactose-containing media for 8 hours. For each condition, the degree to which proline, ornithine and putrescine is derived from the oxidative TCA cycle can be represented as the ratio of each metabolite (M+3 proline, M+3 ornithine, M+2 putrescine) relative to malate M+4. Glc, glucose; gal, galactose. d. Schematic depicting the mitochondria-targeted LbNOX (mitoLbNOX) catalyzed reaction within mitochondria (top). Western blot confirming the expression of LbNOX and mitoLbNOX in U2OS cells. Vinculin is used as a loading control. e. Representative immunostained images of mitoLbNOX (Flag), P5CS, and TOM20 in U2OS cells expressing mitoLbNOX. Cells were treated with doxycycline (500 ng/ml) for 24 hours. f, g. Intracellular NADH/NAD+ ratio measured by cycling assay (f) and steady-state proline levels measured by GC-MS (g) in U2OS cells expressing empty vector, LbNOX, or mitoLbNOX. All cells were treated with doxycycline (500 ng/ml) for 24 hours. Data are mean ± s.d. n = 3 independent replicates. Significance was assessed using two-tailed t-tests (c and d) and one-way ANOVA (f and g) with Tukey’s multiple comparisons test.
Extended Data Figure 7.
Extended Data Figure 7.. Absence of defined cristae structures in P5CS-containing mitochondria.
a. Representative CLEM images of MEFs expressing P5CS-GFP and mitoDsRed. Corresponding TEM images of the gated area are shown to the right of the confocal images. Blue arrows indicate P5CS-GFP-positive mitochondria, while magenta arrows indicate mitochondria lacking P5CS. b. Immunostaining of P5CS, MIC60, and TOM20 in U2OS cells cultured in galactose medium for 8 hours. Fluorescence pixel intensity for the orange line in the boxed area is plotted on the right. c. Representative immunostained images of endogenous P5CS, ATP synthase subunit e (ATP5I), and TOM20 in MEFs. Corresponding fluorescence pixel intensity plots for the orange line in gated image are shown. MEFs were cultured in galactose medium for 8 hours. d. Western blot confirming the expression of OPA1 in wildtype, Opa1−/− and Opa1−/− + OPA1 MEFs. e. Representative immunofluorescence images of endogenous P5CS and ATP5B in wildtype or Opa1−/− MEFs. DAPI was used to stain the nuclei. Scale bars, 1 μm (a), 5 μm for images (b, c and e) and 2 μm (insets in b and c, as well as enlarged images in e)
Extended Data Figure 8.
Extended Data Figure 8.. The role of mitochondrial dynamics in the separation of P5CS from ATP synthase.
a. Time-lapse sequence (in minutes) illustrating the clustering of P5CS-GFP in MEFs through mitochondrial fusion. P5CS-GFP clustering was monitored 7 hours after switching cells to galactose media, capturing two distinct events (white arrows and orange arrows). See also Supplementary Video 2. b, c. Western blot analysis of MEFs defective in mitochondrial fusion. HA-tagged MFN2 (b) or Flag-tagged MFN1 (c) cDNA was introduced to restore the ability of cells to engage in mitochondrial fusion. Actin is used as a loading control. d. Representative immunofluorescence images of endogenous P5CS and ATP5B in Mfn1−/− MEFs expressing either empty vector (Empty) or Flag-tagged MFN1 (MFN1-Flag). MEFs were cultured in galactose medium for 8 hours. e. Western blot of DRP1 expression in wildtype, Drp1−/−, and Drp1−/− MEF rescued with DRP1 cDNA. Actin is used as a loading control. f. Representative immunostained images of endogenous P5CS, ATP5B, and TOM20 from Mff, Fis1, Mid49, Mid51 quadruple knockout (QKO) MEFs cultured in galactose medium for 8 hours. Relative pixel intensity plots corresponding to orange lines in gated area are shown on the right panels of each figure. g. Steady-state proline level measured by GC-MS in wildtype or QKO MEFs. Values are shown relative to the mean of WT MEFs. For all immunofluorescence images, DAPI was used to stain the nucleus. Scale bars are indicated as follows: 5 μm for panels a, d, and f, and 2 μm for all insets and enlarged images within panels a, d, and f. Data are presented as mean ± s.d. from n = 3 independent replicates. Statistical significance was determined using two-tailed t-tests.
Figure 1.
Figure 1.. Mitochondria simultaneously maintain oxidative and reductive metabolism.
a. STRING protein-protein interaction (PPI) network of the genes encoding mitochondrial enzymes. Genes involved in tricarboxylic acid cycle (magenta), glutamate and proline biosynthesis (green and blue, respectively) and one-carbon metabolic process (orange) are derived from the Gene Ontology (GO) database. b. Schematic illustrating the potential oxidative versus reductive fate of mitochondrial glutamate. c. Oxygen consumption rate (OCR) measured in MEFs grown in glucose (Glc) medium, galactose (Gal) medium, or medium lacking glucose (− Glc) for 4 hours using a Seahorse analyzer (mean ± s.d. n = 6 independent replicates). Oligomycin (Oligo) addition is indicated. d, e. NADH/NAD+ ratio (d) and steady-state levels of metabolites (e) measured by LC-MS in MEFs cultured in indicated medium for 8 hours. For each metabolite in e, values are shown as the log2-fold change relative to the mean of the glucose condition according to the indicated color bar. Metabolites from oxidation of glutamate-derived carbons are labeled in magenta, while those from reduction of glutamate are labeled in cyan. αKG, α-ketoglutarate; Mal, malate; Cit, citrate; Pro, proline; Put, putrescine; Glu, glutamate; Gln, glutamine; Arg, arginine. f. Schematic diagram of [U-13C] glutamine tracing. g. Fractional labeling of α-ketoglutarate (αKG) pool by M+5 αKG and malate pool by M+4 malate in MEFs cultured in [U-13C] glutamine at the indicated condition for 8 hours. h. Fractional labeling of proline (Pro) by proline (M+5), ornithine (Orn) by ornithine (M+5) and putrescine (Put) by putrescine (M+4) relative to glutamate M+5 in MEFs cultured in [U-13C] glutamine at indicated conditions for 8 hours. Data are mean ± s.d. n = 3 independent replicates unless otherwise noted. Statistical significance was assessed in comparison to the glucose culture condition using one-way analysis of variance (ANOVA) (d and g) or two-way ANOVA (h) with Tukey’s multiple comparisons test.
Figure 2.
Figure 2.. P5CS forms reversible filaments and sequesters into a subset of mitochondria.
a-b. Representative immunofluorescence images of endogenous P5CS and PDH (PDHA1) (a) and quantification of P5CS filament-positive cells (b) in quiescent or proliferating MEFs. c. Immunostaining of P5CS and TOM20 in galactose-cultured MEFs. Left, 3D reconstruction of the insets; right, corresponding relative pixel intensity plots for the orange line. d. Western blot of P5CS as in a, with Cyclin D1 (proliferation marker) and vinculin (control). e. Mitochondrial area containing P5CS in experiments described in a. >80 cells per condition were analyzed. f. Schematic illustrating characteristics of ectopically expressed mutant P5CS. g. Representative images of MEFs expressing mutant P5CS described in f. P5CS (cyan) represents both endogenous and ectopically expressed mutant P5CS; Flag (magenta), only mutant P5CS. h. Glutamate and proline levels in MEFs expressing the indicated P5CS mutant. For each metabolite, values are presented relative to the mean of the control (empty) replicates. i. Immunostaining of endogenous P5CS and TOM20 in galactose-cultured MEFs with (+ Orn and Pro) or without (control) 5 mM ornithine and proline. j-k. Quantification of P5CS filament-positive cells (j) and mitochondrial area containing P5CS (k) for experiments described in i. >50 cells were subjected to analysis for (k). l. Representative hematoxylin and eosin (H & E) staining and endogenous cytokeratin (CK), P5CS, TOM70 immunostaining of PDAC specimen. m. Quantification of P5CS filament-positive cells in PDAC specimens (n = 6). The nuclei were stained with DAPI. Scale bars, 10 μm (a,g,i and c right panel), 2 μm (insets in a,g,l), 1 μm (insets and 3D image in c), 50 μm (two left), and 20 μm (two right panels) in l. Data presented as mean ± s.d. from n = 3 independent replicates, unless otherwise indicated. Significance, one-way ANOVA (b,h,j,m) with Tukey’s multiple comparisons test or Wilcoxon test (e,k).
Figure 3.
Figure 3.. P5CS filament clusters are present in mitochondria that lack ATP synthase.
a, b. Representative immunostained images of endogenous P5CS, ATP synthase subunit 5B (ATP5B), and TOM20 with the corresponding relative pixel intensity plots for the orange lines in the gated area which is also shown in the enlarged inset (lower left). MEFs were cultured in galactose medium without (a) or with (b) 5 mM ornithine and proline for 8 hours. c. Representative three-dimensional reconstruction of z-stack images from the experiment described in a. d. Representative P5CS and ATP synthase subunit (ATP5A1) immunostained image of human PDAC from patient (left) and corresponding fluorescence pixel intensity plot for the orange line in gated image. Right panels show insets and dotted lines in the middle panel indicate P5CS(+) mitochondria not containing ATP5A1. e. Schematic diagram of proximity labeling using biotin ligase (TurboID) fused to the ATP synthase subunit (OSCP). f. Western blot of the input protein and the streptavidin pulldown in the presence or absence of biotin addition analyzed for individual proteins as indicated. MEFs omitting biotin (− Bio) were used as a negative control. g. Representative live-cell images of MEFs expressing P5CS-GFP stained with TMRE to visualize the mitochondrial membrane potential (ΔΨm). MEFs were cultured in galactose medium for 8 hours before TMRE treatment. h. TMRE intensity of isolated mitochondria containing P5CS-GFP (GFP+) and mitochondria lacking P5CS-GFP (GFP) are shown as the fold change relative to the mean TMRE intensity measured in all mitochondria. Related experiment shown in Extended Data Fig. 5k. The nuclei were stained with DAPI. Scale bars, 5 μm for all images and 1 μm for all insets. Data are mean ± s.d. n = 3 independent replicates unless otherwise noted. Significance was assessed using two-tailed t-tests for h.
Figure 4.
Figure 4.. P5CS-containing mitochondria exhibit absence of cristae structure.
A, b. Representative CLEM images of MEFs expressing P5CS-GFP (green) and mitochondria-targeted red fluorescence protein (mitoDsRed, red). A confocal microscopy image (left panel) overlaid on an aligned transmission electron microscopy (TEM) image (right panel) is shown in the inset (a). Enlarged TEM images corresponding to the gated areas are displayed on the right (a) or shown below (b). MEFs were cultured in galactose medium for 8 hours. White arrows in b indicate mitochondria positive for P5CS-GFP (see Extended Data Fig. 7a for further examples). c. Representative immunostained images of endogenous P5CS (cyan), MIC60 (magenta), and TOM20 (gray) from MEFs cultured in galactose medium for 8 hours. Relative pixel intensity plots corresponding to orange lines in the gated area are shown in the right panel. d. Immunofluorescence images of PDAC specimens stained for endogenous P5CS (cyan), MIC60 (magenta) and TOM70 (gray). An enlarged view of the inset is shown on the right, with dotted lines indicating P5CS-positive mitochondria. e. Representative TEM images showing mitochondria from wildtype and Opa1−/− MEFs. f. OCR measured by Seahorse analyzer in indicated MEFs (mean ± s.d. n = 6 independent replicates). Oligo, oligomycin; Rot, rotenone; FCCP, carbonyl cyanide-p-trifluoromethoxyphenylhydrazone; AA, antimycin a. g, h. Steady-state (g) and isotope labeled metabolites levels (h) measured by LC-MS in the indicated MEFs. For isotope tracing, MEFs were cultured in [U-13C] glutamine for 8 hours. Values for each metabolite are presented relative to the mean of the wildtype replicates. The nuclei were stained with DAPI. Scale bars, 1 μm (a, b and e), 5 μm (c and d) and 2 μm (insets in c and d). Data presented as mean ± s.d. from n = 3 independent replicates, unless otherwise indicated. Significance was assessed using one-way ANOVA (g and h) with Tukey’s multiple comparisons test.
Figure 5.
Figure 5.. The mitochondrial fusion and fission cycle creates metabolically distinct subpopulations.
a. Schematic illustration of proteins involved in mitochondria fusion and fission. b. Time-lapse sequence (in minutes, min) showing the clustering of P5CS-GFP in MEFs via mitochondria fusion. Mitochondria are labeled with mitoDsRed. c. Immunostaining of P5CS and ATP5B in indicated MEFs cultured in galactose medium. d. OCR measured by Seahorse analyzer in indicated MEFs (n = 5). e. Cell proliferation of MEFs cultured in the indicated medium for 4 days. f. NADH/NAD+ ratio measured by LC-MS in the indicated MEFs. g, h. Steady-state levels of metabolites measured by GC-MS (g) or LC-MS (h) in the indicated MEFs. For each metabolite, values are shown relative to the mean of WT MEFs (g) or WT MEFs cultured in glucose (h). αKG, α-ketoglutarate; Glc, glucose; Gal, galactose. i, j. Immunostaining of endogenous P5CS, ATP5B and TOM20 from indicated MEFs cultured in galactose media. Relative pixel intensity plots corresponding to orange lines in gated areas are shown on the right panels of each figure. k. OCR measured by Seahorse analyzer in the indicated MEFs (n = 6). l. Cell proliferation of MEFs cultured in the indicated medium for 2 days. m. Steady-state level of intracellular proline measured by GC-MS in indicated MEFs and 143B cells. Medium was replaced 24 hours prior to harvest. n. Western blot of the indicated MEFs showing expression level of Collagen I and DRP1. Actin is used as a loading control. The nuclei were stained with DAPI. Scale bars, 2 μm (b, insets in c, i and j) and 5 μm (c, i and j). Data are mean ± s.d. n = 3 independent replicates, unless otherwise indicated. Significance, one-way ANOVA (f) and two-way ANOVA (g, h and m) with Tukey’s multiple comparisons test. Oligo, oligomycin; FCCP, carbonyl cyanide-p-trifluoromethoxyphenylhydrazone; Rot, rotenone; AA, antimycin a.

References

    1. Spinelli JB & Haigis MC The multifaceted contributions of mitochondria to cellular metabolism. Nat Cell Biol 20, 745–754, doi:10.1038/s41556-018-0124-1 (2018). - DOI - PMC - PubMed
    1. Liu Y & Birsoy K Metabolic sensing and control in mitochondria. Mol Cell 83, 877–889, doi:10.1016/j.molcel.2023.02.016 (2023). - DOI - PMC - PubMed
    1. Quintana-Cabrera R & Scorrano L Determinants and outcomes of mitochondrial dynamics. Mol Cell 83, 857–876, doi:10.1016/j.molcel.2023.02.012 (2023). - DOI - PubMed
    1. Schworer S et al. Proline biosynthesis is a vent for TGFbeta-induced mitochondrial redox stress. EMBO J 39, e103334, doi:10.15252/embj.2019103334 (2020). - DOI - PMC - PubMed
    1. Arnold PK et al. A non-canonical tricarboxylic acid cycle underlies cellular identity. Nature 603, 477–481, doi:10.1038/s41586-022-04475-w (2022). - DOI - PMC - PubMed

LinkOut - more resources