. 2024 Dec;636(8041):251-257.
doi: 10.1038/s41586-024-08152-y. Epub 2024 Nov 6.

Nucleosome flipping drives kinetic proofreading and processivity by SWR1

Affiliations

Nucleosome flipping drives kinetic proofreading and processivity by SWR1

Paul Girvan et al. Nature. 2024 Dec.

Abstract

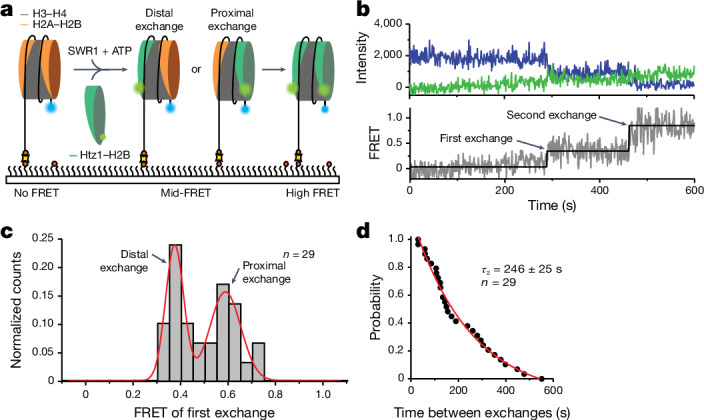
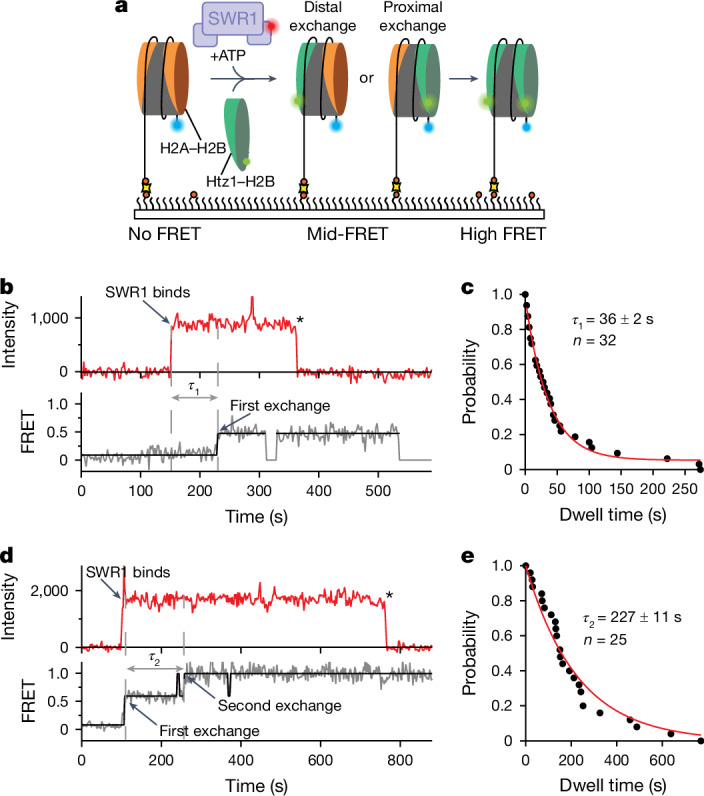
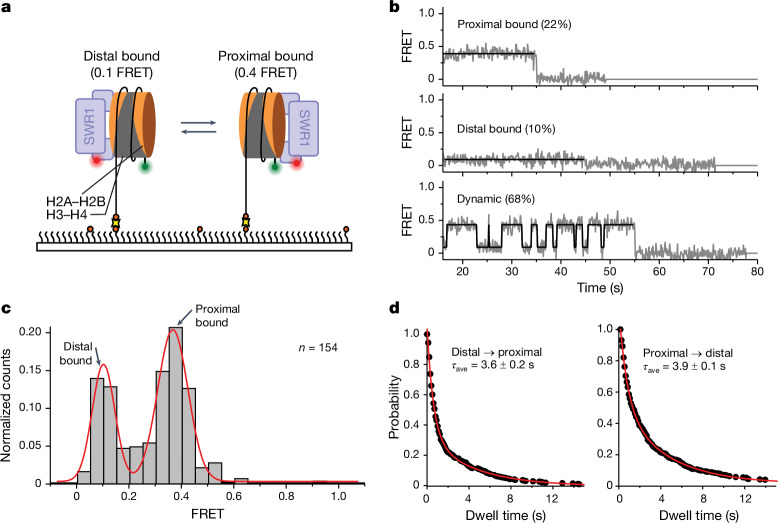
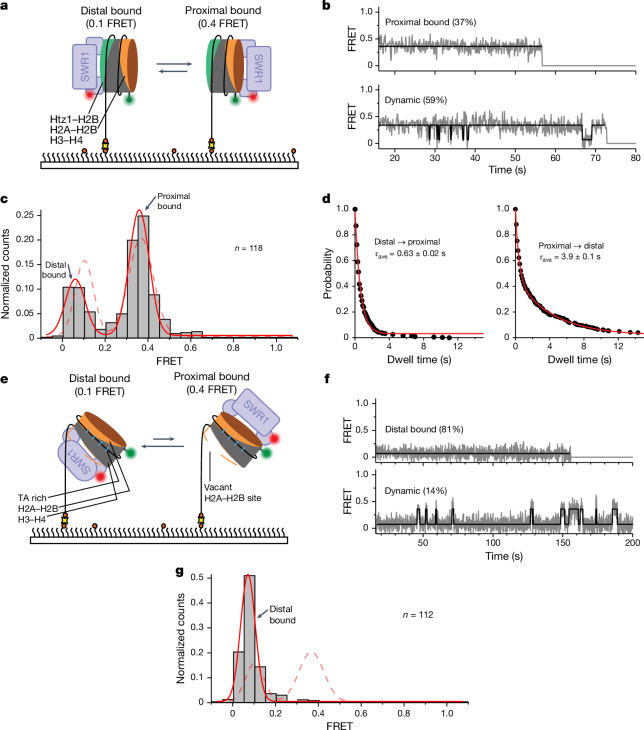
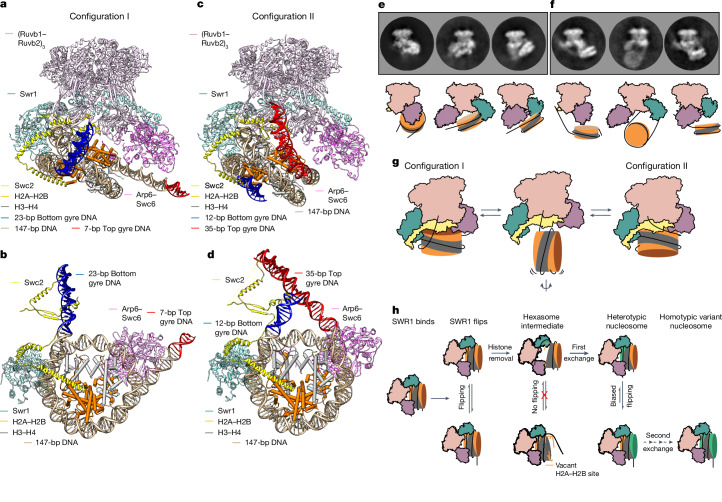
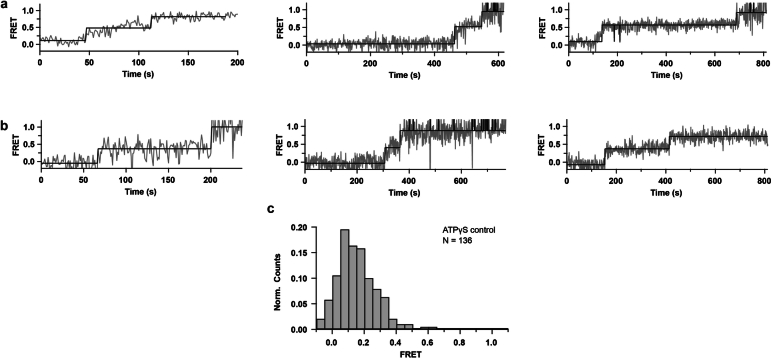
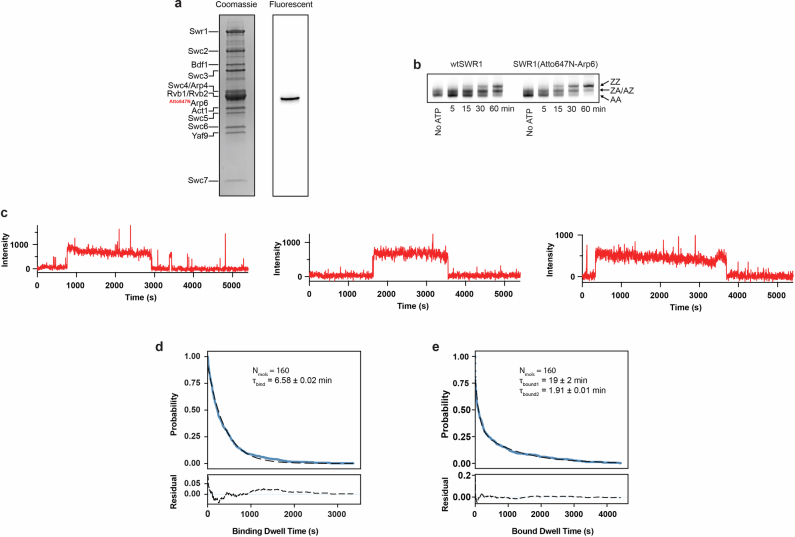
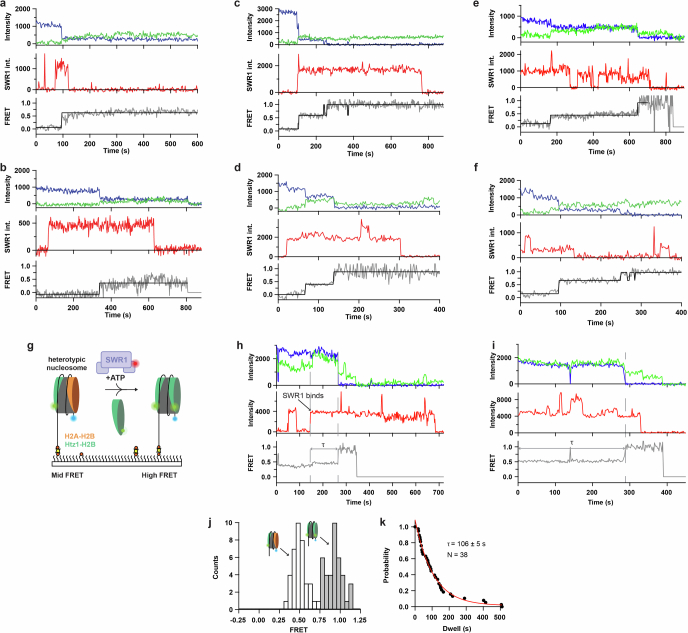
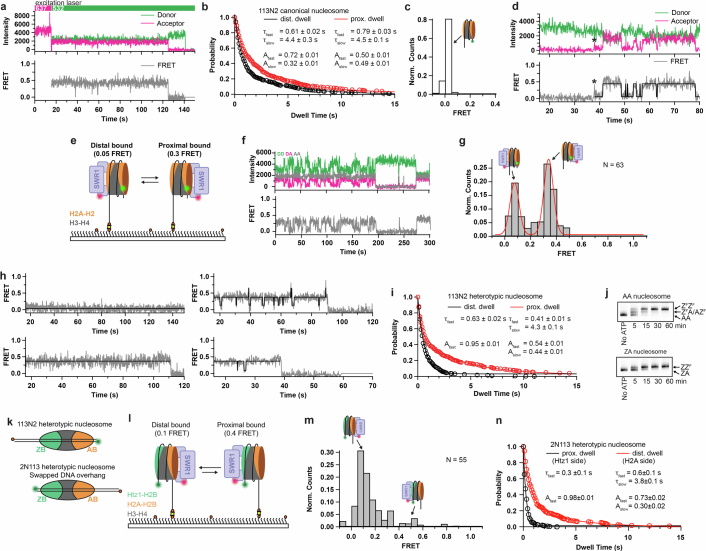
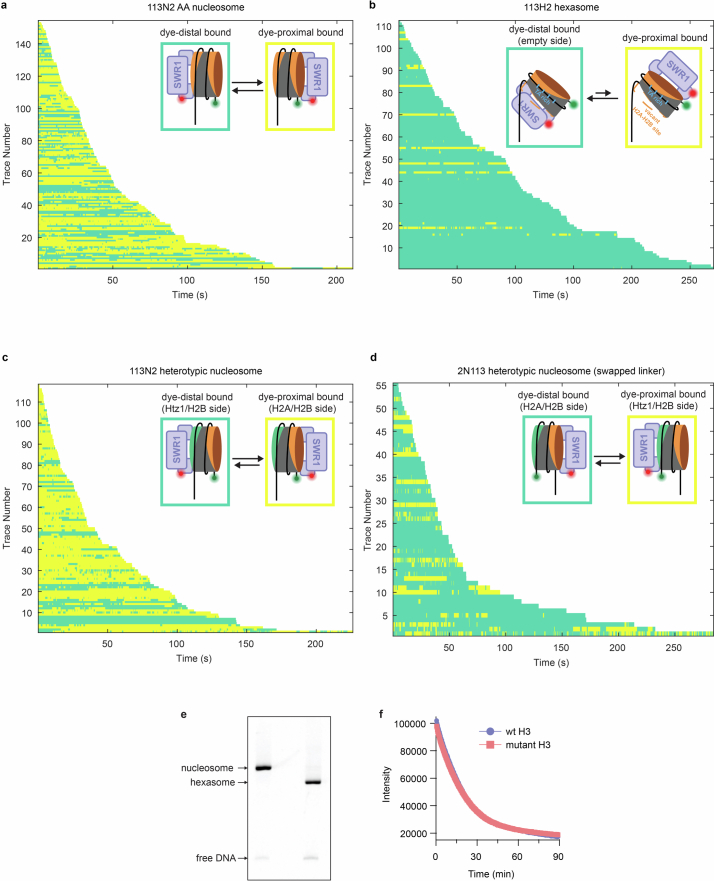
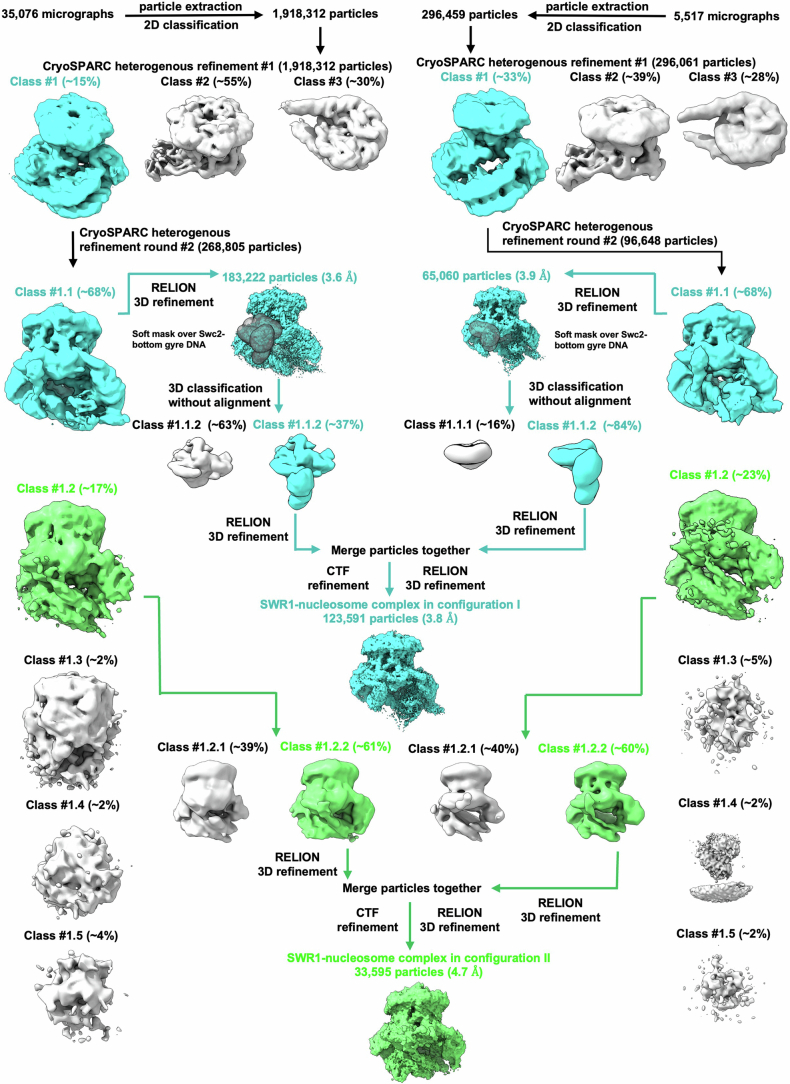
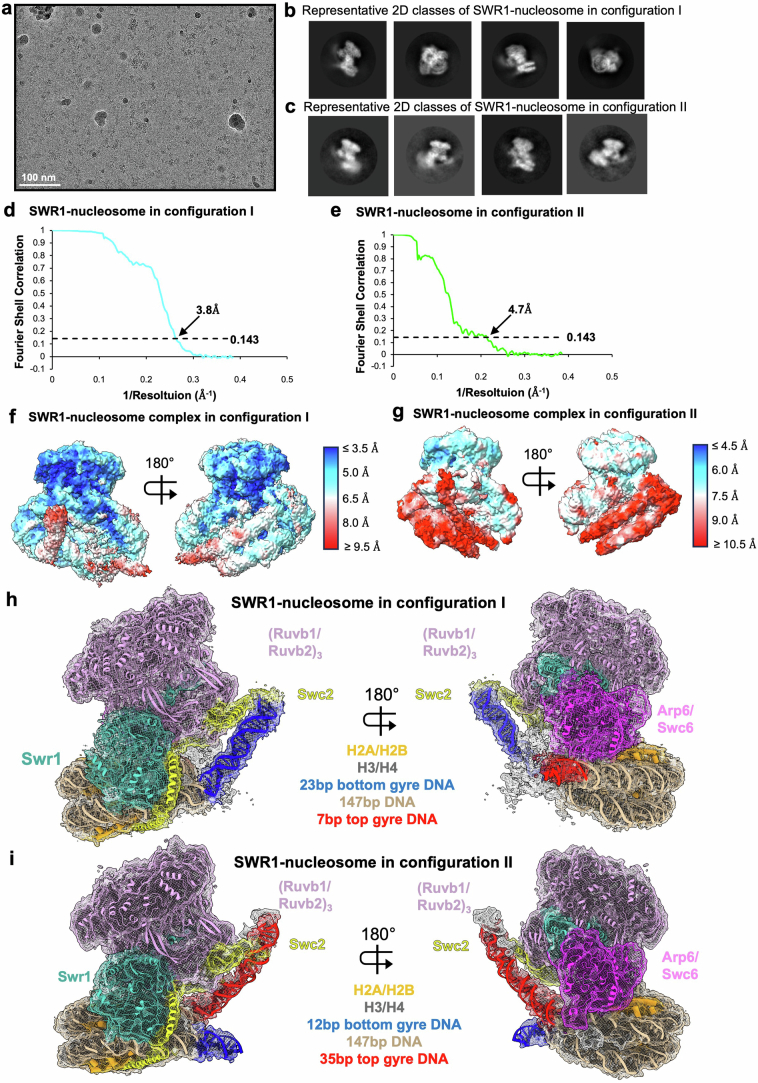
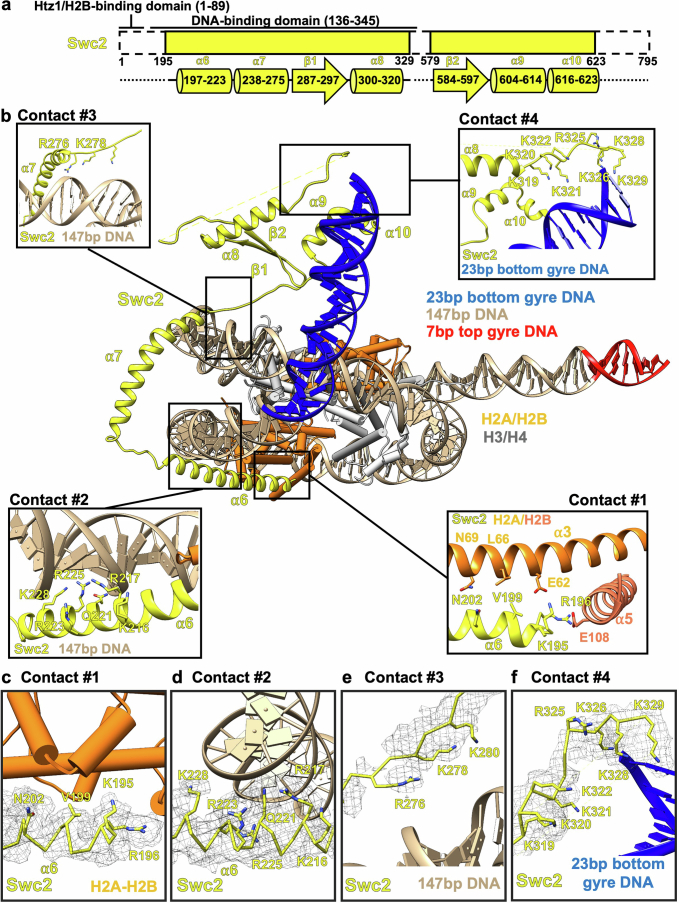
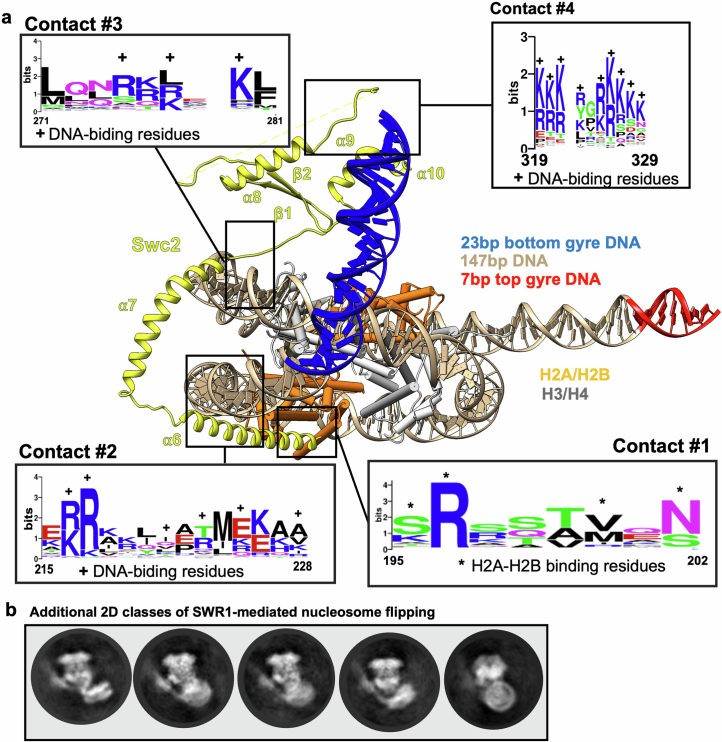
The yeast SWR1 complex catalyses the exchange of histone H2A-H2B dimers in nucleosomes, with Htz1-H2B dimers1-3. Here we used single-molecule analysis to demonstrate two-step double exchange of the two H2A-H2B dimers in a canonical yeast nucleosome with Htz1-H2B dimers, and showed that double exchange can be processive without release of the nucleosome from the SWR1 complex. Further analysis showed that bound nucleosomes flip between two states, with each presenting a different face, and hence histone dimer, to SWR1. The bound dwell time is longer when an H2A-H2B dimer is presented for exchange than when presented with an Htz1-H2B dimer. A hexasome intermediate in the reaction is bound to the SWR1 complex in a single orientation with the 'empty' site presented for dimer insertion. Cryo-electron microscopy analysis revealed different populations of complexes showing nucleosomes caught 'flipping' between different conformations without release, each placing a different dimer into position for exchange, with the Swc2 subunit having a key role in this process. Together, the data reveal a processive mechanism for double dimer exchange that explains how SWR1 can 'proofread' the dimer identities within nucleosomes.


Conflict of interest statement

Competing interests: The authors declare no competing interests.

Figures

Fig. 1
Fig. 1. Double-exchange events can be observed by smFRET.
a, Schematic of the assay. Nucleosomes (113N2.AF488) labelled with AF488 (blue) on the short 2-bp overhang are surface immobilized on a PEGylated microscope slide. SWR1, ATP and AF555–Htz1–H2B dimers (green) are flowed in to start the exchange reaction. Histone exchange is detected as a FRET increase between AF488 and AF555. b, Intensity trajectory (top) and corresponding FRET trajectory (bottom) for a single nucleosome showing a stepwise gain in FRET signal following each dimer exchange. c, Idealized FRET histogram of the first-exchange event shows two approximately equal populations of approximately 0.4 and approximately 0.6 FRET corresponding to either dye-distal or dye-proximal exchange. d, Dwell time distribution between the first and second exchanges yields a second-exchange time τ2 = 246 ± 25 s. Reported errors are the error of the fit. Source Data
Fig. 2
Fig. 2. SWR1 processively exchanges H2A–H2B for Htz1–H2B.
a, Three-colour smFRET assay with surface-immobilized AF488–nucleosome (blue), AF555–Htz1–H2B dimers (green) and SWR1(647N) (red). SWR1 binding is monitored by red fluorescence; histone exchange is detected as a FRET increase between AF488 and AF555. b, Example trace showing SWR1 binding (red; top) followed by a single-exchange event (bottom) after the exchange time (τ1). Asterisk indicates photobleaching or dissociation. c, Dwell time distribution between SWR1 binding and the first exchange (for both single and double exchanges) yields a τ1 = 36 ± 2 s. d, Example trace showing SWR1 binding (red; top) followed by two processive exchange events (bottom) with a second-exchange time (τ2). Asterisk indicates photobleaching or dissociation. e, Dwell time distribution between the first and second exchanges yields a second-exchange time τ2 = 227 ± 11 s. Reported errors are the error of the fit. Source Data
Fig. 3
Fig. 3. SWR1 flips between each face of a nucleosome.
a, Schematic of the assay. Nucleosomes (113N2.Cy3) labelled with Cy3 on the short 2-bp overhang are surface immobilized on a PEGylated microscope slide. SWR1, labelled with Atto647N on the N terminus of the Arp6 subunit (SWR1(647N)) is flowed in and allowed to bind to the nucleosome. Interactions between the nucleosome and SWR1(647N) are monitored via smFRET between the donor (green circle) and acceptor (red circle). b, Examples of typical smFRET (grey) and idealized (black) traces. Some molecules display a static FRET of either 0.4 or 0.1, whereas other molecules dynamically flip between these two FRET states. c, Idealized FRET histogram shows two major populations of SWR1(647N) bound to a nucleosome: a low-FRET (0.1) population corresponding to SWR1(647N) bound to the dye-distal side of the nucleosome, and a mid-FRET (approximately 0.4) population corresponding to SWR1(647N) bound to the dye-proximal side of the nucleosome. d, Dwell time plots for the distal-to-proximal (left) and proximal-to-distal (right) transition. The average dwell times (τave) for SWR1 bound in the distal and proximal orientations are approximately equal. Reported errors are the error of the fit. Source Data
Fig. 4
Fig. 4. Histone composition regulates SWR1 flipping kinetics.
a, Cy3-labelled surface-immobilized heterotypic nucleosomes (113N2.Cy3) containing Htz1–H2B (green) and canonical H2A–H2B dimers (orange). SWR1(647N) is flowed in and nucleosome binding is monitored via smFRET between the donor (green circle) and acceptor (red circle). b, Characteristic smFRET (grey) and idealized (black) trajectories. Some molecules (37%; ntotal = 118) display static 0.4 FRET, whereas others (59%) flip dynamically between 0.4 and 0.1 FRET. c, Idealized FRET histogram showing two populations corresponding to SWR1(647N) bound to the dye-distal Htz1–H2B (0.1 FRET) or to the dye-proximal H2A–H2B (approximately 0.4 FRET). The dashed line indicates the canonical nucleosome distribution from Fig. 3c. A small (0.04) shift of the low-FRET population may indicate altered binding to the Htz1 side. d, Dwell time plots for the distal-to-proximal (left) and proximal-to-distal (right) transition for a heterotypic nucleosome. Average dwell time (τave) on the Htz1–H2B side (distal) is shorter than the H2A–H2B side (proximal). e, Surface-immobilized hexasomes (113H2.Cy3) lacking the dye-distal H2A–H2B dimer (dashed orange line). SWR1(647N) is flowed in and hexasome binding is monitored via smFRET. f, Characteristic smFRET (grey) and idealized (black) trajectories. Molecules display a low (0.1) FRET. A small number of molecules show infrequent transitions from 0.1 to 0.4 FRET. g, Idealized FRET histogram showing one major population of SWR1(647N) bound to a hexasome. Only the low-FRET (0.1) population corresponding to SWR1(647N) bound to the vacant (dye-distal) side of the hexasome is present. The dashed line indicates the canonical nucleosome distribution from Fig. 3c. A small (0.03) shift of the low-FRET population may indicate altered binding when SWR1 faces the empty side. Reported errors are the error of the fit. Source Data
Fig. 5
Fig. 5. Structural basis of SWR1-mediated nucleosome flipping.
a, The built-in coordinates of SWR1 in complex with a canonical nucleosome at 3.8 Å resolution in configuration I. Note that the DNA emanating from the lower gyre of the nucleosome (highlighted in blue) is bent up and binding across the surface of SWR1. b, A bottom view of the SWR1–nucleosome structure in configuration I. For clarity, only Swr1 (HD1 and HD2), Swc2 and the Arp6–Swc6 complex of SWR1 are shown. c, The built-in coordinates of SWR1 in complex with a canonical nucleosome at 4.7 Å resolution in configuration II. Note that the DNA emanating from the upper gyre of the nucleosome (highlighted in red) is binding across the surface of SWR1. d, A bottom view of the SWR1–nucleosome structure in configuration II. For clarity, only Swr1 (HD1 and HD2), Swc2 and the Arp6–Swc6 complex of SWR1 are shown. e, Three representative 2D class averages of SWR1–nucleosome in the canonical conformation. A cartoon representation of each 2D class is shown beneath. f, Three representative 2D class averages of SWR1-mediated nucleosome flipping with SWR1 orientated as in panel e. A cartoon representation of each 2D class is shown beneath. g, Cartoon summary of SWR1-mediated nucleosome flipping. h, Cartoon summary of kinetic proofreading and processivity of histone exchange by the SWR1 remodeller.
Extended Data Fig. 1
Extended Data Fig. 1. Additional examples of smFRET trajectories relating to the experiment described in Fig. 1 of the main text.
a, Three examples of double exchange events where the first exchange is on the dye proximal side. b, Three examples of double exchange events where the first exchange is on the dye distal side. c, Idealized FRET histogram of an exchange reaction carried out in the presence of ATPγS. No stepwise FRET increases like the examples shown in (a) and (b) are observed. Most molecules exhibit static low FRET.
Extended Data Fig. 2
Extended Data Fig. 2. Fluorescently labelled SWR1 and measuring nucleosome bound lifetime.
a, SWR1 was specifically labelled with Atto647N on the N-terminus of the Arp6 subunit. Coomassie stained gel of the purified complex shows the presence of all expected SWR1 subunits (left). The same gel imaged for fluorescence shows that only the Arp6 subunit has been fluorescently labelled (right). Representative gel of three independent preparations. For gel source data, see Supplementary Fig. 1. b, Bulk activity assay using the insertion of a FLAG tagged Htz1–H2B dimer as a readout for exchange. Exchange activity of the labelled SWR1 complex is retained. Representative gel of two independent experiments using enzyme from separate purifications. For gel source data, see Supplementary Fig. 1. c, Three example single molecule intensity trajectories of SWR1(647N) colocalization to surface immobilized nucleosomes. d, Dwell time plot of SWR1(647N) binding times. Data is shown fit to a single exponential decay (with residuals below). On average SWR1 takes 6.58 ± 0.02 min to bind under our experimental conditions. e, Dwell time plot of the lifetime of SWR1(647N) bound to a nucleosome. Data is shown fit to a double exponential decay (with residuals below). Two types of bound complex are present, one stably bound (lifetime 19 ± 2 min) and one more transiently bound (lifetime 1.91 ± 0.01 min). We tentatively assign the transiently bound species to SWR1(647N) interacting with the extranucleosomal DNA, and the stably bound species to SWR1(647N) engaging properly with the nucleosome. Reported errors are the error of the fit.
Extended Data Fig. 3
Extended Data Fig. 3. Additional examples of trajectories relating to the experiment described in Fig. 2 of the main text, and exchange of a heterotypic nucleosome.
a, & b, Single exchange events, where the exchange event is preceded by SWR1 binding. c, & d, Processive double exchange events. A single SWR1 binding event is followed by two consecutive exchange events. (Data in (c) is from Fig. 2d of the main text, replotted here to additionally show the donor and acceptor trajectories.) e, Distributive double exchange event. Following the first exchange SWR1 dissociates. The second exchange is preceded by a SWR1 binding event. f, Ambiguous double exchange example. SWR1 either dissociates or photobleaches between the first and second exchange events. g, Schematic of three-color smFRET assay using a heterotypic nucleosome as the substrate. Schematic is colored similarly to Fig. 2a of the main text. h, & i, Example trajectories showing SWR1 binding and histone exchange of a heterotypic nucleosome substrate. j, Histogram showing the FRET before (white bars) and after (grey bars) exchange, for a heterotypic nucleosome. k, Distribution of the time between SWR1 binding and histone exchange yields an exchange time of 106 ± 5 s for a heterotypic nucleosome. Reported errors are the error of the fit.
Extended Data Fig. 4
Extended Data Fig. 4. Additional data and controls relating to the experiments in Figs. 3 and 4 of the main text.
a, Example fluorescence intensity trajectory (top) and corresponding FRET trajectory (bottom) resulting from SWR1(647N) bound to a surface immobilized nucleosome. The excitation scheme used is illustrated with the magenta and green bars (top). After locating SWR1(647N) bound nucleosomes with red excitation, FRET between the nucleosome and SWR1(647N) is monitored using green excitation. Single step photobleaching of the acceptor and donor indicate a single FRET pair. b, Dwell time plot of the dwell times in the proximal or distal bound configurations for a nucleosome containing two H2A–H2B dimers (data from Fig. 3d, replotted here to show additional details of the fit). Dwell time is fit to a double exponential decay. The lifetimes in the fast (τfast) and slow (τslow) phases are indicated, along with the corresponding amplitudes (Afast, Aslow). The lifetimes are approximately equal regardless of SWR1 orientation. c, FRET histogram of nucleosome (donor) only control displaying zero FRET in the absence of any SWR1(647N) (acceptor). d, Example fluorescence intensity trajectory (top) and corresponding FRET trajectory (bottom) showing SWR1(647N) binding to a surface immobilized nucleosome (indicated by *), and subsequently flipping between dye-distal and dye-proximal orientations. SWR1(647N) binding results in a small but detectable non-zero FRET. (Note: such a trajectory would not be included in subsequent analysis as it does not satisfy the criterion of having SWR1(647N) bound at the start of data acquisition, but is shown here to illustrate detection of SWR1(647N) binding and flipping.) e, Schematic of the assay where the donor fluorophore is placed on one of the H2A histones: Nucleosomes (113N2) labelled with Cy3B on the linker-distal H2A are surface immobilized. SWR1(647N) is flowed in and allowed to bind the nucleosomes. SWR1(647N)–nucleosome interactions are monitored via FRET. Repositioning the FRET donor from the short DNA overhang (as used throughout the rest of this work) to the linker-distal H2A results in lower FRET efficiencies. To identify these true low-FRET values we employed alternating laser excitation throughout the entire acquisition. f, Trajectory of a dynamic SWR1(647N) bound nucleosome showing donor emission upon donor excitation (DD, green trace, top); acceptor emission upon donor excitation (DA, magenta trace, top); acceptor emission upon acceptor excitation (AA, gray trace, top). DD and DA are used for calculating apparent FRET efficiency (gray trace, bottom). g, Idealized FRET histogram shows two major populations of SWR1(647N)–bound nucleosomes. We observe similar ratios of the two states regardless of FRET donor position (c.f. Fig. 3). h, Additional smFRET traces from the experiment described in Fig. 4b. i, Dwell time plot of the dwell times in the proximal or distal bound configurations for a heterotypic nucleosome containing one Htz1–H2B and one H2A–H2B dimer (data from Fig. 4d, replotted here to show additional details of the fit). While the time spent on the distal side (i.e., the side containing Htz1) is well described by a single exponential decay, the proximal (H2A containing side) is best fit to a double exponential decay. Compare with (b). The lifetimes in the fast (τfast) and slow (τslow) phases are indicated, along with the corresponding amplitudes (Afast, Aslow). j, Bulk assay showing the exchange of a canonical H2A–H2B nucleosome (AA) compared to a heterotypic nucleosome containing one Htz1–H2B and one H2A–H2B dimer (ZA). The insertion of a FLAG tagged Htz1–H2B dimer is used as a readout for exchange. The AA nucleosome undergoes two consecutive rounds of exchange (indicated by the appearance of a double band shift). However, the ZA nucleosome can only be exchanged once (single band shift) indicating that SWR1 does not remove Htz1–H2B dimers from a nucleosome. Representative gel of two independent experiments using enzyme from separate purifications. For gel source data, see Supplementary Fig. 1. k, Cartoons of 113N2 heterotypic nucleosome (top) and 2N113 swapped DNA overhang heterotypic nucleosome (bottom). The position of the Cy3 fluorophore (green circle) and biotin (orange circle) are shown. Swapping the DNA overhang orientation with respect to the 601 positioning sequence results in the Htz1–H2B variant histone either being adjacent or opposite to the long DNA overhang. l, Swapped DNA overhang heterotypic nucleosomes (Cy3.2N113) containing one Htz1–H2B dimer (green) and one canonical H2A–H2B dimer (orange) Cy3-labeled on the 2 bp overhang are surface immobilized. SWR1647N is flowed in and allowed to bind to the nucleosome. SWR1(647N)–nucleosome interactions are monitored via FRET. m, Idealized FRET histogram shows a main population at low (0.1) FRET (c.f. Fig. 4c). n, Dwell time plots for the distal to proximal (red) and proximal to distal (black) transition for a 2N113 heterotypic nucleosome. Binding to the H2A–H2B face of the nucleosome is more stable than binding to the Htz1–H2B face, irrespective of the location of the long DNA overhang.
Extended Data Fig. 5
Extended Data Fig. 5. Rastergrams summarising the nucleosome flipping data for different nucleosomes/hexasome, and preparation of yeast hexasomes.
a-d, Each horizontal line represents a smFRET trajectory, ordered by photobleaching/dissociation time. Color indicates whether SWR1 is bound in the dye-distal (green) or dye-proximal (yellow) orientations. Thresholding (at 0.25 FRET) of the idealized FRET trajectories was used to determine the two states. Data is shown for: a, Canonical H2A–H2B 113N2 nucleosomes. b, Hexasomes 113H2 containing only one H2A–H2B dimer. c, Heterotypic nucleosomes 113N2 containing both H2A–H2B and Htz1–H2B histones. d, Swapped linker heterotypic nucleosomes 2N113 containing both H2A–H2B and Htz1–H2B histones. e, Native PAGE comparing a nucleosome and hexasome sample. Representative gel of two independent preparations. f, H3MPQ mutations required for formation of S. cerevisiae hexasomes and heterotypic nucleosomes (see Methods) have no effect on SWR1 exchange activity as measured by bulk FRET decrease.
Extended Data Fig. 6
Extended Data Fig. 6. Schematic overview of the cryoEM processing.
Schemes for the 3.8 Å SWR1–nucleosome complex in configuration I (cyan) and the 4.7 Å SWR1–nucleosome complex in configuration II (green) datasets.
Extended Data Fig. 7
Extended Data Fig. 7. Cryo-EM analysis of the SWR1–nucleosome in configuration I (3.8 Å) and SWR1–nucleosome in configuration II (4.7 Å) volumes.
a, Representative micrograph out of 35,076 micrographs from the SWR1–nucleosome dataset. A scale bar is shown at the bottom left. b, Four representative 2D classes of SWR1–nucleosome complex in configuration I. c, Four representative 2D classes of SWR1–nucleosome complex in configuration II. d, gFSC curve of the SWR1–nucleosome in configuration I volume. e, gFSC curve of the SWR1–nucleosome configuration II volume. f, Local resolution of the SWR1–nucleosome complex in configuration I. g, Local resolution of SWR1–nucleosome in configuration II. h, Overview of the SWR1–nucleosome complex in configuration I at 3.8 Å. i, Overview of the SWR1–nucleosome complex in configuration II at 4.7 Å.
Extended Data Fig. 8
Extended Data Fig. 8. Details of the interaction between Swc2 and the nucleosome in the SWR1–nucleosome in configuration I.
a, Linearized cartoon of the Swc2 subunit, the built-in coordinates are represented in yellow. The Htz1–H2B binding domain (residues 1–89) and the DNA-binding domain (residues 136–345) are highlighted. b, The residues of Swc2 that binds the DNA or interact with the H2A–H2B histones are highlighted The interaction between Swc2 and the nucleosome in the SWR1–nucleosome complex in configuration I. For simplicity, only the built in coordinates of Swc2 and the nucleosome is shown. c, Representative density for Swc2 at contact 1 (contoured at 2σ) in the SWR1–nucleosome in configuration I complex. d, Representative density for Swc2 at contact 2 (contoured at 2.5σ) in the SWR1–nucleosome in configuration I complex. The side chains of Swc2 that interacts with nucleosomal DNA is shown. e, Representative density for Swc2 at contact #3 (contoured at 5.5σ). in the SWR1–nucleosome in configuration I complex. The side chains of Swc2 that interacts with the nucleosomal DNA is shown. f, Representative density for Swc2 at contact #4 (contoured at 3σ). in the SWR1–nucleosome in configuration I complex. The side chains of Swc2 that interacts with the bottom gyre nucleosomal DNA is shown.
Extended Data Fig. 9
Extended Data Fig. 9. Residues that interact with the nucleosome are conserved between Swc2-like proteins, and additional 2D classes of SWR1-mediated nucleosome flipping.
a, The interaction between Swc2 and the nucleosome in the SWR1–nucleosome complex in configuration I. For simplicity, only the built-in coordinates of Swc2 and the nucleosome are shown. The four different contacts between Swc2 and the nucleosome are highlighted. An alignment of 116 Swc2-like proteins across various species was used to generate a sequence logo to display sequence conservation. The residues of Swc2 that bind the DNA or interact with the H2A–H2B histones are highlighted. b, Five additional intermediates of SWR1-mediated nucleosome flipping are visible after 2D classification.

References

    1. Krogan, N. J. et al. A Snf2 family ATPase complex required for recruitment of the histone H2A variant Htz1. Mol. Cell12, 1565–1576 (2003). - PubMed
    1. Mizuguchi, G. et al. ATP-driven exchange of histone H2AZ variant catalyzed by SWR1 chromatin remodeling complex. Science303, 343–348 (2004). - PubMed
    1. Kobor, M. S. et al. A protein complex containing the conserved Swi2/Snf2-related ATPase Swr1p deposits histone variant H2A.Z into euchromatin. PLoS Biol.2, e131 (2004). - PMC - PubMed
    1. Luger, K., Mäder, A. W., Richmond, R. K., Sargent, D. F. & Richmond, T. J. Crystal structure of the nucleosome core particle at 2.8 Å resolution. Nature389, 251–260 (1997). - PubMed
    1. Talbert, P. B. & Henikoff, S. Histone variants at a glance. J. Cell Sci.134, jcs244749 (2021). - PMC - PubMed

MeSH terms

LinkOut - more resources